-
Stocks climb post-Fed Minutes release, but close lower on rates hike risk
-
FANGs outperform
-
Semiconductors underperform, dragged down by NVDA and AMD
- Bitcoin plunges...again
-
Minutes from the last ECB meeting will be released later today.
-
Fed policy makers due to speak include New York Fed President William Dudley and Atlanta Fed President Raphael Bostic.
-
The STOXX Europe 600 Index decreased 0.6 percent as of 8:23 a.m. London time (3:23 EST).
-
Futures on the S&P 500 Index fell 0.1 percent, to the lowest level in more than a week.
-
The MSCI AC Asia Pacific Index declined 0.9 percent, to the lowest level in more than a week, on the largest drop in almost two weeks.
-
The UK FTSE 100 Index declined 0.9 percent, to the lowest level in more than a week, on the biggest drop in almost two weeks.
-
The MSCI Emerging Markets Index declined 1 percent, the largest drop in almost two weeks.
-
The dollar index declined less than 0.1 percent.
-
The euro decreased 0.1 percent to $1.2272, the weakest level in almost two weeks.
-
The British pound dipped 0.2 percent to $1.3889, reaching the weakest in more than a week on its fifth consecutive decline.
-
The Japanese yen gained 0.4 percent to 107.38 per dollar, the first advance in a week.
-
South Africa’s rand sank 0.5 percent to 11.7197 per dollar.
-
The MSCI Emerging Market Currency Index sank 0.4 percent to the lowest level in more than a week, on the largest decrease in two weeks.
-
The yield on 10-year US Treasurys dipped two basis points to 2.93 percent.
-
Germany’s 10-year yield rose one basis point to 0.73 percent.
-
Britain’s 10-year yield climbed one basis point to 1.555 percent.
-
WTI declined 1 percent to $61.08 a barrel, the lowest level in more than a week, on the largest drop in almost two weeks.
-
Gold fell 0.2 percent to $1,321.60 an ounce, reaching the weakest level in almost two weeks, on its fifth consecutive decline.
Key Events
Yesterday the three major US indices—the S&P 500, Dow Jones Industrial Average and NASDAQ Composite—closed lower for a second day, bring the total market decline to more than one percent.
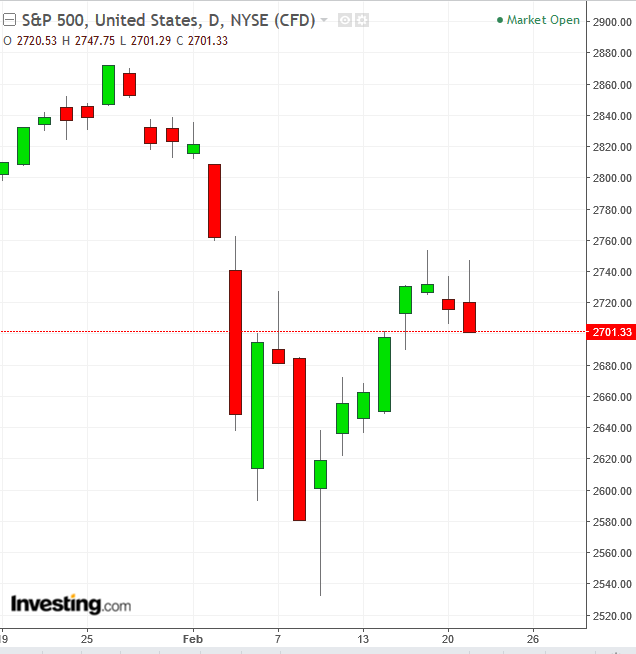
The S&P 500 dropped 0.55 percent on the day, for a combined 1.12 percent over two days, trimming the 5.85 percent rebound made over the six days between February 9-16 back to 4.65 percent.
Prices first rose in attempt to overcome Friday’s bearish Shooting Star. However, bears proved to be just as adamant as they had been on Friday, pushing prices back to where bulls started, to 2,720.53 and even lower, to close at 2,701.33, at the bottom of the trade.
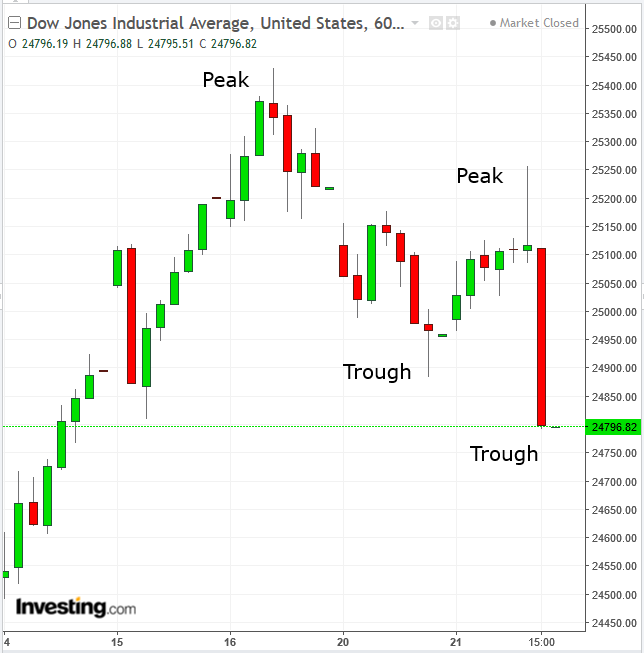
The Dow slid 0.66 percent for the day and 1.66 percent over the past two sessions.
Stocks listed on all indices first climbed following the release of the Fed Minutes, as investors shot buy orders first and asked questions later. Policy makers’ outlook for economic growth, as well as inflation's move higher, toward the Fed's 2-percent target turned investors bullish.
It was only during the last few hours of yesterday's US session that another narrative gripped investors, bringing out their inner bear. They couldn't shake the notion that higher inflation threatens to increase the cost of borrowing—not just for them, but for businesses too, ultimately impairing their valuations.
Foreseeing a downturn, traders raced their peers to unload stocks at current prices, thereby pushing prices down in a self-fulfilling prophecy. Technically, the three major indices that closed lower reversed their trends from up to down, on an hourly basis, registering descending peaks and troughs.
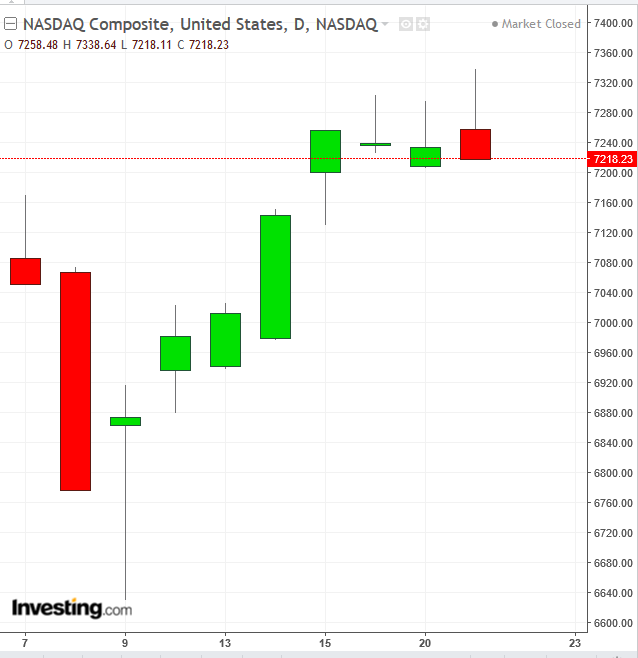
The NASDAQ declined 0.2 percent for the day and 0.28 percent over the last two days. Unlike the SPX and the Dow, its intraday high overcame Friday’s shooting star. However, the bears pushed it back down.
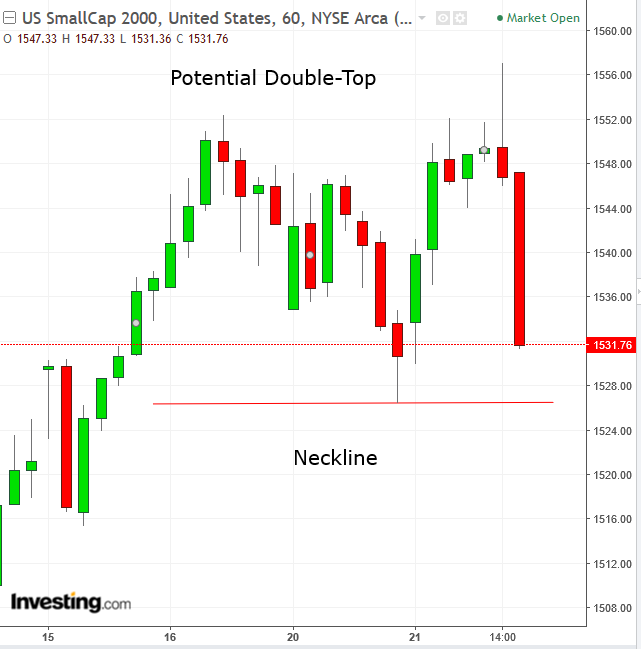
The Russell 2000, on the other hand, bucked the trend by closing 0.8 percent in the green, showing once again how it goes its own way, in either direction. Should it fall below Tuesday’s 1,525 low, it will have completed an hourly double top.
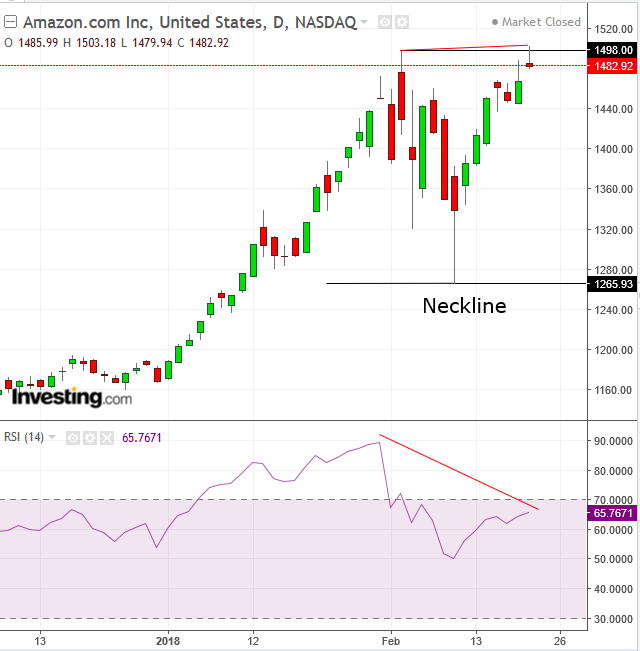
Yesterday's outperformers were the FANGs—Facebook (NASDAQ:FB), Amazon (NASDAQ:AMZN), Netflix (NASDAQ:NFLX) and Alphabet (NASDAQ:GOOGL)—all ended higher. Technically, while Amazon did register a new all-time high, it also formed a bearish shooting star at the resistance level of the previous February 2 peak. As well, it formed a negative divergence with the RSI, which shows that momentum has been fading, suggesting a reversal. A break of the $1,265 level would complete a double-top.
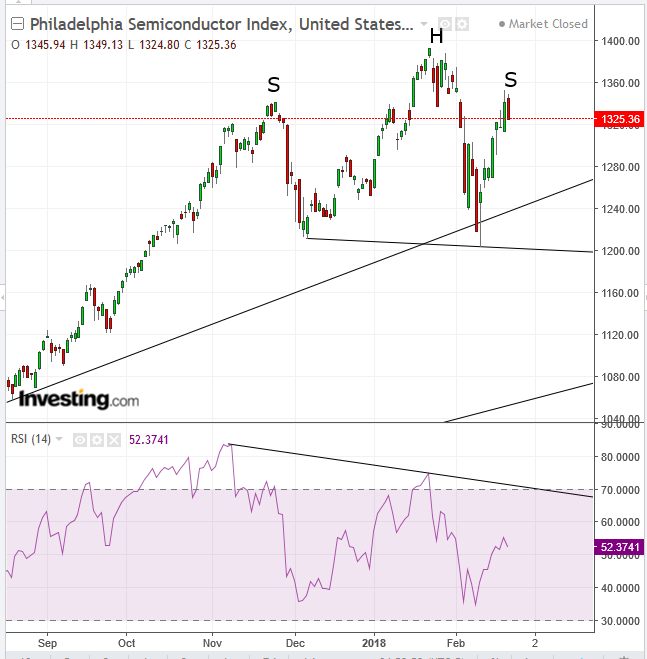
Chipmakers were the day's laggards. The Philadelphia Semiconductor Index (SOX), closed more than one percent lower, dragged down by NVIDIA (NASDAQ:NVDA) and Advanced Micro Devices (NASDAQ:AMD).
The two tech companies, both producers of graphic cards used for cryptocurrency mining, lost 3 percent and 2.45 percent respectively. They probably mirrored losses in Bitcoin, as the digital token plunged 6.8 percent.
The SOX decline occurred at the same price level as two peaks ago, giving all the telltale signs of an H&S top, with a negatively diverging momentum, as shown by RSI.
So, despite the fact that bonds were lower alongside other safe haven assets, there was certainly a risk-off tone to yesterday's trading, marked by another ugly bearish reversal for stocks.
One thing that didn’t help equity prices was the dollar climbing for a fourth day, in opposition to last week's downtrend, which helped equities at that time enjoy their strongest comeback in years.
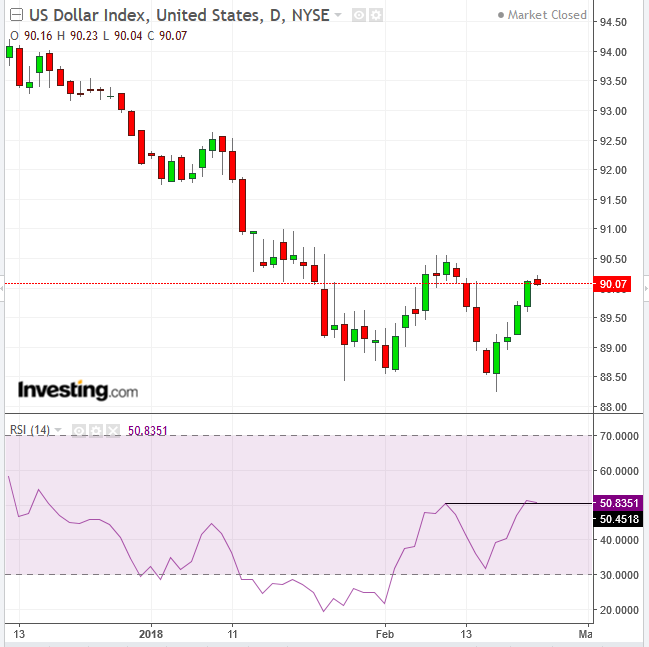
Despite the fact that the dollar is losing ground this morning, the RSI provided a positive divergence, as momentum increased ahead of price, suggesting price may yet follow.
Global Financial Affairs
Even with the relatively healthy picture painted by the Fed minutes, global stocks resumed their selloff this morning, driven by ongoing worries of tighter monetary policy.
The STOXX Europe 600 Index slid, dragged lower by all the major European stock benchmarks. Earlier in Asia most shares also dropped, though China’s market bucked the trend as it reopened after a holiday. S&P 500 futures also fell.
Investors are likely to now seesaw back and forth between the prospect of business growth thanks to a strong economic backdrop and companies losing profits due to higher borrowing costs, which ultimately will spark volatility.
Meanwhile, February is proving to be one of the worst months for global equities in over a year.
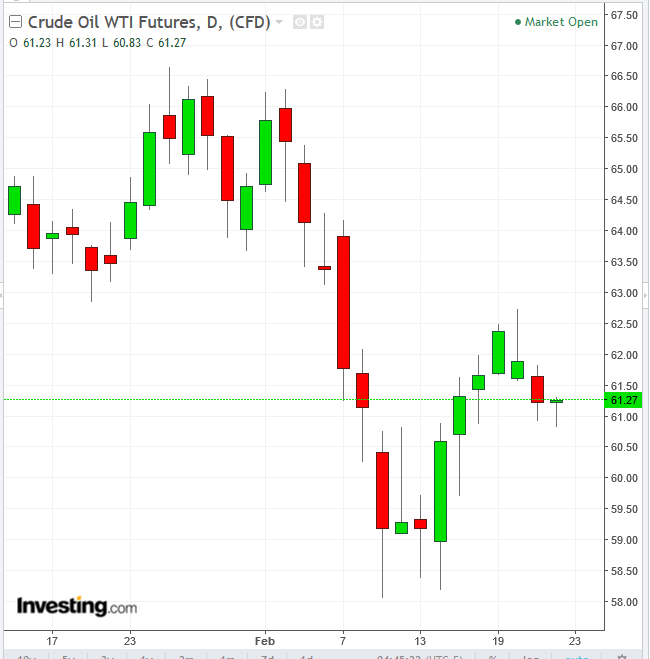
Crude oil recouped losses and is now on the rise, back above $61.
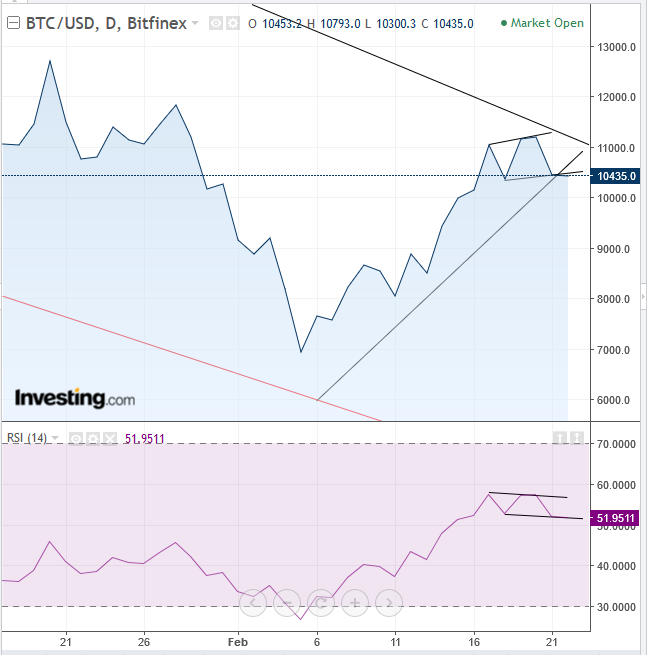
Bitcoin continues to be pounded by negative news, as the owner of BitFunder, a long-defunct Bitcoin-denominated stock exchange, was arrested by the US government on Wednesday, and Taiwan experienced its first Bitcoin robbery.
The price of the cryptocurrency remains at an impasse as the longer term downtrend and the shorter term uptrend are working out the trend. The RSI provides a negative divergence, suggesting price will follow momentum down, in agreement with the long term trend.
Up Ahead
Market Moves
Stocks
Currencies
Bonds
Commodities
