- U.S. futures climb as investors disregard lowest Chinese growth in three decades, U.S. inflation increase
- Chinese shares outperform on industrial, retail data beat and expectation of economic stimulus
- Treasury yields gain ground, dollar slips
- Oil rebounds, helped by technicals, after sliding on China's GDP flop
- JPMorgan Chase & Co (NYSE:JPM), Bank of America (NYSE:BAC), Goldman Sachs Group (NYSE:GS) and Taiwan Semiconductor Manufacturing (NYSE:TSM) are among companies due to report results this week.
- U.S. June retail sales, due on Tuesday, are expected to rise from the prior month.
- Monetary policy decisions are due in Indonesia, South Korea and South Africa on Thursday.
- The U.K.’s FTSE 100 rose 0.3%, the first advance in more than a week.
- The MSCI Asia Pacific Index increased 0.2% to the highest in more than a week.
- The MSCI Emerging Market Index gained 0.5% to the highest in more than a week.
- The Dollar Index declined less than 0.05% to the lowest in more than a week.
- The British pound was unchanged at $1.2572, the strongest in more than a week.
- The Japanese yen dropped 0.1% to 108.00 per dollar.
- The euro rose 0.1% to $1.1278, the strongest in more than a week.
- The yield on 10-year Treasurys climbed one basis point to 2.14%.
- Germany’s 10-year yield slid less than one basis point to -0.21%, the first retreat in a week.
- Britain’s 10-year yield slipped less than one basis point to 0.833%, the biggest fall in a week.
- Gold declined 0.2% to $1,413.06 an ounce.
- West Texas Intermediate crude increased less than 0.05% to $60.22 a barrel.
Key Events
Futures on the S&P 500, Dow and NASDAQ 100 extended the Fed-driven rally this morning, with SPX contracts hitting a fresh all-time high ahead of more central bank's speeches and earnings reports from some of the U.S. largest banks.
Europe's STOXX 600 wavered, with automobile producers and chemical firms pushing prices higher.
Trading was thin in the earlier Asian session due to a Japanese holiday, but regional shares still managed to notch higher after China’s industrial output and retail sales topped all forecasts. Investors prioritized signs of economic strengthening while shrugging off a more gloomy outlook coming from another key front: China's second-quarter GDP slowed to 6.2%, the weakest pace in over 27 years. The market's narrative banked on economic stabilization that would stem from what was seen as a likely move, by Chinese policymakers, to step up economic stimulus.
The country’s Shanghai Composite (+0.4%) outperformed, highlighting investors' focus on the silver linings, while Australia’s S&P/ASX 200 (-0.65%) lagged with financials. Wealth manager AMP (ASX:AMP) was the top loser on both the sub-index and the benchmark, shedding nearly 16% on the day, to a record low. Its shares dived after the company said regulatory constraints in New Zealand will most likely push it to shelve sale plans for its life insurance and wealth protection business. The firm also cancelled its interim dividend. Miners shares, however, offset a deeper selloff.

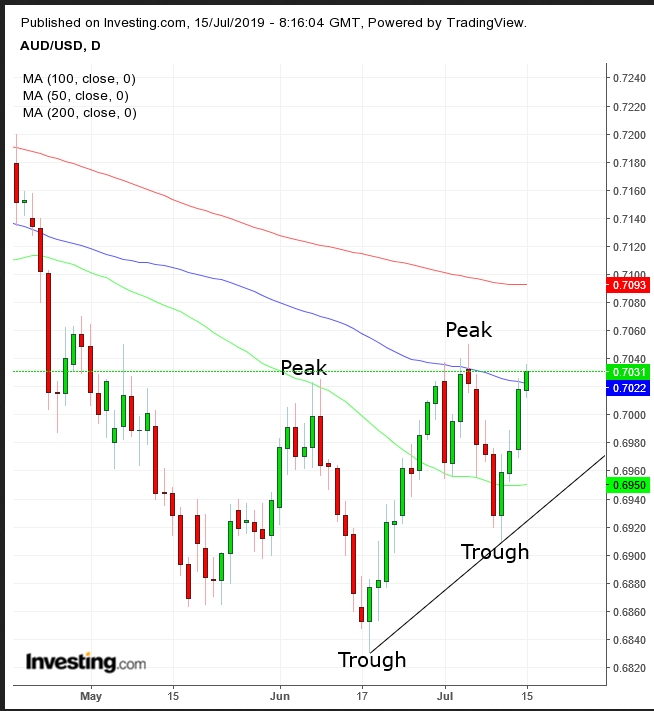
The Australian dollar jumped for the fourth straight day to the highest level since April 30 on the strong data beat posted by China, which is Australia’s biggest trading partner.
Global Financial Affairs
On Friday, both the S&P 500 and the Dow Jones Industrial Average carved out all-time highs for the second straight day, as well as a second straight weekly gain. Investors were counting on global monetary policy easing, disregarding an inflation uptick in U.S. inflation that threatens to affect the Fed's path to lower rates, similarly to Friday’s strong nonfarm payroll numbers.

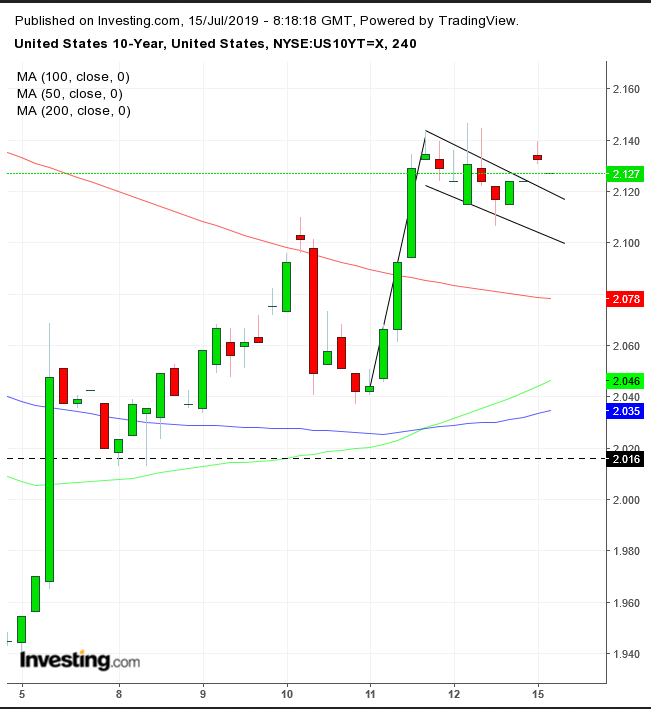
Meanwhile, yields on 10-year Treasurys pared an advance but continued to edge higher, after they completed a bullish, falling flag on the 4-hour chart, suggesting more upside potential.
The Dollar Index edged lower, posting a fourth consecutive drop after falling back below the medium-term uptrend line and into the short-term falling channel. The greenback has been fluctuating above the 200 DMA, which has proved support this month.
Bitcoin has plunged about 14% since Friday as criticism from President Donald Trump, attacking cryptos' high volatility and legal risks, reignited doubts over the validity of this year’s rally. Technically, the price found support at the 50 DMA and the previous low at July 2. However, it also failed to best the June highs, which means that, as of now, the digital currency is contracting.

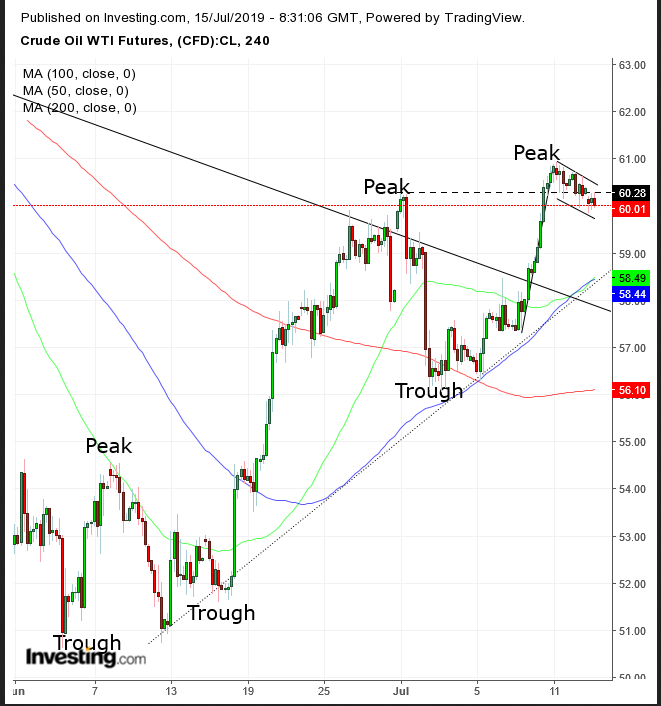
Oil prices rebounded after slipping on China’s GDP flop, which reawakened fears that fuel demand by the world’s largest crude importer is slowing. Technically, the price for WTI may be setting up for a repeat of last week’s 6% jump as it develops a bullish, falling flag.
Up Ahead
Market Moves
Stocks
Currencies
Bonds
Commodities
