- U.S. futures, European shares remain under pressure despite China confirming trade talks
- U.S. indices pare losses but VIX spikes, raising a red flag
- Yen continues to strengthen but drivers are unclear
- Oil slides amid Persian Gulf tensions
Key Events
Global investors remained cautious this morning as uncertainty lingered on the trade front. While on the one hand China’s confirmation that its top trade negotiator, Vice Premier Liu He, will join talks in Washington this week as planned eased concerns that negotiations would hit a new deadlock, on the other hand the U.S. has yet to backtrack from its threats to increase tariffs on Chinese goods.
Futures on the S&P 500, Dow and NASDAQ 100 remained under pressure but trimmed steeper losses after Chinese officials dispelled reports that they wouldn't participate in the next round of meetings—with contracts on the SPX bouncing from a 0.8% slide.
Europe's benchmark index STOXX 600 also hovered in the red, squeezed in a range molded by falling banks shares on one side and rising telecommunications stocks on the other.
In the earlier Asian session, regional equities shrugged off yesterday’s lows. China’s Shanghai Composite was up 0.69%, suggesting investors consider the U.S. rhetoric as little more than posturing. Japan’s Nikkei 225, however, was down 1.6%, as traders rebalanced prices after a 10-day hiatus in honor of the ascension of new emperor Naruhito. South Korea’s KOSPI was down 0.88%, also re-opening after a holiday.
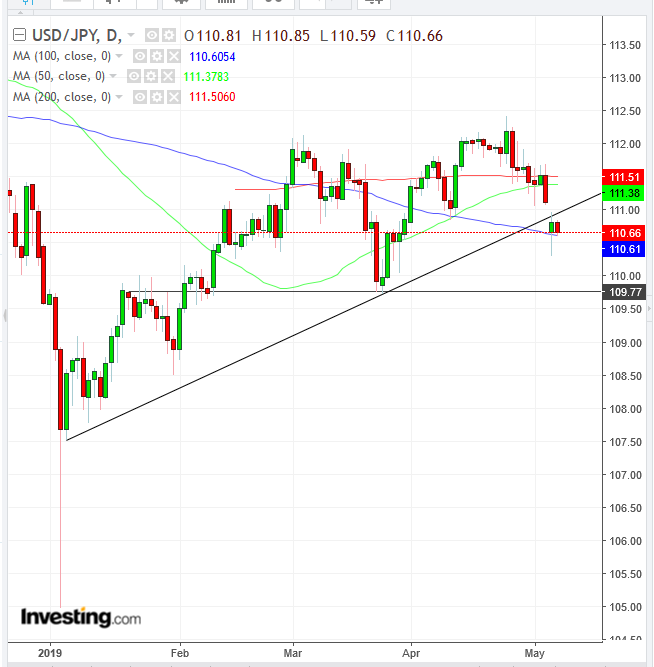
Meanwhile, the yen continued to strengthen against the dollar, but it isn’t clear whether the move is due to the currency's safe-haven status or because of conflicting interpretations of comments, by other G7 countries, about its recent weakness.
The outlook of increasingly aggressive monetary policy by the Bank of Japan to overcome persisting deflation has propelled the yen into a downtrend from the beginning of the year, while buoying equities to nearly 3-year highs. Technically, the USD/JPY pair fell below the uptrend line of the year, increasing the potential for a double top, suggesting an ascending yen despite the BoJ's rhetoric.
Global Financial Affairs
On Monday, U.S. stocks took the brunt of the most dramatic volatility since the December rout. However, they later managed to pare much of the losses—even before positive confirmations from China. As we have often pointed out, investors have been desensitized to political risk since the Brexit vote in June 2016. It took them 3 days to recoup the selloff after the shocking results, 3 hours to rebalance prices after Donald Trump won the U.S. presidential elections, and 3 minutes to buy into the dip of the Italian referendum that prompted former Prime Minister Matteo Renzi to resign and helped eurosceptic parties gain more and more traction. Yesterday’s miraculous rebound resumes that trend.
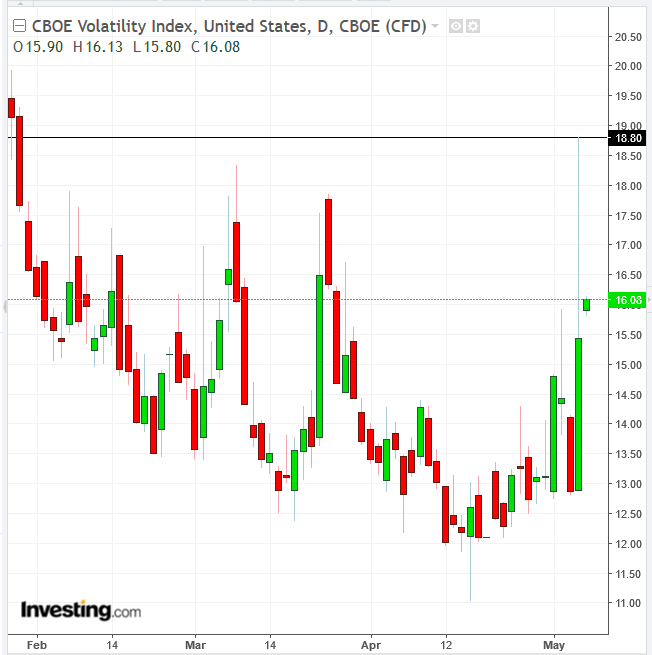
However, CBOE contracts speculating on market volatility spiked to levels not seen since late January, closing at the highest levels since late March. And the MACD and RSI provided sell signals across the board for U.S. majors, suggesting more volatility ahead.
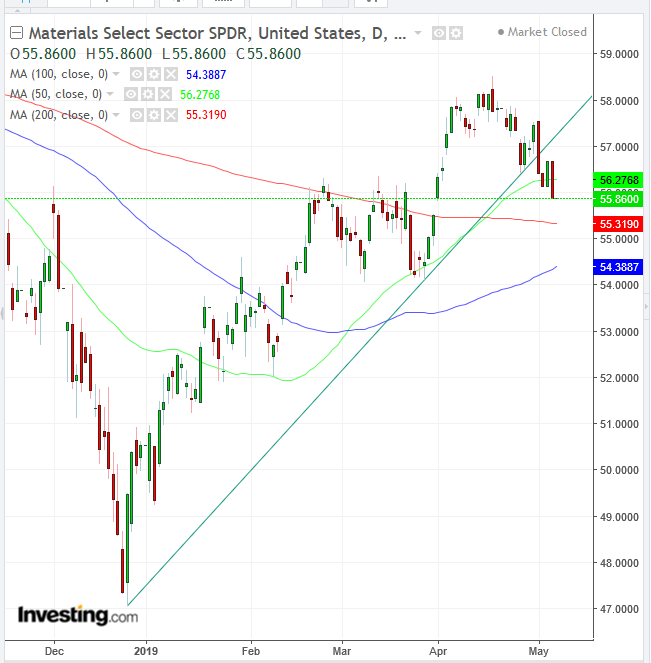
The S&P 500 slid 0.45% lower, coming back from a 1.61% bottom. Except for Health Care (+0.51%) and Energy (+0.09%), all the other nine sectors closed in the red, with Materials (-1.43%), particularly penalized by its exposure to tariffs jitters, extending a drop below its uptrend line since December, including a fall toward the 200 DMA after crossing the 50 DMA, which recently crossed above the 200 DMA triggering a golden cross.
The Dow Jones Industrial Average pared a 1.75% drop to 0.25%, after the price found support above the 50 DMA.
The NASDAQ Composite gave up 0.5%, rebounding from a 2.22% tumble.
As we predicted yesterday, the Russell 2000, whose listed companies, exposed solely to the U.S. domestic market, thrive amid global headwinds, proved a buying opportunity. The small-cap benchmark was the only index to edge higher yesterday, adding 0.14%.
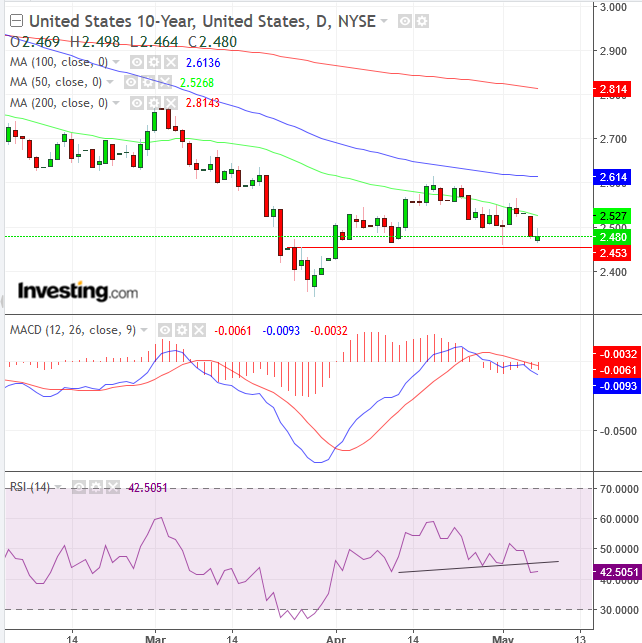
The yield on 10-year Treasurys found some support after closing at the lowest level since late March in yesterday's trading. Technically, the price may be trending within a H&S continuation pattern, already completed by the RSI and a MACD sell signal to boot. Falling yields are bearish for equities, as they suggest that investors are rotating out of stocks and into bonds.
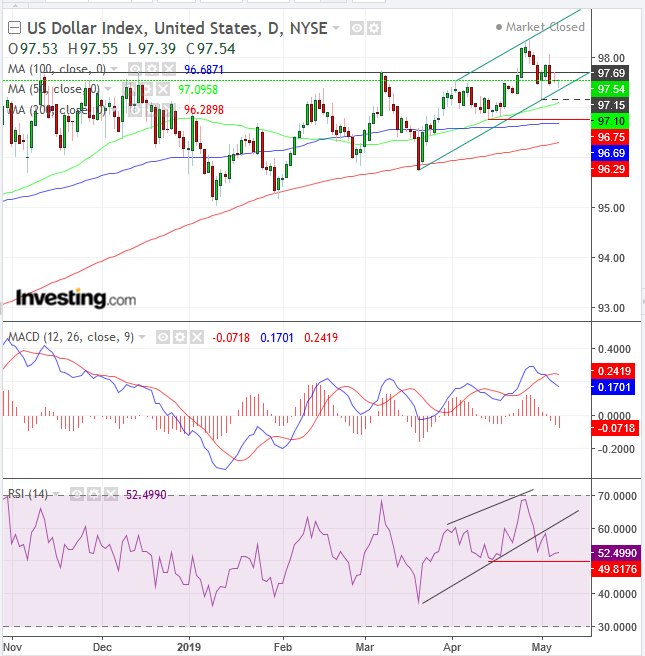
The dollar saw some gains after falling to the bottom of a rising channel since March 20, as it tests an ascending triangle, whose lower boundary is naturally formed by the 200 DMA itself. The RSI, however, may have provided a negative divergence after it dropped below its own momentum-based rising channel, compounded by a MACD sell signal. The April lows—both for the price and the RSI—may be the final test on the integrity of the bullish triangle.
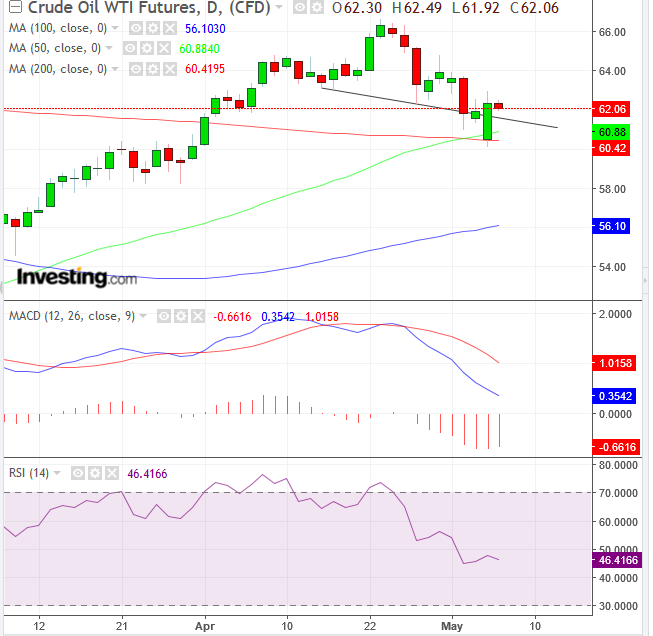
WTI gave up some of yesterday’s gains, against heightened tensions in the Persian Gulf and the Trump administration dispatching an aircraft carrier strike group and bombers to the area, in a warning to Iran. However, the price was still seen above the neckline of a H&S top, after bouncing off the 200 DMA. The MACD and RSI were still providing sell signals, but those take time to recalibrate on the daily chart. A higher price than April 23's $66.66 would make the H&S a failure, turning it into a continuation pattern and catapulting prices further higher.
Up Ahead
- Chinese Vice Premier Liu He is scheduled to return to Washington for trade talks on Wednesday, though the diplomatic trip is now in question.
- The Reserve Bank of Australia meets to set interest rates on Tuesday, while New Zealand's central bank meets on Wednesday.
- China releases trade data on Wednesday, while U.S. figures follow suit on Thursday.
- South Africa holds national elections on Wednesday.
- China reports on inflation on Thursday. The U.S. releases April CPI data on Friday.
Market Moves
- The MSCI All-Country World Index slid less than 0.05%.
- The U.K.’s FTSE 100 fell 0.3%.
- The MSCI Emerging Market Index rose 0.2%.
Currencies
- The Dollar Index is currently flat, rebounding from a 0.15% drop.
- The euro increased 0.1% to $1.1208, the strongest in a week.
- The British pound gained 0.2% to $1.3123.
- The Japanese yen rose less than 0.05% to 110.71 per dollar, the strongest in almost six weeks.
Bonds
- The yield on 10-year Treasurys increased two basis points to 2.49%.
- Germany’s 10-year yield rose one basis point to 0.01%.
- Britain’s 10-year yield fell three basis points to 1.193%.
- Japan’s 10-year yield dropped one basis point to -0.049%.
Commodities
- West Texas Intermediate crude gained 0.1% to $62.29 a barrel.
- Gold advanced less than 0.05% to $1,281.58 an ounce, the highest in a week.
- The Bloomberg Commodity Index slipped 0.1% to the lowest in almost four months.
