- U.S. futures slip as investors turn cautious ahead of Trump-Liu He meeting
- European shares drop on German data fiasco, Deutsche Bank-Commerzbank merger uncertainty
- Treasurys, yen gain on risk-off
- Sterling holds steady as no-deal Brexit is discarded
Key Events
The exuberance seen across global stocks seemed to run out of steam this morning, with futures on the S&P 500, Dow and NASDAQ 100 inching lower in another risk off-again-on-again day. Investors back-pedalled into the security of bonds and the yen, waiting impatiently for any piece of trade news that could give them the reassurance they need to rotate back into equities, while tomorrow’s U.S. employment data—which may shed more light on future interest rates decisions by the Fed—loomed in the background.
The STOXX Europe 600 retreated 0.32% after fresh data showed that Germany's factory orders hit their lowest level in two years in February. The Pan-European benchmark pared about a tenth of the 3% advance it sealed in the previous four-day rally—which had helped it hit an eight-month high on Wednesday.
Miners and banks underperformed, as the market's focus pivoted around Deutsche Bank-Commerzbank merger plans, which face fierce opposition from national unions. Italian lender UniCredit was reported to be preparing a formal bid to acquire Commerzbank (DE:CBKG) in case Deutsche Bank (DE:DBKGn)'s plans failed—pushing shares of the former 3% higher in the early session.
Asian stocks were mixed, as investors awaited some clearer indication from trade negotiations. China’s Shanghai Composite gained 0.94%, while Hong Kong’s Hang Seng slid 0.17%. Japan’s Nikkei 225 edged 0.05% higher, as a surge by Apple (NASDAQ:AAPL) supplier Japan Display (T:6740) (+8.33%) wasn’t enough to pull up the broader market, after the index found resistance the top of a trading range, marked by the 200 DMA. The stock of the Japanese tech company leaped after Reuters reported it will supply organic light-emitting diode, or OLED, screens for the Apple watch.
Global Financial Affairs
Yesterday, U.S. equities advanced for the fifth straight day to a near six-month high after upbeat data from Europe, China and at home infused optimism in global economic growth.
The S&P 500 added 0.21%, for an aggregate five-day 2.52% rally—the longest winning streak in two months. Export-reliant shares in the Materials sector (+1.31%) surged on hopes U.S. and Chinese negotiators were nearing an agreement. The biggest dollar drop in two weeks reduced the price of commodities on the global market, also helping the sub-index. Conversely, Energy stocks (-0.96%) lagged, tracking oil prices lower after a stockpile build.
Initially, equities dropped mid-session after a Bloomberg report that millions of Facebook (NASDAQ:FB) users’ records were exposed on public cloud servers. The news re-ignited privacy worries from last year's Cambridge Analytica scandal, highlighting a lack of progress in stepping up security standards from companies that control sensitive information.
Later, stocks received a boost from reports that China's Vice President Liu He was scheduled to meet U.S. President Donald Trump on Thursday, boosting speculation that both sides are eager to strike a deal by the end of the week. According with sources close to the matter, Beijing would get until 2025 to meet commitments on commodity purchases, while U.S. companies would be allowed to wholly own enterprises in China.
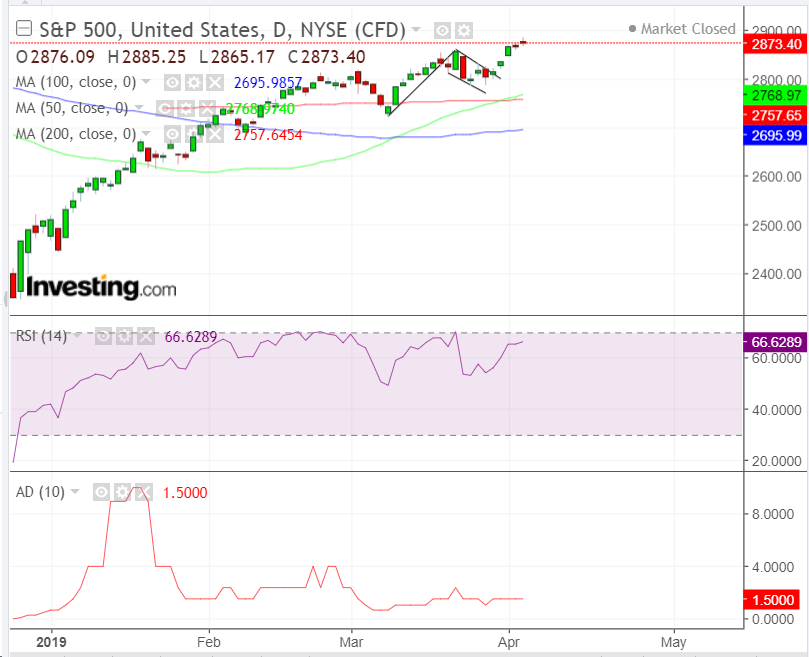
Technically, the SPX price extended an upside breakout out of a falling flag, bullish in an uptrend. The breakout was boosted by a golden cross, which added to our short-term bullish view, for which we provided a buy recommendation. Investors, however, should remain alert, considering the negative divergences on both the RSI—which signals stocks may be losing steam—and the ADL—which shows that market breadth has been shrinking just as the price was rallying.
The Dow Jones Industrial Average climbed 0.15%, following a similar technical pattern. It recently also completed a bullish continuation pattern, a symmetrical triangle amid a golden cross, while the RSI and ADL provided negative divergences.
The NASDAQ Composite edged 0.60% higher, as technology shares return to near-record levels, benefiting from hopes of progress in U.S.-China trade talks, where technology rights play a central role. Technically, the tech-heavy index demonstrated the same supply-demand dynamics as its peers, extending an upside breakout of a falling flag, with the 50 DMA, right on top of the 200 DMA, set for a golden cross amid divergences with the RSI and ADL. If the 50 DMA turns lower, it would signal a potential reversal.
The Russell 2000 gained 0.40%, for the sixth advance in eight sessions, as it broke the topside of a falling channel since Feb. 25, confirmed by an RSI breakout.
Overall, we see more downside risk on the trade front, as the market may have permaturely priced in a deal as a foregone conclusion.
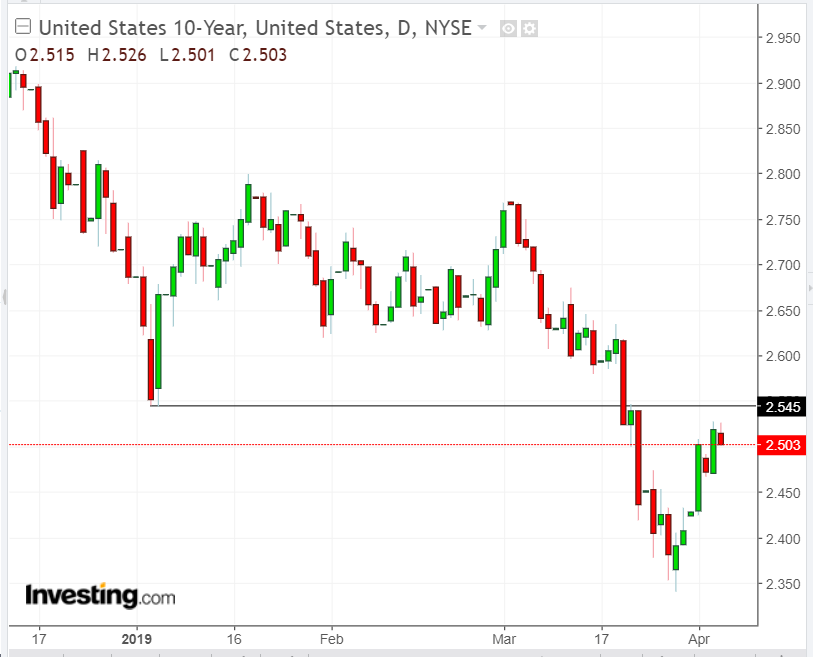
Meanwhile, yields on 10-year Treasurys found resistance by the Jan. 3 lows, as investors rotated out of stocks. Renewed demand for Treasurys boosted the greenback, which pared yesterday’s fall—its worst in two weeks, wiping out more than three days of gains.
The pound kept gains from a three-day rally after the U.K.’s House of Commons passed a bill to block a no-deal Brexit.
The euro remained steady despite the data disappointment coming from Germany—Europe's biggest economy.
WTI slipped lower but held onto gains above $62 on a surprise inventories build. The newly released prospectus for Saudi Aramco, Saudi Arabia's national oil company, helped move oil prices higher earlier in the week, as it prompted speculations that production capacity at one of its main oilfield was abating.
Up Ahead
- The monthly U.S. jobs report on Friday is projected to show nonfarm payrolls were up 175,000 in March. Economists think the jobless rate held at 3.8 % with hourly earnings growing at a strong rate.
Market Moves
Stocks
- Italy’s FTSE MIB slipped 0.4%.
- The MSCI Asia Pacific Index dropped 0.2%.
- The MSCI Emerging Market Index fell 0.2%.
Currencies
- The Dollar Index climbed 0.1%.
- The euro rose less than 0.05% to $1.1235.
- The Japanese yen gained 0.1% to 111.39 per dollar, the biggest climb in more than a week.
- The MSCI Emerging Markets Currency Index slid 0.2%, the largest decrease in more than a week.
- The Indian rupee dropped 0.6%.
Bonds
- The yield on 10-year Treasurys slipped two basis points to 2.50%.
- The yield on 2-year Treasurys fell two basis points to 2.32%.
- Germany’s 10-year yield fell two basis points to -0.01%.
- Britain’s 10-year yield fell two basis points.
Commodities


