- U.S. futures, European shares mixed as global rally slows down
- Upbeat manufacturing PMI feeds U.S. gains
- S&P 500 posts golden cross signal; bank shares rebound as yield curve normalizes
- Bitcoin enjoys sudden surge above $5000
Key Events
Futures on the S&P 500, Dow and NASDAQ 100 slipped off a global rally alongside European stocks this morning, though they later managed to crawl back into green territory, as investors turned cautious after exceptional gains in the start of the week capped the best quarter since 2010 for global stocks.
The STOXX Europe 600 was initially flat, as a decline by carmakers and mining companies offset gains by real estate firms.
Earlier, in the Asian session, regional shares built on a trifecta of manufacturing data beats from the U.S., China and the U.K..
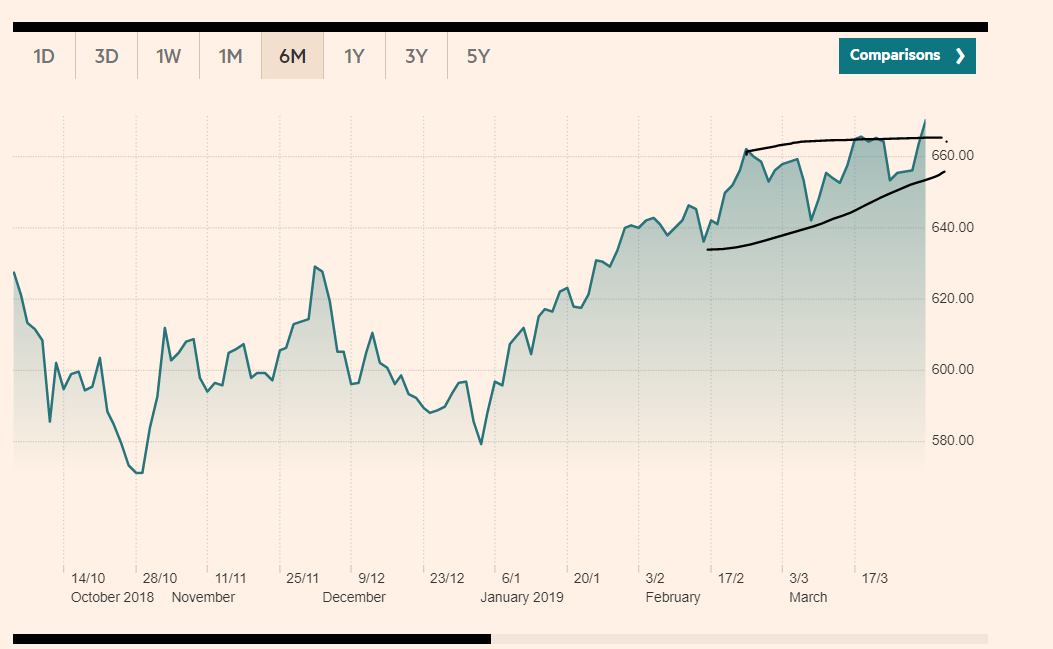
Shares of the MSCI's Asia Pacific index outside Japan climbed 0.68%, building on Monday's advance and reaching a seven-month high, as it completed an ascending triangle, suggesting further rallies.
China's Shanghai Composite and Hong Kong’s Hang Seng also traded higher, gaining 0.20% and 0.21%, respectively.
Australian shares inched 0.41% higher after the Reserve Bank of Australia held interest rates steady, as widely expected.
Japan’s Nikkei bucked the trend, ending flat after paring earlier gains.
Global Financial Affairs
In yesterday’s U.S. session, all four majors climbed by about 1% or more for the fourth straight day, after the Institute for Supply Management manufacturing PMI climbed to 55.3 from 54.2, topping estimates.
In the same day, the U.K. factory index climbed to a 13-month high. Although the data surge was most likely prompted by businesses piling up inventories on signs that E.U. companies may soon be leaving British suppliers, it still managed to temporarily boost the pound, which later resumed its slide—as lawmakers once again failed to agree on any Brexit plan in a fresh round of votes on Monday night.
The S&P 500 advanced 1.16% with eight out of 11 sectors in the green. Financials (+2.45%) were in the lead, rebounding after the 10-year/3-month yield curve untangled its inversion. This is beneficial for banks, which typically profit by taking short-term loans and passing them on to retail customers as long-term loans, collecting a higher interest rate than they pay out. That margin gets chipped away when longer-dated yields fall below shorter-term returns.
Overall, however, bank shares remain the SPX's laggard year-on-year, with returns on the sector ETF at -4.46% for the last twelve months—considerably behind the 8.57% gain of the parent index. While this provides more growth opportunity as the sub-index can play catchup, the question is whether fundamentals have changed. The sector has been shunned by investors because of the growing outlook for an economic slowdown, if not a recession. Only time can tell whether that outlook will revert to optimism—and whether the yield curve manages to retain integrity.
Back to Monday trading, Utilities (-0.69%) led defensive sectors into a decline. At the moment, investors are re-aligning with the normal defensive/cyclical sector breakdown, as they turn unmistakably risk-on. However, it will take some further evidence to gauge for how long they'll be willing to take on risk.
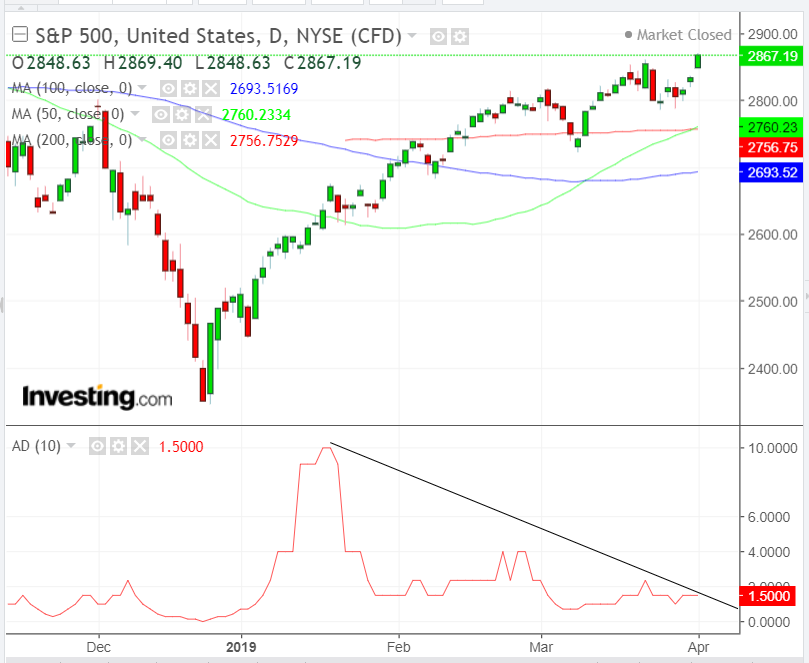
The SPX reached its highest level since Oct. 9, almost 2.2% below its Sept. 20 record close. The 50 DMA crossed above the 200 DMA, triggering a golden cross.
While opinions differ on whether the bullish trigger—the most talked-about technical indicator—means it’s a good time to get in or whether it’s too late, it boosts sentiment that the intermediary-to-long term outlook is turning up, which makes it harder for us to maintain our bearish stance. However, the Advance/Decline line indicator demonstrates a negative divergence, as market breadth failed to post new highs. The ultimate test—and the point where we’ll turn into bulls—would be with a new, meaningful, record close above 2,930.75 and new all-time highs beating 2,940.91, posted on Sept. 21.
Meanwhile, the Dow Jones Industrial Average climbed 1.27% to the highest level since Feb. 15. The NASDAQ Composite advanced 1.29%, outperforming its peers, while the Russell 2000 added 0.90%.
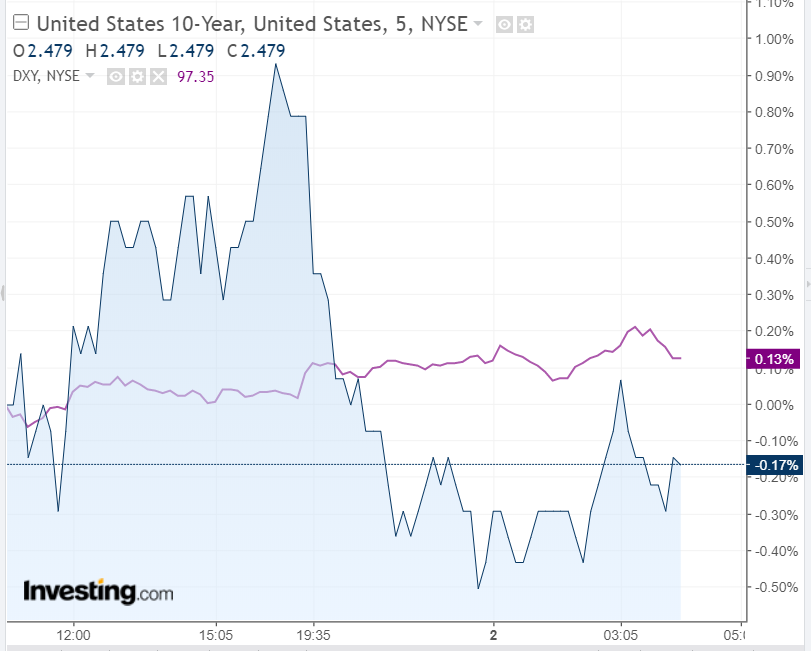
The dollar climbed as yields fell, presumably as foreign investors bought the U.S. currency to ramp up their Treasury holdings.
Bitcoin suddenly jumped as much as 23% to its highest level since November, to settle—as of the time of writing—at $4769.9, or 13% higher, leading many to question whether the great crypto reawakening is finally showing up. The trend is certainly still down.
Up Ahead
- Durable goods orders and core orders are coming out in the U.S. today, with analysts expecting a 1.1% drop and a 0.3% climb respectively.
- Vice Premier Liu He leads China's delegation to Washington on Wednesday, days after U.S. Treasury Secretary Steven Mnuchin and Trade Representative Robert Lighthizer traveled to Beijing.
- The monthly U.S. jobs report on Friday is projected to show nonfarm payrolls were up 175,000 in March. Economists think the jobless rate held at 3.8 % with hourly earnings growing at a strong rate.
Market Moves
Stocks
- The MSCI Asia Pacific Index dropped less than 0.05%.
- The MSCI Emerging Market Index climbed 0.2% to the highest level in about eight months.
Currencies
- The Dollar Spot Index gained 0.2% to the highest in more than three weeks.
- The euro fell 0.1% to $1.1202, reaching the weakest level in almost four weeks on its sixth consecutive decline.
- The Japanese yen slid less than 0.05% to 111.36 per dollar, the weakest in two weeks.
- The British pound slipped 0.4%.
- The MSCI Intl Emerging Market Currency edged 0.1% lower.
Bonds
- The yield on 10-year Treasurys fell two basis points to 2.48%.
- Germany’s 10-year yield dropped less than one basis point to -0.03%.
- Britain’s 10-year yield slid two basis points to 1.029%, the biggest fall in more than a week.
- The spread of Italy’s 10-year bonds over Germany gained two basis points to 2.5515%.
Commodities
- The Bloomberg Commodity Index climbed less than 0.05 % to the highest in a week.
- Brent crude rose 0.3 % to $69.21 a barrel, the highest in 20 weeks.
- LME copper declined 0.2 % to $6,456.00 per metric ton, the biggest drop in more than a week.
- Gold dipped less than 0.05 % to $1,287.10 an ounce, the weakest in almost four weeks.


