- Global investor sentiment wavers, pushing US futures lower amid trade war uncertainty
- Dollar keeps strengthening, hurting EM assets
- NASDAQ Composite, Russell 2000 hit new highs, US futures slide
-
US tech stocks shine: Facebook hits highest price to date, Microsoft completes bullish pattern, Alphabet nears all-time high
-
Sterling comes under pressure, extends downtrend ahead of BoE rate decision
-
WTI steadies above $65 ahead of crucial OPEC meeting
-
New Zealand dollar slides to 6-month low, bolstering case for RBNZ to leave rates unchanged
Key Events
US futures for the S&P 500, Dow and NASDAQ 100 rallied alongside European equities early on Thursday, but then quickly reversed their course. The downward move spoiled investor hopes to see the solid gains posted by US and Canadian stocks on Wednesday, when small cap and technology shares touched new highs, continue into today's session.
Gains in Europe followed heavy losses during the Asian session, as investors seesawed between risk-on and risk-off, unable to fully shrug off trade war worries. Today, markets might also shift focus towards the Bank of England rate decision, as well as the OPEC meeting which kicks off in Vienna.
The dollar kept rising to almost a one-year high, driving liquidity out of emerging markets such as Malaysia, the Philippines and Thailand, which all slipped at least one percentage point lower. The Indonesian rupiah also tumbled more than 1 percent, driving broader losses across EM currencies.
Japan’s TOPIX gave up an early 0.3 percent gain, which turned into a 0.15 percent slide.
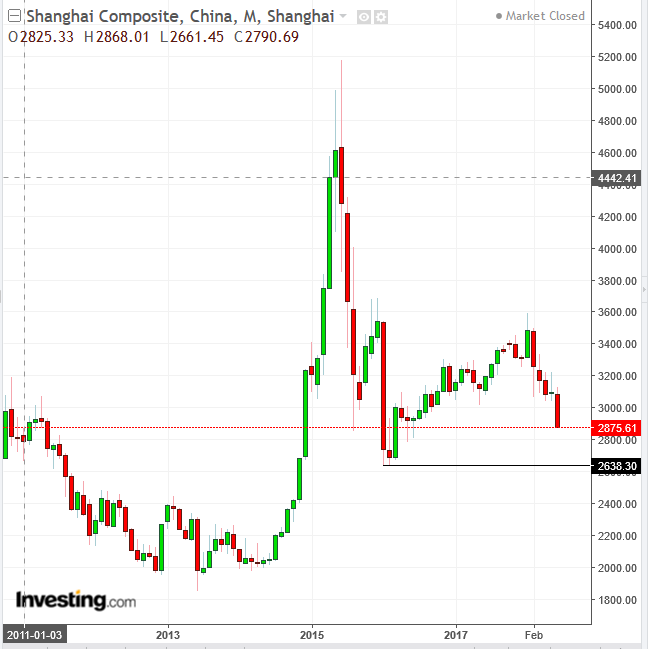
China’s Shanghai Composite slipped to its lowest level since June 27 2016, after it gave up gains of almost 1.0 percent to settle 1.3 percent in the red. The mainland index closed 8 percent above the February 2016 low: any further fall would push it to reach the lowest since November 2014.
Hong Kong’s Hang Seng tried to climb 0.5 percent higher but then started slumping, to finish the day 1.34 percent in negative territory—the lowest price since December. Like every other major regional index excluding Australia's S&P/ASX 200, the HK benchmark has completed a bearish pattern, with Morgan Stanley analysts forecasting a bear market for the benchmark.
South Korea’s KOSPI plunged 1.1 percent, giving up initial 0.3 percent gains. After it tested the neckline of a massive top reversal since early August 2017, the price closed at the very lowest point of the session, where it met a complete shortage of buyers. The ongoing US-China trade risk overshadowed any potential positive influence from calmer diplomatic relations with the country's northern neighbor.
Down under, the S&P/ASX 200 continues to defy the region's downward trend, jumping an additional full percentage point today. Financialsr, which recently bounced back form the aftermath of a consumer-related misconduct scandal, helped the Aussie benchmark seal its second consecutive rally, for a total of four out of five winning sessions, surging an aggregate 3.6 percent.
Overall, UBS analysts estimate that Asian equities are pricing in a 20 percent chance of a fully-fledged trade war—which means that they may suffer further losses of up to four times the ones we have seen so far, should such trade war threat materialize.
On the upside, regional shares could enjoy a 20 percent surge should US President Donald Trump's hefty tariffs prove nothing more than a negotiation ploy.
Global Financial Affairs
During yesterday's US session, a tech sector rally and a rise in oil prices drove equities higher, easing investor worries over a global trade war.
Treasury yields climbed accordingly, as investors dumped bonds in favor of stocks. The S&P 500 gained 0.17 percent, with Communications Systems (NASDAQ:JCS) led the climb (+1.24 percent). Shares in the Materials sector—the most exposed to tariff uncertainty—lagged (-0.32 percent), underscoring some lingering investor caution over trade headwinds.
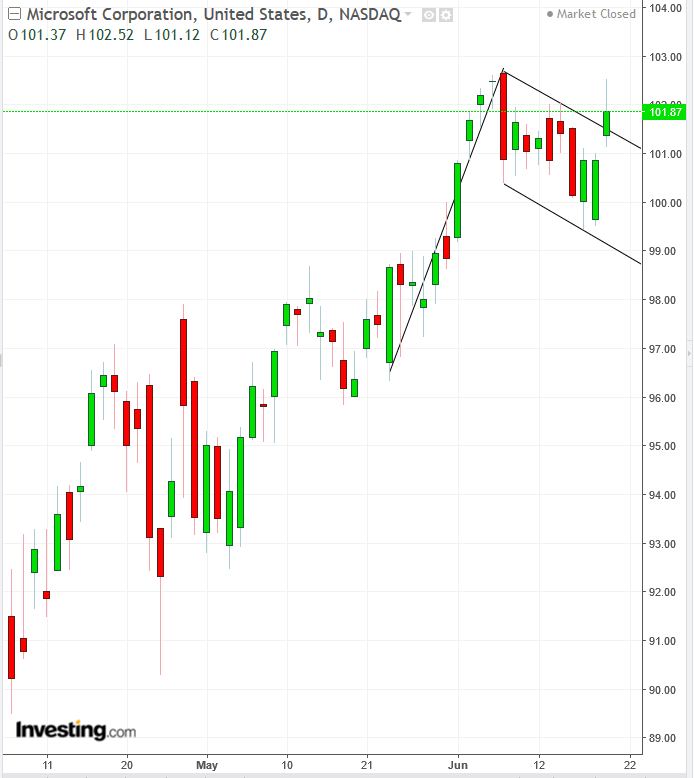
The NASDAQ Composite rallied 0.7 percent and hit a fresh record, on both a closing and new high basis. Leading the tech rally: Facebook (NASDAQ:FB), which also posted a record high and close; Alphabet (NASDAQ:GOOG) came in within 60 cents of its January 29 record high and Microsoft (NASDAQ:MSFT) completed a bullish Falling Flag.
Facebook jumped 2.3 percent. Shares crossed the $200 mark for the first time, closing at $202. The stock benefited from the news that its Instagram platform hit 1 billion users. FB CEO Mark Zuckerberg is now just a mere $29 million away from Warren Buffet’s net worth.
But it was the Russell 2000 to steal the limelight, gaining a further 0.8 percent to seal another record in a string of winning sessions since mid-May. The small-cap index strength shows that the global trade war narrative is penalizing large-cap stocks.
Only the export-reliant shares in the Dow retreated, by 0.17 percent. It’s almost as if the same investors who sold the Dow bought the SPX. However, the Dow managed to remain well above a dual support by Wednesday’s hammer and an uptrend line since the April low.
Canada’s S&P/TSX Composite gapped higher, closing up 0.65 percent. It posted a fresh record, led by cannabis stocks, after the country's Senate put the final stamp on its legalization.
The USD gained 0.15 percent, for an aggregate four-day rally of 0.50 percent. The surge in Treasury yields helped the greenback gain against almost every major FX peer on Wednesday, even as US notes steadied and European bonds drifted. The dollar reached the highest level since July 13 yesterday, trimming a 12 percent plunge to roughly 5 percent the 12 percent in place since Trump told the Wall St. Journal that too strong dollar “is killing us.”
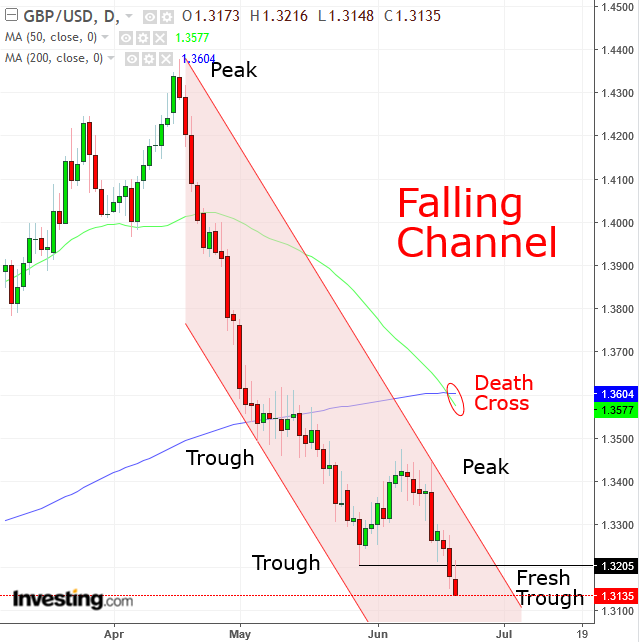
The pound weakened ahead of today's Bank of England's rate decision. Technically, the slide extends a trough that's lower than the 1.3205, May 29 low, confirming a falling channel since mid-April, after the cable executed a Death Cross, when the 50 DMA (green) crosses below the 200 DMA (red), a major sell signal for trading systems that follow statistical price comparisons.
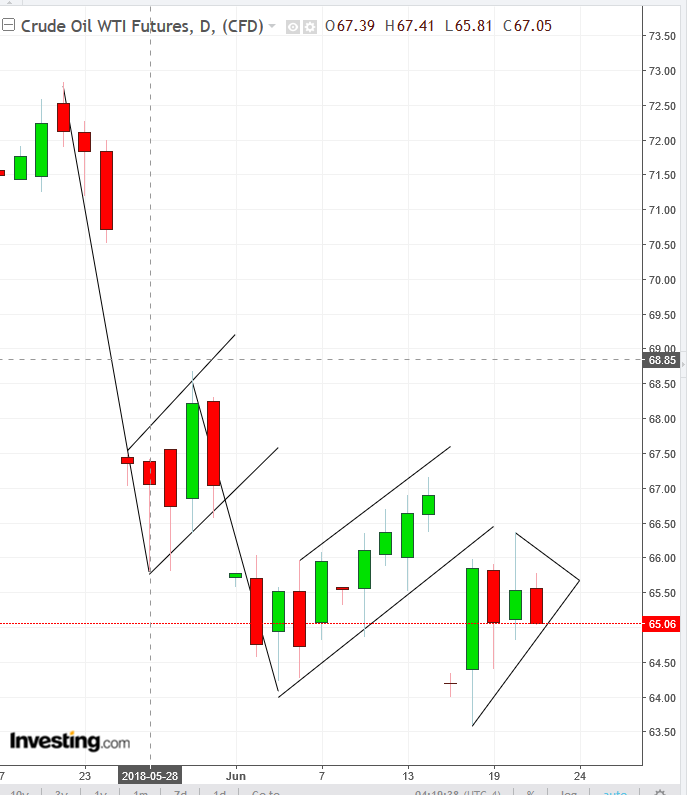
West Texas oil slipped to $65.05 a barrel, ahead of tomorrow's crucial OPEC meeting which will decide on output. Technically, the fifth day consolidation forms a pennant, making it the third consecutive continuation pattern, something we have seen perhaps for the first time.
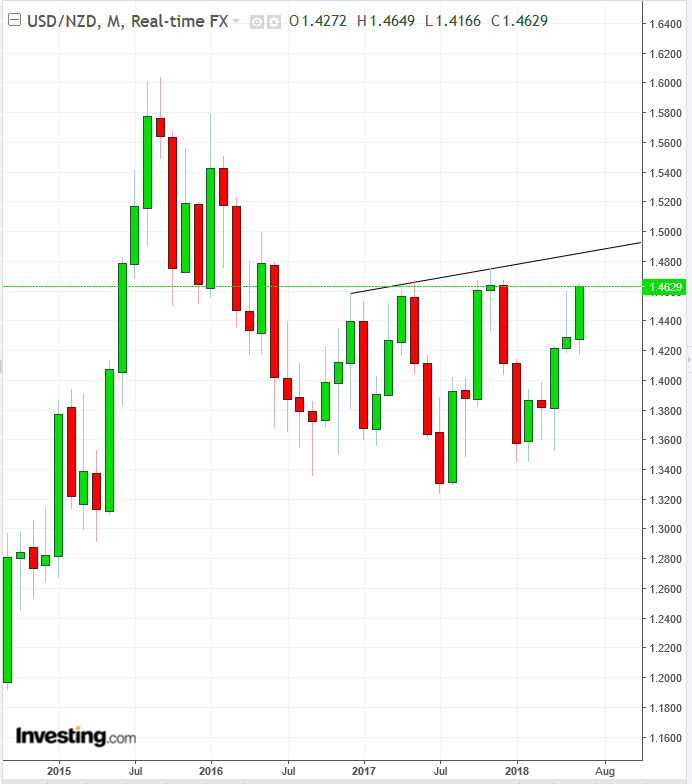
New Zealand’s dollar fell to its weakest point in six months after data showed first-quarter growth slowed, bolstering the case for the central bank to keep rates at a historic low. On the other hand, further weakening could push the USDNZD pair to complete a massive bottom since September 2016. Would the central bank want the pair to weaken another 10 percent, roughly the target of the pattern?
Up Ahead
-
The Bank of England’s policy decision is due on Thursday.
-
Also, on Thursday: US jobless claims.
-
The Organization of Petroleum Exporting Countries meets in Vienna on Friday.
Market Moves
Stocks
-
The STOXX Europe 600 edged 0.3 percent higher, the largest gain in a week.
-
Futures on the S&P 500 gained 0.2 percent.
-
The UK’s FTSE 100 advanced 0.4 percent to the highest level in a week on the largest gain in a week.
-
Germany’s DAX gained less than 0.05 percent.
-
The MSCI Emerging Market Index slipped 0.8 percent to the lowest level in almost nine months.
-
The MSCI Asia Pacific Index slid 0.6 percent to the lowest level level in more than six months.
Currencies
-
The Dollar Index advanced 0.3 percent to the highest level in about a year.
-
The euro dropped 0.3 percent to $1.154, the weakest level in 11 months.
-
The British pound fell 0.3 percent to $1.3128, the weakest level in about seven months.
-
The Japanese yen slid 0.3 percent to 110.64 per dollar.
-
The Turkish lira slipped 0.7 percent to 4.7639 per dollar, the weakest level on record.
Bonds
-
The yield on 10-year Treasuries lost one basis point to 2.93 percent.
-
Germany’s 10-year yield climbed less than one basis point to 0.38 percent, the largest increase in more than a week.
-
Britain’s 10-year yield gained less than one basis point to 1.297 percent.
-
Italy’s 10-year yield dropped less than one basis point to 2.55 percent.
Commodities
-
West Texas Intermediate crude declined 0.6 percent to $65.32 a barrel.
-
Gold dipped 0.4 percent to $1,262.83 an ounce, hitting the weakest in six months with its fifth consecutive decline.
-
Brent crude fell 0.9 percent to $74.10 a barrel.
