-
US equities rebound on energy sector gains
-
Middle East diplomatic tensions, Venezuela supply dip push oil higher
-
Three headwinds still loom for stocks
-
The Fed decision and Jerome Powell’s news conference will take place later today.
-
The Bank of England is expected to keep interest rates on hold and its asset-purchase program unchanged on Thursday. Attention will focus on language and the odds for a May hike.
-
New Zealand has a monetary policy decision due out on Thursday.
-
Nike (NYSE:NKE) is scheduled to release results on Thursday, with a$0.52 EPS consensus vs $0.68 YoY.
- Dropbox"s (NASDAQ:DBX) much-anticipated IPO is scheduled for this Friday.
-
The STOXX Europe 600 Index was little changed.
-
The MSCI All-Country World Index advanced less than 0.05 percent.
-
Futures on the S&P 500 gained less than 0.05 percent.
-
The UK’s FTSE 100 fell less than 0.05 percent.
-
The Dollar Index dipped 0.23 percent.
-
The euro jumped 0.3 percent to $1.2279.
-
The Japanese yen climbed 0.2 percent to 106.31 per dollar.
-
South Africa’s rand gained 0.1 percent to 11.9528 per dollar.
-
The British pound advanced 0.2 percent to $1.4024, the strongest in more than a month.
-
The yield on 10-year Treasuries decreased one basis point to 2.88 percent, the first retreat in a week.
-
Germany’s 10-year yield fell less than one basis point to 0.58 percent.
-
Britain’s 10-year yield declined less than one basis point to 1.482 percent.
-
WTI crude advanced 0.2 percent to $63.66 a barrel, the highest level in more than three weeks.
-
Gold increased 0.4 percent to $1,316.95 an ounce, the highest level in a week on the biggest climb in more than two weeks.
-
LME copper fell 0.3 percent to $6,732.50 per metric ton, hitting the lowest level in 14 weeks with its fifth consecutive decline.
Key Events
US equities gained on Tuesday, shrugging off heightened technology sector risk, mounting trade war fears and interest rate headwinds. Gains in energy shares, boosted by oil surging to nearly $64 on Middle East tensions helped trim losses from Monday's tech selloff.
The S&P 500 advanced 0.15 percent, after losing 1.42 percent on Monday. The price is still 3 percent lower than its March 13 peak, but the index is up 1.47 YTD. Internally, sectors were split between negative and positive territory.
Energy led the pack, posting a 0.85 percent increase, although the sector is down 8.29 percent YTD. Consumer Discretionary stocks followed, up 0.6 percent on the day, 5.88 percent for the year. The laggards were Utilities, -0.46 percent yesterday but +5.64 percent YTD, and Consumer Staples, down 0.28 yesterday but up 7.58 percent for the year. The two leaders are growth sectors, the two biggest laggards are defensive.
The Dow Jones Industrial Average outperformed among US majors, jumping 0.47 percent. However, the mega cap index is still more than 4 percent below its February 27 high, before trade war jitters hit markets. For the same period, the S&P 500 is only 2.6 percent lower. The Dow is also the only major index that has failed to post a peak higher than its February 27 high. This makes sense since the global exposure of its larger-cap stocks would be hardest hit by a trade war.

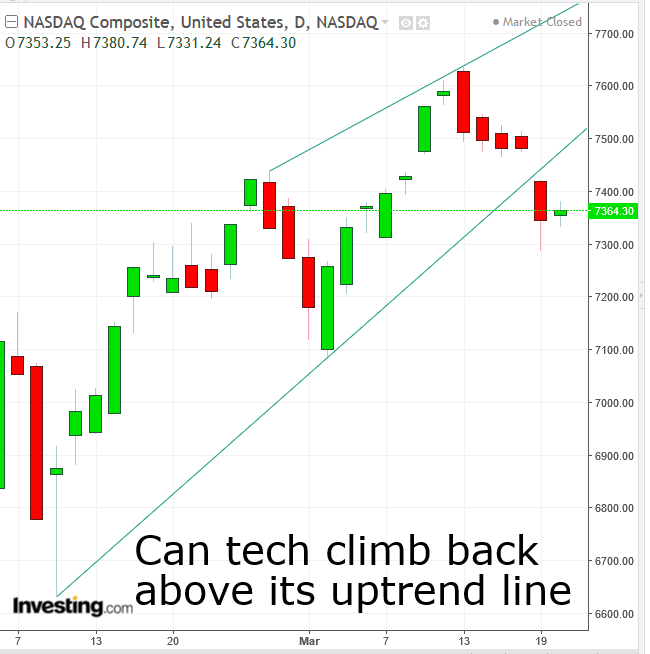
The NASDAQ Composite climbed 0.29 percent after losing 1.84 percent on Monday, while the Russell 2000 underperformed its peers to close in the red. The small-cap stock benchmark slid 21 points, after losing 0.99 percent in value on Monday.
Global Financial Affairs
In early morning trading, European stocks held on to yesterday’s advances, following a mixed Asian session. Media and energy shares pushed the STOXX Europe 600 higher.
S&P 500 Futures are holding steady around neutral levels, as investors take a wait-and-see approach ahead of today's FOMC meeting, day one of two. New Fed Chair Jerome Powell's inaugural public speech recently boosted expectations of a faster pace of interest rates hikes. But markets remain uncertain as they anticipate forward guidance.
When it comes to unexpected events, equity investors have proven relatively hardy over past few years, ever since the Brexit vote in mid-2016. Yesterday's pushback to Monday's selloff—which had been prompted by three key catalysts—is further evidence of that.
Working backward, investors are facing three main headwinds:
1. The revelation of an extensive data breach at Facebook (NASDAQ:FB), which enabled data mining company Cambridge Analytica to harvest information from 50 million FB users in order to sway consumer and voter behavior. The news, alongside fresh reports that Cambridge Analytica executives boasted about influencing US elections in favor of Donald Trump, exposed the ugly face of the two companies—an episode highly reminiscent of a 2010 dialogue in which FB's co-founder Mark Zuckerberg ridiculed the gullibility of the social media platform's first users in submitting their personal data to his company.
UK and Irish regulators are preparing for a formal investigation. This could, in the longer-term, heighten scrutiny over additional internet and media groups, such as Google (NASDAQ:GOOGL) and Amazon (NASDAQ:AMZN), whose outsize earnings growth is linked to their data usage practices.
2. The prospect of a looming trade war, which is seen as the single most dangerous threat to the growth and stability of both the US and global economies, both of which have only recently begun to get back on track.
3. A faster pace to monetary policy tightening, which could push institutional investors to liquidate large positions and re-strategize their investment plans.
The US dollar took a hit against most of its major peers, which, coming before the Fed's meeting, suggests USD traders do not actually expect a faster pace of tightening. This would underscore a discrepancy in interest rate outlook between dollar and equity investors, as these two groups, as we pointed out throughout last year, have been maintaining divergent views since the Brexit vote.

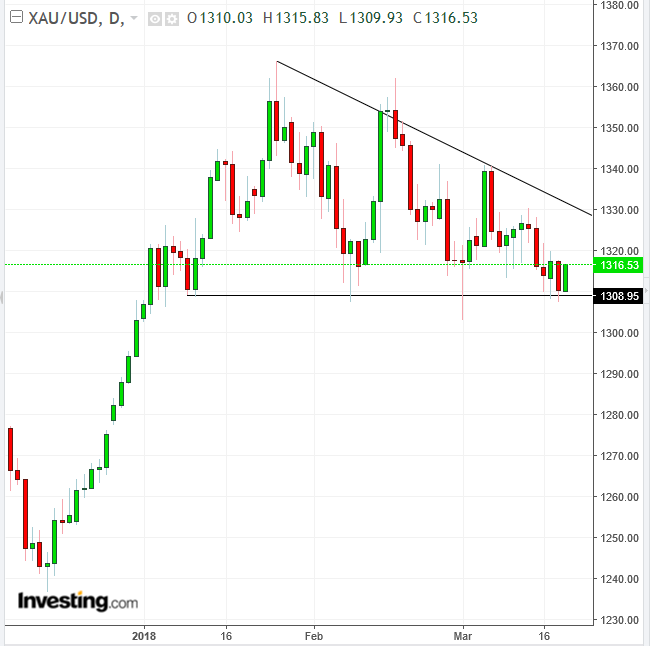
The dollar decline boosted gold. Technically, the price of the yellow metal is trading within a Descending Channel, presumed to break to the downside, providing an implied $1,260 target.

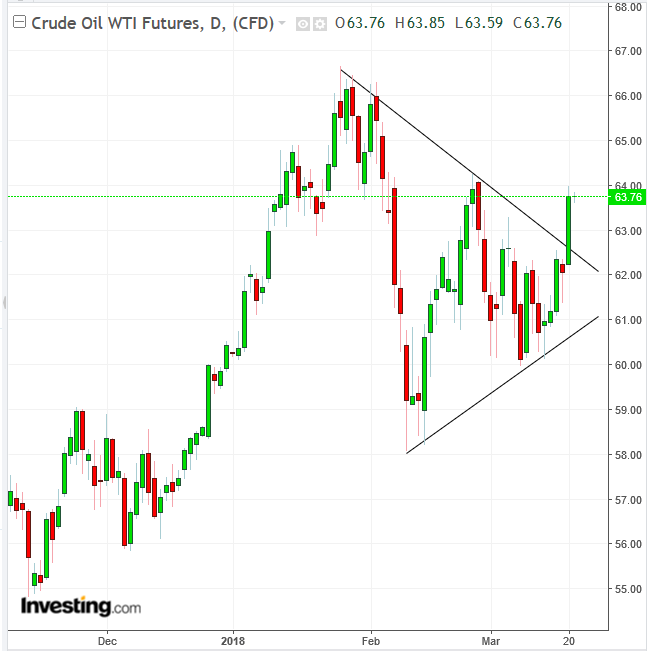
Oil moved past its three-week high on renewed tensions between Saudi Arabia and Iran. Expectations that Venezuelan output would continue to slide, after last week's IEA data showed that February’s production fell by half a million barrels, also helped buoy oil prices. Technically, the price provided an upside breakout to a Symmetrical Triangle, with an implied $70 target.

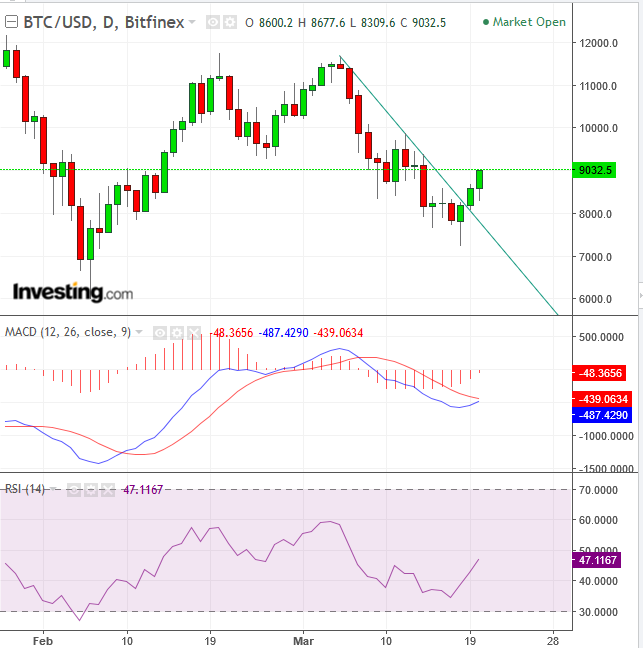
Despite child abuse imagery found within Bitcoin’s blockchain, the price of the cryptocurrency crossed above $9,000, trading at the top of this session and reaching the neckline of a double top. Is this part of a return move, before it resumes falling, or part of a reversal?
Up Ahead
Market Moves
Stocks
Currencies
Bonds
Commodities
