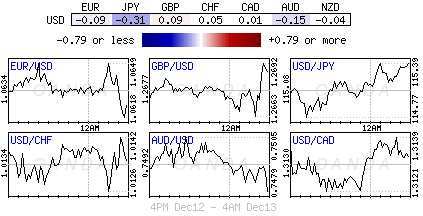
The Fed’s highly anticipated two-day meeting begins later today when U.S policy will decide whether to raise interest rates for the first time in 12-months.
The latest results from the CME’s FedWatch tool indicate the likelihood of a rate increase is currently +95.4%, up from yesterday’s +94.9% odds or other wise considered fully priced in.
With the market pricing in a token +25bps hike and a two-in-three chance of additional tightening stateside by next June, expect investors to be focusing on the Fed’s outlook to drive trading across the various asset classes.
It’s no surprise to see the markets confined to relatively tight trading ranges with minimal reaction to overnight data from China and down-under. Investors prefer to access tomorrow’s accompanying Fed statement before fully committing to any directional play.
1. Equity Indexes push on and up
Global stocks pushed higher and bond yields stabilized overnight ahead of the Fed’s two-day policy meeting.
In Asia, Japan’s Nikkei Stock Average closed up +0.5%, pushed higher on the back of a weaker yen (¥115.37). The Aussie’s S&P/ASX 200 ended -0.3% lower, while Korea’s KOSPI added +0.4% and Hong Kong’s Hang Seng Index closed up +0.1%.
In China, Shanghai Composite Index rebounded from earlier losses to trade up +0.1%, after dropping -2.5% in the previous session on the back of stronger data – Industrial Production and retail sales (see below).
In Europe, equity indices are trading higher with banking stocks leading the gains on the STOXX 600. Commodity stocks are trading mixed in early trade on the FTSE 100.
Futures are pointing to a +0.3% opening gain for the S&P 500, after a pullback in shares of financial companies pressured major indexes yesterday.
Indices: Stoxx50 +0.9% at 3,227, FTSE +0.2% at 6,906, DAX +0.7% at 11,269, CAC 40 +0.7% at 4,793, IBEX 35 +1.0% at 9,274, FTSE MIB +1.5% at 18,652, SMI +0.8% at 8,104, S&P 500 Futures +0.3%
2. Oil prices little changed; expect some moves on profit taking
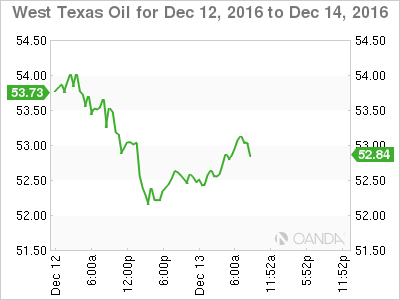
Crude Oil prices have been stable overnight, supported by strong demand in Asia and by a supply cut by Abu Dhabi as part of production curbs organized by non-OPEC members.
Further upside movement will be pressured by speculative sellers and by a number of investors looking to closeout a percentage of their positions on profit taking.
Both Brent and light crude futures are flirting with negative territory ahead of the open stateside. Brent is up +6c at +$55.95, while WTI is up +12c at +$52.95.
With the market putting so much emphasis on OPEC and non-member cut in production deal, market prices are expected to turn negative very quickly if investors feel that market compliance would not happen.
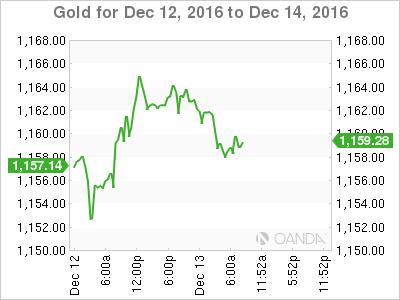
Spot gold prices remain steady at +$1,161.75 an ounce, after gaining +0.4% in yesterday’s session. At one point yesterday, the yellow metal printed a new ten-month intraday low (+$1,151.34) when U.S yields traded at their highs.
3. Fixed income yields contained
Yesterday’s $24B sale of U.S 3’s drew tepid demand, the latest sign of diminishing appetites amid the swing to higher yields.
The notes were sold at +1.452%, higher than +1.448% right before the sale, which suggest that investor demand was softer than dealers had anticipated.
The bid to cover was +2.65%, down from the average of +2.81%. Indirect bidding (a proxy of foreign demand) was +42.6%, the same as last months – the lowest since February.
Today’s +$12B sale of U.S. 30-Year bonds (1:00pm EST) will be the next test. Demand for this debt has been very volatile. Shedding ‘duration’ has been the key trade after Trumps win so a negative for the auction.
Note: Higher yields are an advantage for pension funds and insurance firms who need high-grade long-term fixed income assets to match long-term obligations.
Elsewhere, Aussie notes led gains in APAC with yields falling -3bps to +2.82%. In Japan, JGB’s yielded +0.075% while U.S. 10's were at +2.47%.
4. Dollar in demand, but investors wait for FOMC
Its no surprise to see investors willing to book some profit ahead of the Fed’s highly anticipated rate announcement tomorrow.
Despite the yen having briefly strengthened outright (¥115.46) on the back of investors taking profits in the Asian session, the dollar is expected to remain in demand on pullbacks, supported by higher oil prices and positive risk sentiment amongst investors. With the “net” yen position having only started to turn short, would suggest that this rally has more legs.
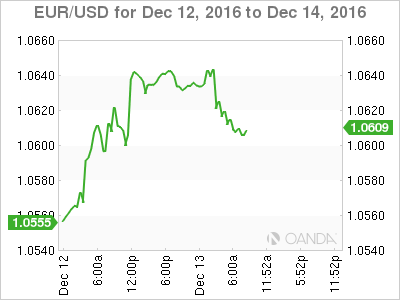
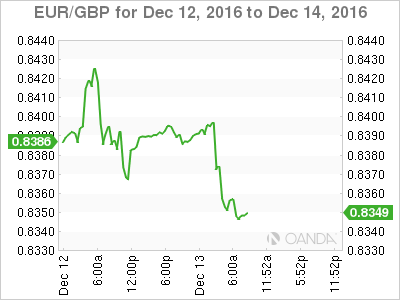
The EUR continues to consolidate atop of the psychological €1.0613 and going nowhere too fast. While the pound (£1.2715) has received an early morning bid from U.K data showing that annual inflation beat consensus in Oct (+1.2% vs. +0.9%). Sterling gains are expected to be limited, as it had already risen in advance of the release in anticipation of data showing accelerating inflation.
5. China’s data paints mixed picture
Data from China’s NBS (National Bureau of Statistics) showed that industrial production (IP) accelerated +6.2% in Nov y/y, up from a +6.1% increase in Oct. Chinese retail sales also grew, up +10.8% in Nov y/y, accelerating from a +10.0% increase in Oct.
Both readings were higher than the street was expecting, and further proof that the world’s second largest economy continues to strengthen. Perhaps authorities will consider switching their focus from fiscal stimulus to tightening regulation to warn off an asset bubble burst?
Other data showed that China housing-sales growth hit the brakes last month, slowing sharply from Oct. Housing sales by value rallied +16.2% m/m, slowing from a +38.3% increase in October. The deceleration came in the wake of a slew of stricter property-buying controls in October to prevent a bubble from bursting.
