Wednesday August 15: Five things the markets are talking about
Global equities traded mixed overnight as market risk appetite continues to be tested by Turkey’s induced turmoil. U.S Treasuries prices have climbed a tad, while the greenback trades atop its 15-month highs against G20 currency pairs, again putting commodity prices under pressure.
In Turkey, President Erdogan implemented an additional tax on a range of U.S imports (autos, tobacco and alcohol), signalling its squabble with the U.S. will continue. The lira (-6.1% at $6.1148) has, for the time being stabilized, gaining outright, along with other EM pairs.
The market is still trying to gage the possibility of contagion to other emerging markets and to Europe. For now, it’s contained, however, if the crisis drags on or deepens, it has the potential to affect the E.U economy and ECB’s policy.
Will Turkey disappoint?
The Turkish finance minister has a planned conference call tomorrow where he is expected to reassure investors concerned by Erdogan’s influence over the economy and his resistance to interest rate hikes to tackle double-digit inflation.
On tap: U.S retail sales data appears this morning (08:30 am EDT), followed by housing data on Thursday. In Brussels Thursday, Brexit talks between the E.U and the U.K resume.
1. Stocks mixed results
In Japan, the Nikkei dropped overnight, mostly on profit taking after Tuesday’s sharp gains, though the drop was limited as the yen’s (¥111.28) weakness supported investor sentiment. Losses were concentrated in the gaming sector due to concerns over delays in new game releases in China. The Nikkei share average ended -0.7% lower, while the broader Topix declined -0.8%.
Down-under, Aussie shares rallied to a new decade high on strong earnings. The S&P/ASX 200 index firmed +0.5% at the close of trade. The benchmark rose +0.8% on Tuesday. In S. Korea, the KOSPI was closed for a holiday.
In Hong Kong, stocks fell overnight; ending atop of their 12-month lows on bearish Chinese investor sentiment and broader concerns about emerging markets. At close of trade, the Hang Seng index was down -1.55%, while the Hang Seng China Enterprises index fell -1.95%.
In China, it was a similar story with stocks extending their losses overnight to a third consecutive day of declines as worries over the country’s cooling economy and the Yuan’s (¥6.8856) descent to a 15-month low knocked investor confidence. The blue-chip CSI300 index fell -2.4%, while the Shanghai Composite Index closed down -2.1%.
In Europe, regional bourses are trading somewhat muted with bank holidays in several European countries – Italy, Austria, Greece, Cyprus and Slovenia.
U.S stocks are set to open small down (-0.1%).
Indices: Stoxx50 +0.1% at 3,413, FTSE -0.1% at 7,604, DAX +0.2% at 12,386, CAC 40 flat at 5,405; IBEX 35 -0.3% at 9,481, FTSE MIB -0.3% at 20,906, SMI -0.4% at 9,004, S&P 500 Futures -0.1%
2. Oil falls on U.S stocks rise, weaker economic outlook, and gold lower
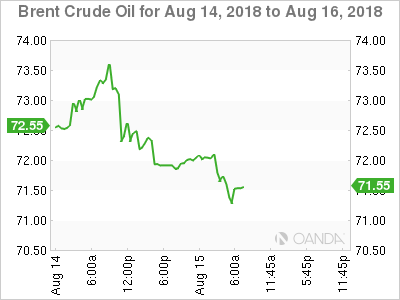
Oil prices trade under pressure, weighed down by a soft global economic outlook and a report of rising U.S crude stocks, despite U.S sanctions on Tehran threatening to curb Iranian crude oil supplies.
Brent crude oil is down -50c a barrel at +$71.96, while U.S light crude (WTI) is -55c lower at +$66.49.
According to U.S API data yesterday, U.S crude stocks rose by +3.7M barrels in the week to Aug. 10, to +410.8M barrels – crude stocks at the Cushing, Oklahoma delivery hub rose by +1.6M barrels.
Expect dealers to take their cue from today’s official U.S oil inventory data from the EIA (10:30 am EDT).
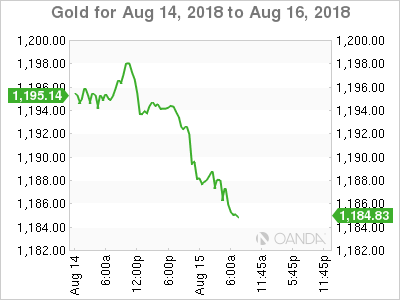
Ahead of the U.S open, gold prices have fallen to an 18-month low overnight as the ‘big’ dollar hit a 15-month high on risk aversion demand emerging from concerns about Turkey’s financial turmoil. Spot gold is down -0.45% at +$1,189 an ounce, while U.S gold futures are down -0.47% at +$1,195 an ounce.
3. Bank Indonesia continues to prioritize stability
Bank Indonesia surprised the market this morning by hiking its benchmark interest rate a fourth time in three-months, moving quickly to contain the EM volatility and curb a slide in its currency. The seven-day reverse repurchase rate was raised by +25 bps to +5.5%.
Note: Bank Indonesia has been among the most aggressive in Asia in tightening policy this year, raising rates by a total of +125 bps since May.
Policy makers ‘hawkish’ rhetoric suggests that they will continue to prioritize price stability and is willing to do more if required. For now, the aggressive hikes are helping to stabilize the rupiah (IDR), which is one of Asia’s worst performers this year, down about -7% outright.
Note: The rupiah hit a low overnight of $14,646, the weakest level since October 2015.
4. Dollar still moving markets
Currency markets continue to be driven by the strong dollar and U.S trade policy.
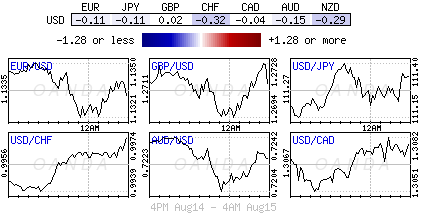
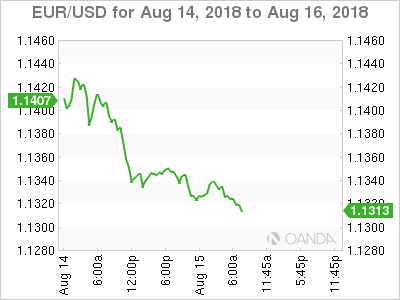
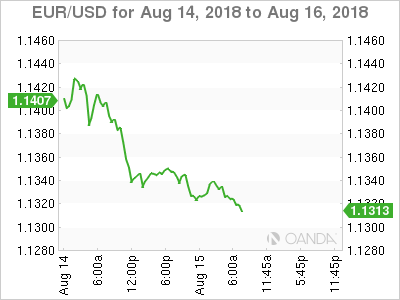
EUR/USD is flat at €1.1345, having reached yesterday a more-than-one-year low of €1.1317. If Turkey is adding to the ‘single units’ under-performance, be prepared for event risk over the next 24-hours – whether the U.S pastor is released and whether Turkish authorities will offer anything new in their investor call tomorrow? Italian budget situation is also simmering in the background with yesterday’s bridge collapse in Italy having government officials calling for more infrastructure spending.
USD/TRY ($6.1882) briefly tested below the $6.00 level after hitting a record high of $7.22 Monday. A second session of gains would suggest hat the market is pricing the risk of the Turkish crisis spreading to other emerging markets as being limited.
GBP/USD (£1.2719) tested below £1.27 for its lowest level in 13-months. Today’s U.K CPI reading (see below) has done little to change the outlook of the path for BoE rate hikes.
Hong Kong intervened to defend its peg to the dollar (HK$7.8498) for the first-time in three-months after the local currency fell to the weak end of its trading band.
5. U.K inflation accelerated in July
U.K data this morning showed that annual inflation accelerated in July, which suggests that domestic inflationary pressures persist despite disappointing wage growth.
The ONS reported consumer prices rising +2.5% on the year in July, up from a +2.4% annual gain in June.
Digging deeper, the pickup in inflation was driven by price increases for gas, food and video games.
Other data showed U.K wholesale prices in July also showed inflationary pressures. Prices charged by companies at the factory gate rose +3.1% y/y, while the cost of firms’ raw materials surged +10.9%, the fastest rate of input-price inflation in more than 12-months.
Note: Earlier this month, the Bank of England (BoE) hiked overnight interest rates to +0.75% and also telegraphed two or three more increases in the coming years.
