
Most major EU and US indices traded in the green, driven by energy stocks, but today in Asia, the picture was more mixed. The outlier was Japan’s Nikkei, which rallied nearly 2%, perhaps after PM Suga said he would step down. As for today, all lights are likely to fall on the US employment report for August, as investors try to paint a clearer picture over the Fed’s future course of action.
Nikkei Rallies As Suga Resigns, NFPs Take Center Stage
The US dollar traded lower against all but one of the other major currencies on Thursday and during the Asian session Friday. It lost the most ground versus NZD, CAD, and AUD in that order, while it lost the least ground versus CHF. The currency against which the greenback did not underperform was JPY.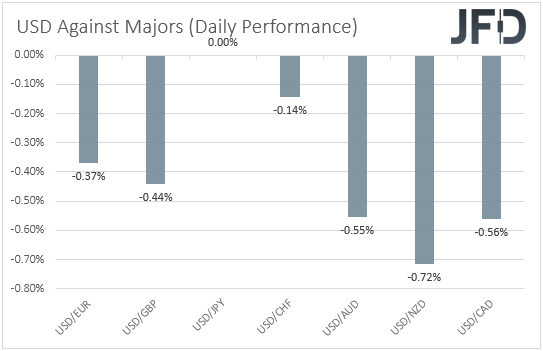
The weakening of the US dollar and the Japanese yen, combined with the strengthening of the risk-linked Kiwi, Loonie, and Aussie, suggests that financial markets continued trading in a risk-on fashion yesterday and today in Asia. Indeed, looking at the performance in the equity world, we see that all-but-one of the major EU and US indices closed slightly positive, driven by energy stocks as oil prices gained decently on the back of a sharp decline in US inventories and a weaker US dollar. In Asia, Japan’s Nikkei 225 and South Korea’s KOSPI also traded positive, but China’s Shanghai Composite and Hong Kong’s Hang Seng.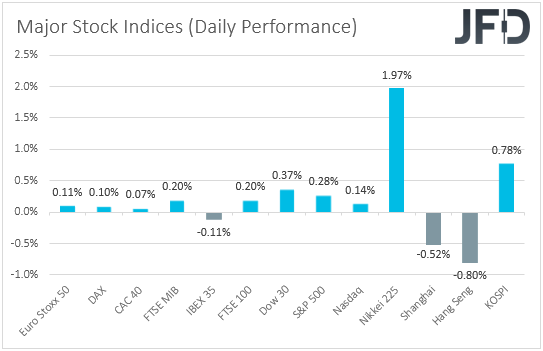
Japan’s Nikkei rallied nearly 2%, perhaps as Prime Minister Yoshihide Suga said he would step down, setting the stage for a new leader. The outcome was seen as favorable by the markets due to the criticism Suga received in handling the coronavirus pandemic. Actually, his support ratings sank to below 30%, and with that in mind, investors may have cheered the prospect of better days with a new PM. Suga will finish his term as the Ruling Liberal Democratic Party (LDP) president until his successor is chosen on Sept. 29 through party elections. The new LDP president will also be the new premier because of the LDP’s majority in the lower house, thus, we don’t believe that there will be drastic changes with regards to the new government’s policies. The new general elections are expected to be held on Oct. 17.
Now, the spotlight is likely to fall on the US employment report for August, due out later today. Nonfarm payrolls are expected to have slowed to 750k from 943k, but the unemployment rate is anticipated to have slid to 5.2% from 5.4%. Average hourly earnings are forecast to have grown another 0.4% mom, the same pace as in July, something that is likely to keep the yoy rate unchanged at +4.0%.
Despite the hawkish views by several of his colleagues, Fed Chair Powell maintained a cautious stance in his Jackson Hole speech. He acknowledged the progress of the US economy towards the Fed’s objectives but refrained from providing clear signals with regards to when they may begin tapering their QE purchases. He added that he wants to avoid chasing “transitory” inflation and potentially discouraging jobs growth in the process.
On Wednesday, the ADP report missed its own estimate by a large margin, with some participants raising their bets over a later QE tapering by the Fed. However, we repeat once again that we are reluctant to rely much on the ADP number, as it is proved to be far from a reliable predictor for the NFPs. Even last month, when the ADP number fell to 330k from 680k, the NFPs held more or less steady around 940k.
As we noted, the median forecast for the NFPs is at 750k, but the range of estimates is from 375k to 1.02m, which suggests that analysts and participants do not have yet a clear picture over how the labor market faired during the month. In any case, the median forecasts point to another decent report, something that could revive speculation over a QE tapering as early as at the upcoming gathering, and may help the dollar rebound. The opposite could be true if we see the actual number coming closer to the lower bound of the estimates range. This could keep the greenback under pressure and allow equities to continue sailing north, as later tapering could also mean later rate hikes, and thereby lower borrowing costs for companies for longer.
DJIA Technical Outlook
The Dow Jones Industrial Average cash index has been trading in a sideways manner since Aug. 23, between the 35165 support and the key resistance of 35520. Overall, the index continues to trade above the upside support line drawn from the low of June 21, and thus, we would consider the near-term picture to be cautiously positive.
At the time of writing, the index is testing the 35520 barrier, but even if it pulls back near the 35165 level, we would see decent chances for another leg north. This time, investors may target the record peak of 35630, hit on Aug. 16, the break of which could set the stage for extensions towards the round figure of 36000.
In order to abandon the bullish case, we would like to see a dip below 34990, a support marked by the inside swing high of Aug. 19. This may confirm the break below the aforementioned upside support line and may initially pave the way towards the low of Aug. 20, at 34630, or the low of the day before, at 34565. If neither barrier is able to halt the slide, then we could experience extensions towards the low of July 8, at 34115.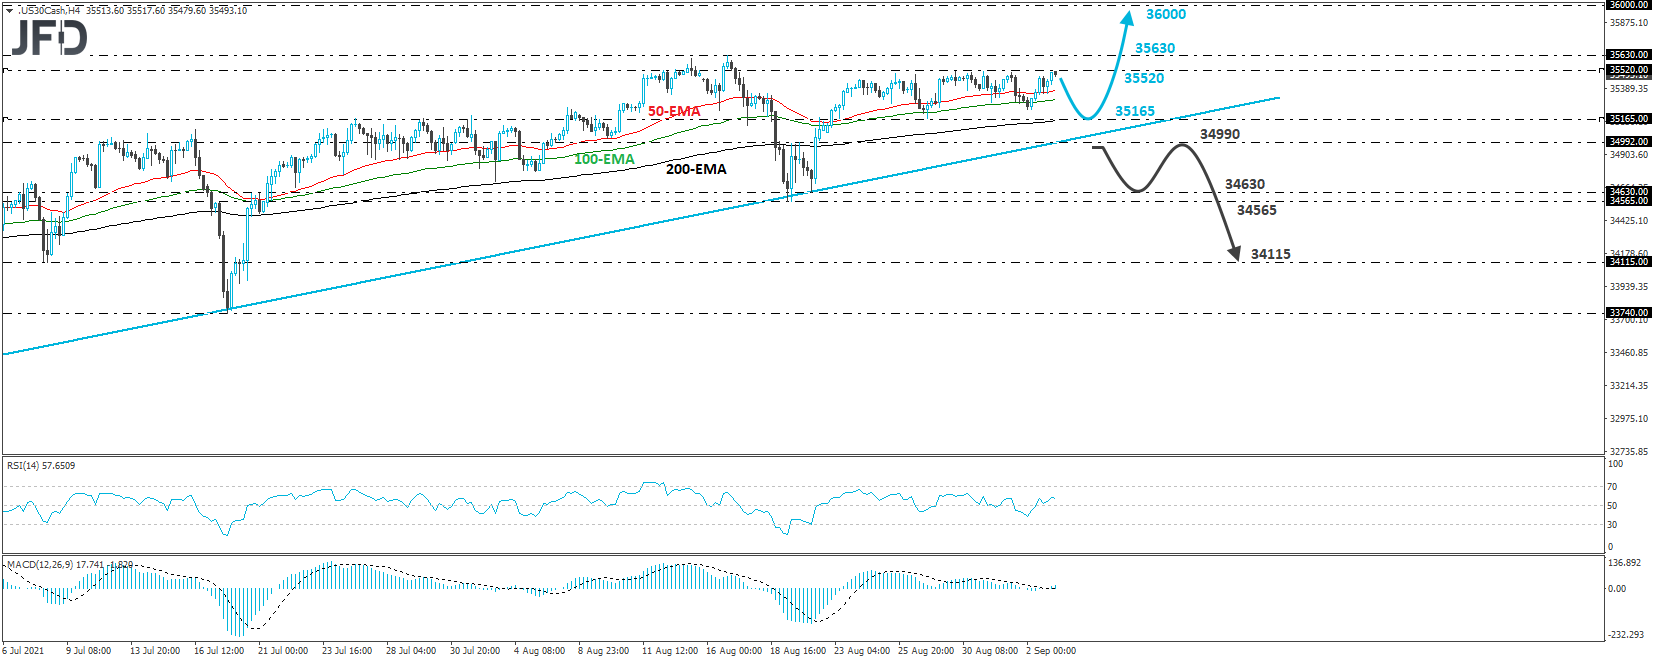
USD/JPY Technical Outlook
USD/JPY also traded in a consolidative manner yesterday, after sliding on Wednesday. The pair remains above the upside support line drawn from the low of Aug. 4, but the latest consolidation makes us a bit skeptical with regards to a trend continuation. In order to get confident on that, we would like to see a clear break above the key resistance zone of 110.23.
That zone prevented the rate from moving higher between Aug. 19 and 27, and its break may target once again Wednesday’s peak of 110.42, or the high of Aug. 12, at 110.55. If the bulls are not willing to stop there, then we could experience extensions towards the high of Aug. 11, at 110.80.
Now, in order to start examining whether the bears have gained full control, we would like to see a dip below 109.78. This could confirm a break below the pre-mentioned upside line and may open the path towards the 109.58, or 109.52 levels, or even the 109.42 barrier, marked as a support by the low of Aug. 24. If the slide doesn’t stop there, then the next stop may be the 109.12 territory, defined by the lows of Aug. 16 and 17.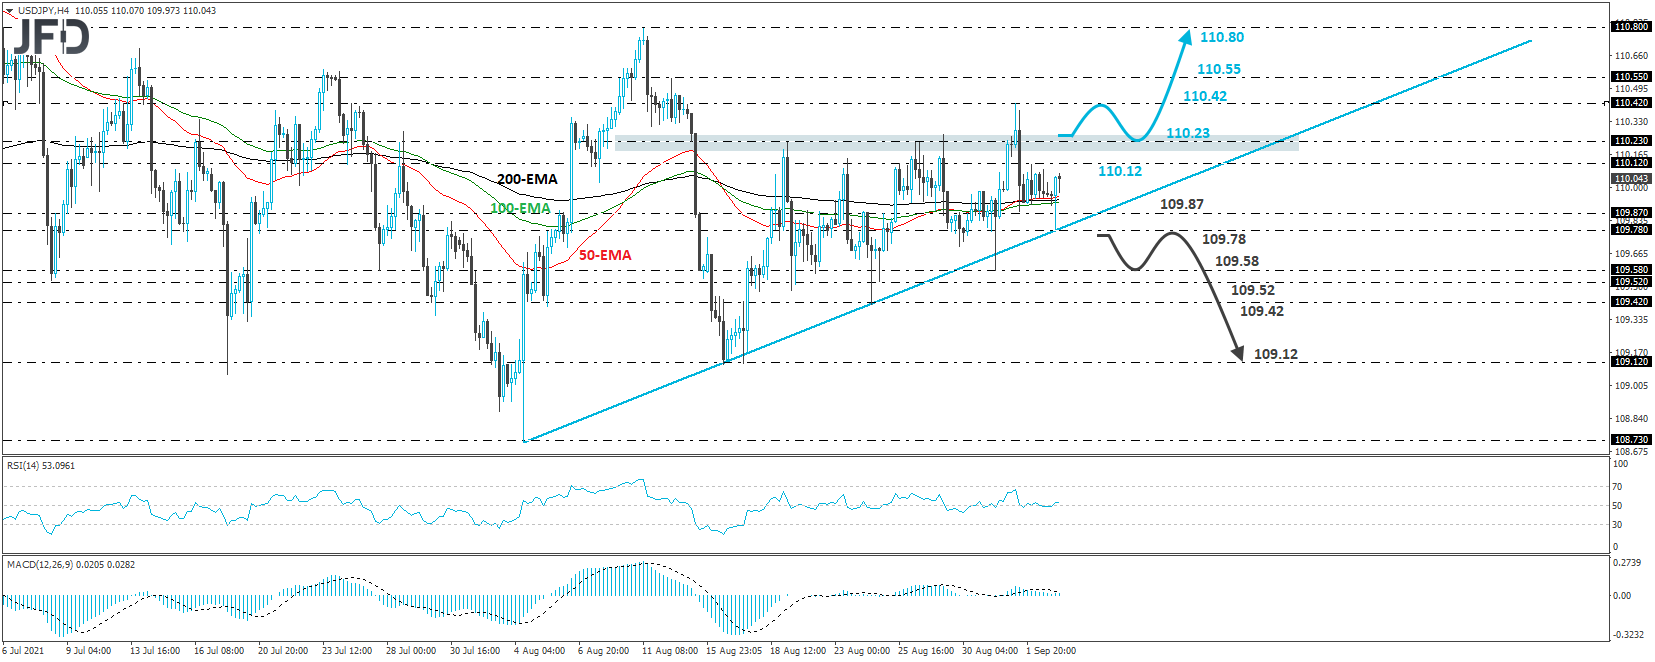
As For The Rest Of Today's Events
Besides the US jobs data, we do get the final services and composite PMIs from the Eurozone, the UK, and the US, but as it is always the case, they are expected to confirm their preliminary estimates. The ISM non-manufacturing PMI for August is also coming out and it is expected to have slid to 61.8 from 64.1.