Friday April 13: Five things the markets are talking about
Capital markets are to remain sensitive until there are clear signs that tensions are not escalating.
Ahead of the US open, global equities are adding to this week’s advances as investors take comfort from further signs of trade tensions easing. The ‘big’ dollar is steady and Treasury yields have dipped after rising above the psychological +2.80% yesterday.
President Donald Trump hinted yesterday that the US might re-join the Trans-Pacific Partnership free-trade deal he pulled out of in January 2017 and this weeks oil rally take a pause as investors reassess the likelihood of direct US military action in Syria.
Stateside, market focus is now turning back to US earnings season, with some financial firms posting some of the biggest gains yesterday. JP Morgan Chase (NYSE:JPM) and Citigroup (NYSE:C) are set to release theirs today.
1. Stocks mostly in the ‘black’
In Japan, the Nikkei share average rallied overnight as suggestions from Trump that a military strike on Syria may not be imminent supported investor sentiment and higher US bond yields helped financial stocks. The Nikkei ended +0.6% higher. For the week, the index added +1.0%, posting a third straight week of gains. The broader TOPIX gained +0.6%.
Down-under, Australia shares gained on Friday helped largely by materials and health care stocks, following global markets higher after fears of an imminent US attack on Syria eased. The S&P/ASX 200 index rose +0.2%. In South Korea, the KOSPI rallied +0.5%.
China and Hong Kong stocks slid on Friday, after data showed China’s exports fell unexpectedly in March amid trade tensions with the US. China data showed that exports in yuan terms slid -9.8% in March. The market consensus was looking for a +8% gain. In Hong Kong, the Hang Seng index closed down -0.1%, while the China Enterprises Index lost -0.2%. In China, the CSI300 index fell -0.4%, while the Shanghai Composite Index lost -0.5.
In Europe, regional indices trade mixed following strong gains on Wall Street and mixed futures this morning as risk appetite returns now that Trump has dialed back claims on an immanent strike on Syria.
US stocks are set to open in the ‘black’ (+0.1%).
Indices: STOXX 600 +0.2% at 379.6, FTSE 100 flat at 7257, DAX +0.5% at 12473, CAC 40 +0.2% at 5320, IBEX 35 +0.5% at 9793, FTSE MIB +0.2% at 23358, SMI -0.1% at 8765, S&P 500 Futures +0.1%
2. Oil heads for biggest weekly gain since July
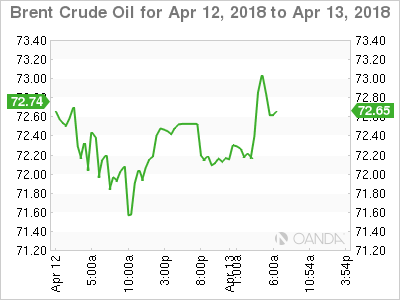
Oil prices have edged a tad higher, heading for their largest weekly gain in 10-months after Trump’s comments about possible military action in Syria and reports of dwindling global oil stocks.
Brent crude rose by +44c to +$72.46 a barrel, up about +8% on the week. WTI crude for May delivery gained +45c to +$67.52, putting the contract on track for a weekly jump of nearly +9%.
Note: Both benchmarks hit their highest in four years on Wednesday after Trump warned that missiles “will be coming” in response to a suspected gas attack in Syria.
Also providing a market bid was OPEC’s statement yesterday, which stated “a global oil stocks surplus is close to evaporating, adding that its collective output fell to +31.96m bpd in March, down -201k bpd from February.”
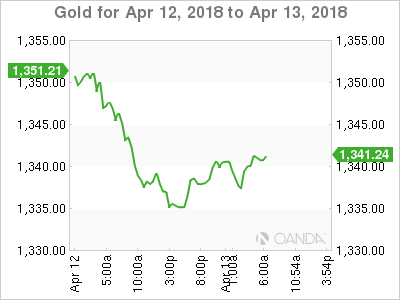
Ahead of the US open, gold has edged up a tad after posting its biggest percentage fall in over two-weeks yesterday and is set to post a small gain for a second consecutive week amid tensions over Syria and a US/China trade stand-off. Spot gold has rallied +0.2% to +$1,337.17 an ounce, and is set for a weekly gain of +0.3%.
Note: Gold prices dropped -1.3% on Thursday, the biggest one-day percentage fall since the end of March.
3. Sovereign yields climb
Borrowing costs in the euro and US have backed up overnight as geopolitical worries eased. On Thursday, Trump cast doubt over the timing of a threatened strike on Syria, lifting risk appetite in world markets and in turn denting demand for safe-haven US and euro zone debt.
Overnight, the yield on US 10-year Treasuries fell less than -1 bps to +2.83%. In Germany, the 10-year Bund yield increased +1 bps to +0.52%, the highest in more than three-weeks. In the UK, the 10-year Gilt yield gained +2 bps to +1.46%, the highest in more than three-weeks.
Note: Expect caution heading into the weekend to limit any rise in government bond yields.
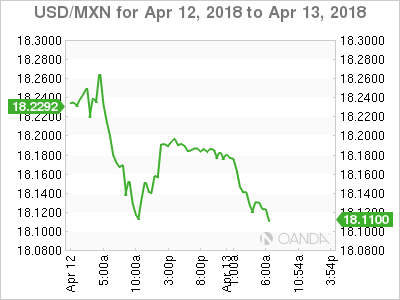
Yesterday, Mexico’s Central Bank (Banxico) left the overnight rate unchanged at +7.50% (as expected). Policy makers are expected to take quick action if necessary to anchor inflation expectations and achieve convergence to target.
4. Dollar steady on higher yields
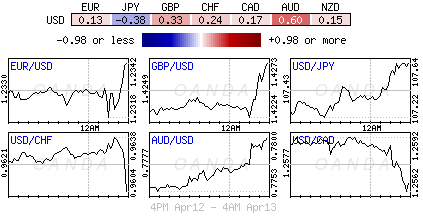
The USD is trading somewhat steady against G10 pairs supported by higher yields resulting from improved risk appetite.
USD/JPY (¥107.63) was at six-week highs as the pair moved above the key ¥107.50 resistance level.
The GBP/USD (£1.4284) saw its fifth straight session of gains with the pair approaching the key £1.43 level for its three month-highs on BoE rate differentials. The EUR/GBP cross was lower by -0.3% below €0.8640 as dealers noted that the recent ECB minutes showed that the debate on “normalizing” its policies appeared to be moving very slowely.
The Hong Kong Monetary Authority (HKMA) last night bought the local currency (HKD) for the first time since the current trading band was imposed 13-years ago, after the exchange rate sank to the weak end of its permitted range. The intervention is significant because the HKMA’s purchases have the potential to boost borrowing costs by draining liquidity. That would signal the end of an era of ultra-cheap money.
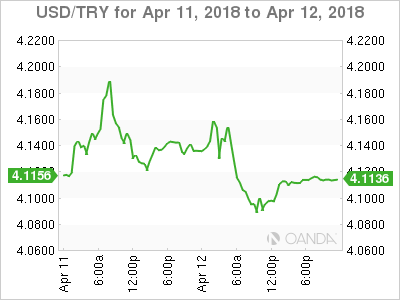
TRY ($4.0836 -0.71%) has rebounded, helped by Central Bank Statements. Bank Governor Murat Cetinkaya sais he is “closely monitoring recent lira developments with respect to their effect on the inflation outlook” and that “there may be additional tightening depending on where the lira heads next.”
5. Eurozone trade (Feb.)
Data this morning showed that in February, the euro-zone’s seasonally-adjusted nominal goods trade surplus widened from January’s +€20.2B to +€21.0B, beating market expectations.
Digging deeper, on the national front, Germany’s trade surplus narrowed from +€21.5B to +€19.2B while France’s trade deficit was little changed at -€5.2B.
Analysts note that the detail in the euro-zone release was somewhat discouraging. The surplus only widened because a -3.1% fall in imports outpaced a -2.3% fall in exports.
