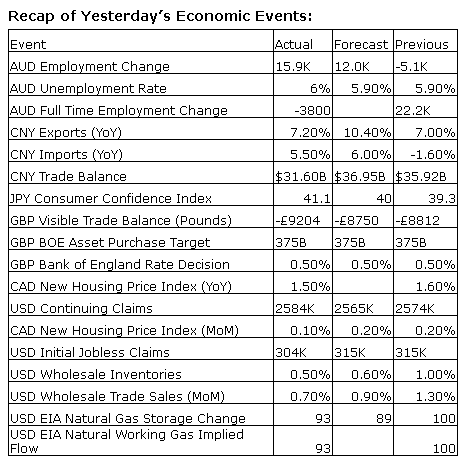
Upcoming US Events for Today:- Treasury Budget for June will be released at 2:00pm. The market expects $86.5B versus –$130.0B previous.
Upcoming International Events for Today:
- German CPI for June will be released at 2:00am EST. The market expects a year-over-year increase of 1.0%, consistent with the previous report.
- Canadian Labour Force Survey for June will be released at 8:30am EST. The market expects employment to increase by 24,000 versus an increase of 25,800. The Unemployment Rate is expected to remain steady at 7.0%.
The Markets
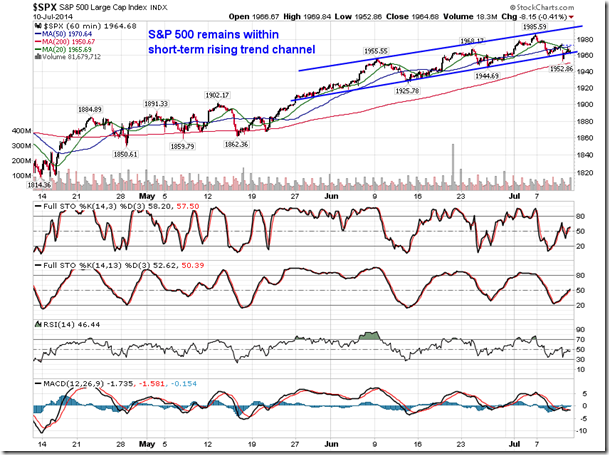
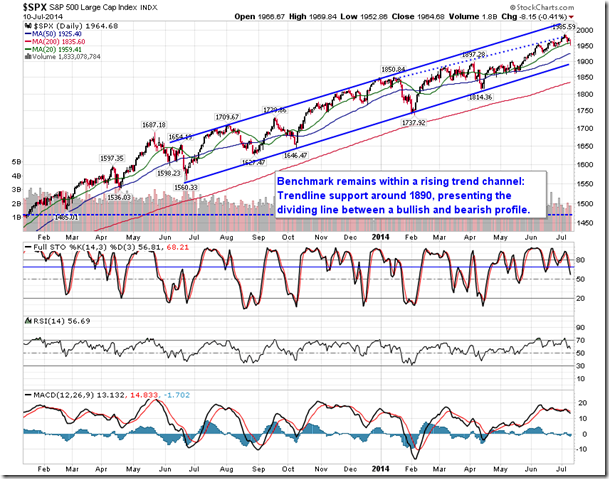
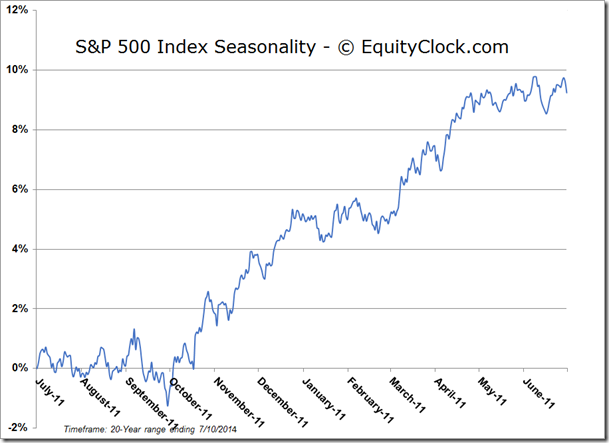
Stocks in the US declined on Thursday, weighed down by weakness in European markets as concerns relating to the health of the Portuguese financial system acted as the catalyst for investors to sell stocks. The DAX, CAC 40, FTSE MIB, and IBEX 35 all traded lower between 1.3% to 2%, causing a dip at the open of US markets of around 1%; activity stabilized once European markets closed, allowing US equity benchmarks to recoup much of the losses into the afternoon trade. The S&P 500 closed lower by 0.41%, the Dow 30 lost 0.42%, and the NASDAQ Composite declined by 0.52%, all ending above their respective 20-day moving average lines. Short-term strength given the rising 20-day day average continues to be implied. Looking at the hourly chart of the S&P 500 Index, the large cap benchmark briefly broke below the lower limit of a short-term rising trend channel that has been intact over the past six weeks. The breach is a warning of possible declines ahead, but, until it becomes confirmed on a closing basis, it is difficult to conclude anything negative pertaining to the direction of equities. Equity markets typically reach an inflection point a couple of weeks into the second quarter earnings season, following which negative returns between mid July and early October are the norm.
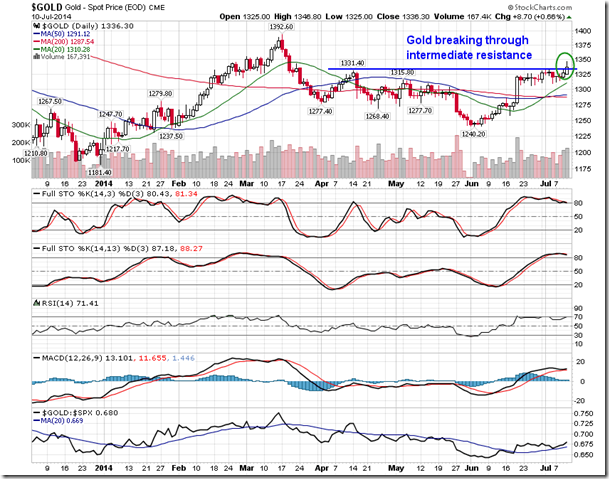
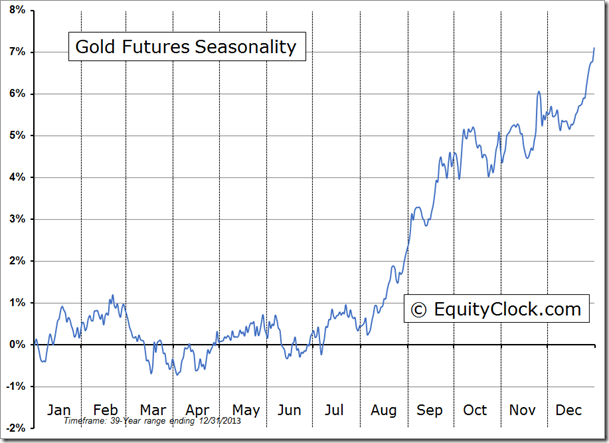
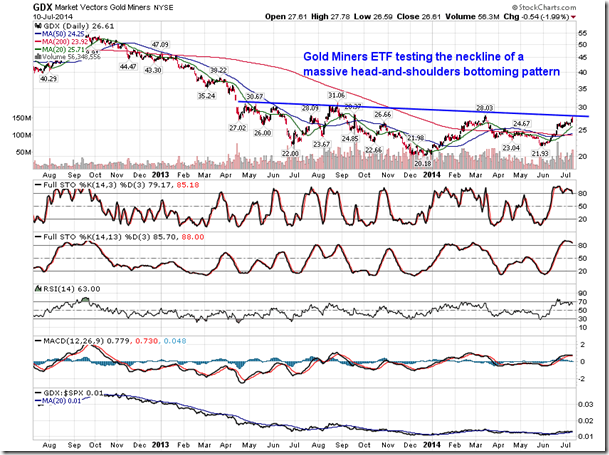
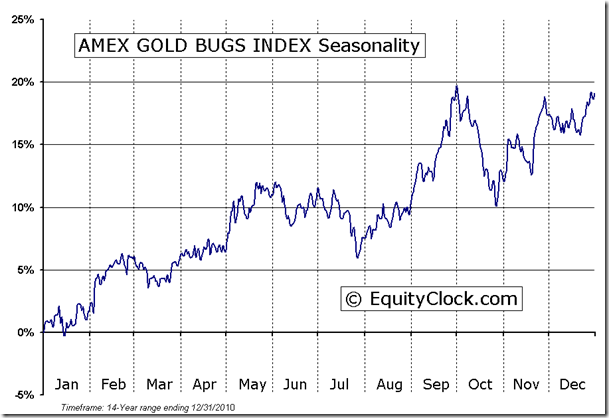
The price of Gold continues to perform well as the period of seasonal strength for the metal gets underway. Price broke above intermediate resistance at $1334 during Thursday’s session, trading to a three-month high. Next level of resistance can be found at the March high of $1392.60.But perhaps the more notable activity during Thursday’s session was in gold stocks, which seemingly charted a significant reversal on the day, opening higher only to trade lower throughout the session and end firmly in the red. The reversal comes as the gold miners ETF (ARCA:GDX) tested resistance at the March high of around $28, suggesting a hurdle in the way of further gains. The level of resistance is also significant for another reason; the gold miners ETF is testing what appears to be the neckline of a substantial reverse head-and-shoulders pattern, a bullish setup that indicates further upside potential, assuming resistance is exceeded. The pattern stretches all the way back to April of last year and suggests upside potential all the way to around $36, or 35% above Thursday’s close. Over the past three years, GDX has lost over 60% of its value as the miners struggle with declining gold prices, so a retracement of this magnitude, albeit large on the surface, still pales in comparison to the declines realized since peaking in September of 2011. The period of seasonal strength for the miners runs from the end of July through to the beginning of October.
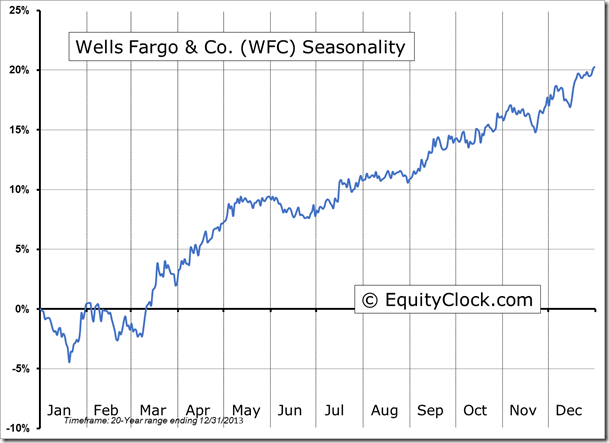
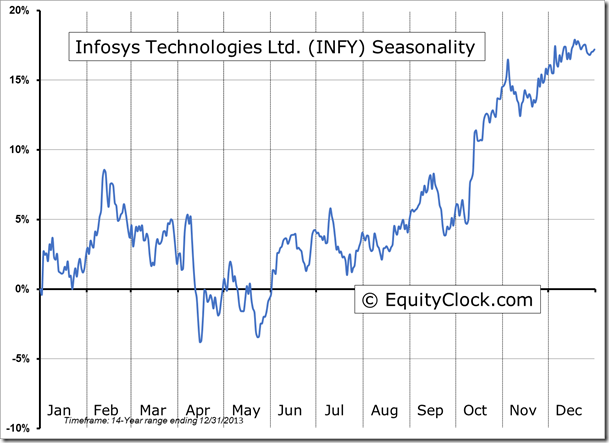
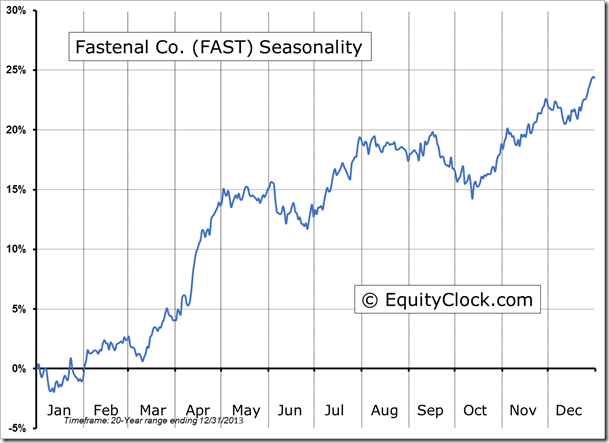
Seasonal charts of companies reporting earnings today:
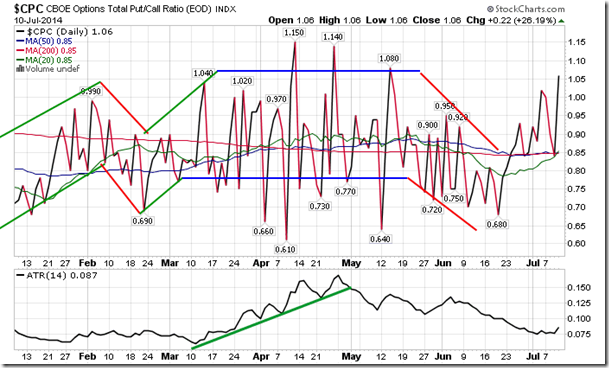
Sentiment on Thursday, as gauged by the put-call ratio, ended bearish at 1.06. The trend in the options market is leaning increasingly towards a bearish stance as investors initiate protective puts in order to lock in recent gains. From a contrarian standpoint, bearish options activity is typically conducive to equity market strength.
S&P 500 Index
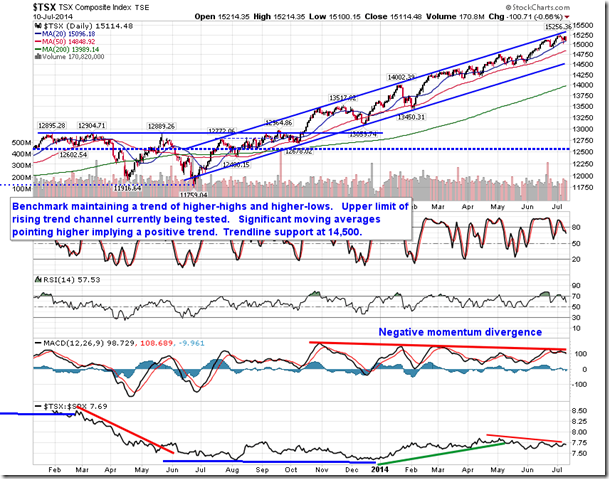
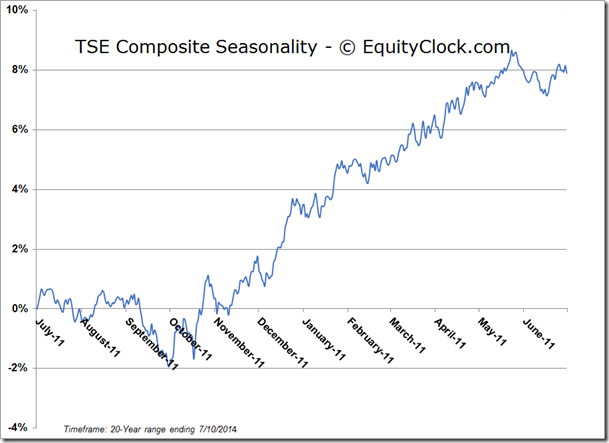
TSE Composite
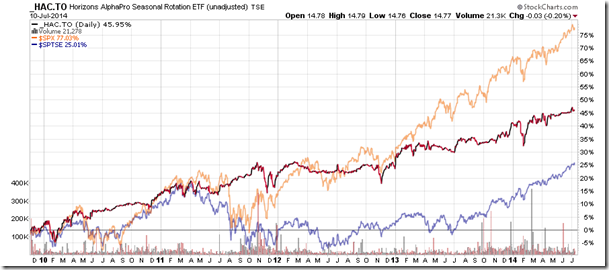
Horizons Seasonal Rotation ETF (TO:HAC)
- Closing Market Value: $14.77 (down 0.20%)
- Closing NAV/Unit: $14.77 (down 0.16%)
Performance*
| 2014 Year-to-Date | Since Inception (Nov 19, 2009) | |
| HAC.TO | 3.29% | 47.7% |
* performance calculated on Closing NAV/Unit as provided by custodian

