Monday February 5: Five things the markets are talking about
Global stocks have extended their biggest decline in two-years overnight while the ‘big’ dollar steadies outright against G10 currency pairs. Sovereign treasury yields continue to creep higher, while crude oil prices again come under pressure as U.S. explorers raised the number of rigs drilling for crude to the most since August.
This week is again dominated by monetary policy decision with four central banks meetings in the coming sessions – on Tuesday, the Reserve Bank of Australia (RBA), on Wednesday, the Reserve Bank of New Zealand (RBNZ) and the Reserve Bank of India (RBI), and finally the ‘super’ Thursday for the Bank of England (BoE) as it also publishes its quarterly inflation report.
Other U.S. data releases will focus on December industrial production (IP) and January composite PMI’s. China will release January data for its merchandise trade balance and its consumer and producer price indexes.
North of the U.S. border, Canada will close out the week by reporting its January labor force survey. The country's December international trade balance is reported on Tuesday.
1. Stocks see red
In Japan, the Nikkei share average fell sharply overnight as fears that U.S. inflation may be finally gathering pace pounded global equities. The index tumbled -2.5%, its biggest one-day drop since Nov 9 2016, when U.S. President Donald Trump won the elections. The broader Topix slumped -2.2%.
Down-under, Aussie shares fell overnight, dragged down by financials and materials. The S&P/ASX 200 index slid -1.6% ahead of Tuesday’s Reserve Bank of Australia (RBA) rate decision.
In Hong Kong, stocks ended lower overnight, but recouped much of their earlier losses, which had been sparked by Friday’s slide on Wall Street. The Hang Seng index slumped -1.09%, while the Hang Seng China Enterprise (CEI) index fell -0.43%.
In China, stocks bucked the region’s tumble as the Shanghai Composite index ended the session up +0.73%, while the blue-chip Shanghai Shenzhen CSI 300 also reversed its earlier losses, closing up +0.1%.
In Europe, regional indices are trading lower across the board, but off the session lows, as markets have pared back a large part of the earlier move lower, on the back of a slight pullback in Euro Bond yields as well as a bounce in U.S futures.
U.S stocks are expected to open little changed.
Indices: STOXX 600 -1.0% at 384.1, FTSE -1.0% at 7366, DAX -0.5% at 12715, CAC 40 -0.9% at 5317 , IBEX 35-0.6% at 10145, FTSE MIB -0.7% at 23048 , SMI -1.0% at 9132, S&P 500 Futures flat
2. Oil trades atop one-month lows, gold prices higher
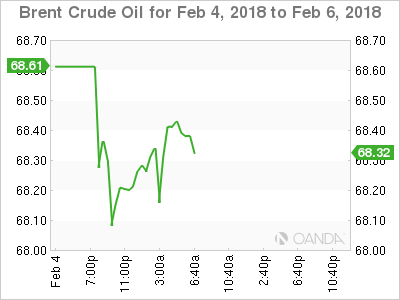
Oil prices are under pressure for a second consecutive session overnight, as rising U.S. output and a weaker physical market added to the pressure from a widespread decline across equities and commodities.
Brent oil futures are down -36c at +$68.22 a barrel, while WTI crude has fallen -13c to +$65.32.
Oil is caught up in the markets general risk-off move, not helped by the strength of the U.S. dollar in the past two trading sessions.
Adding to the pressure on oil, which hit its highest price in nearly three-years in January, has been the evidence of rising U.S. crude production, which could threaten OPEC’s efforts to support prices.
Data from the U.S. government last week showed that output climbed above +10m bpd in November for the first time in nearly fifty-years, as shale drillers expanded operations.
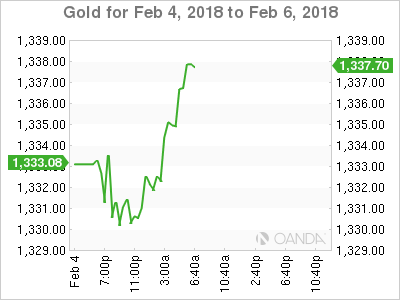
Ahead of the U.S. open, gold prices have inched higher as declining equities lend support to the yellow metal, even though robust U.S. jobs data potentially increased the chances of more interest rate hikes this year. Spot gold is up +0.1% at +$1,334.23 per ounce, after declining -1.2% on Friday in its biggest one-day fall since early December.
3. Sovereign yields continue to back up
Investors on both sides of the Atlantic are dumping government debt, but for different reasons. In the U.S., investors see more inflation coming; while in the eurozone, they see stronger economic growth.
On Friday, the U.S. 10-year Treasury yield closed at +2.852%, the highest yield in two-years, compared with +2.410% at the start of the year. German 10-year sovereign Bunds have edged up to +0.701% from 0.430% over the same period.
Note: Inflation-linked Treasuries’ (TIP’s) show that almost two-thirds of the U.S. bond selloff that started at the beginning of December is explained by inflation expectations.
Elsewhere, the RBA looks set to continue lagging the trend toward higher interest rates globally. It’s first policy meeting this year on Tuesday will likely see the central bank’s official cash rate confirmed at +1.5%, with interest in whether its guidance will be more upbeat to reflect a stronger job market.
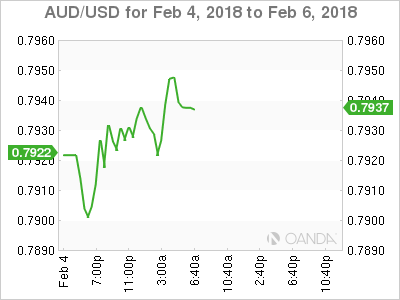
Aussie policy makers continue to face the problem of weak wages growth, soft inflation reads and an elevated AUD (A$0.7934). Forecasts for the first interest rate hike have been pushed back lately.
4. Dollar under constant pressure
The U.S. dollar remains relatively contained after rebounding at the end of last week, when strong non-farm payroll data suggested the currency’s weakness might have gone too far, too fast.
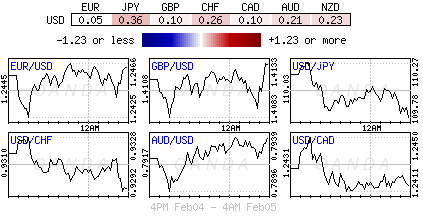
The EUR/USD (€1.2426) has managed to eek out a small gain overnight, as optimism continued to flow about a grand coalition in Germany – political parties have said to seek to reach a compromise by tomorrow (Feb 6th).
GBP/USD (£1.4102) is little changed despite the Jan. UK PMI Services reading missed expectations (see below).
USD/JPY ‘s strong correlation with U.S. interest yields seems to have broken down as the pair tested ¥109.80 in the overnight session, despite the BoJ’s rhetoric that it would continue advocating an easy monetary policy.
Bitcoin (BTC) is down -6.7% at $7,637.
5. U.K. services expansion slides to 16-month low, Europe expands
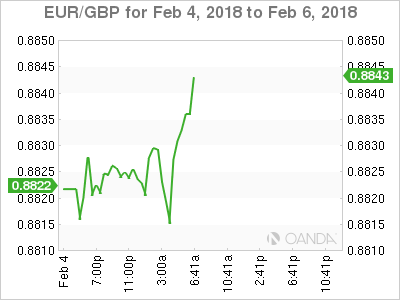
In the U.K., services PMI fell to 53, from 54.2 in December, below the expected consensus for an increase to 54.5. This morning’s data is now following weaker-than-expected manufacturing and construction PMI data last week.
Note: This January slowdown pushes the all-sector PMI into ‘dovish’ territory as far as the Bank of England (BoE) monetary policy is concerned. The BoE announces its latest interest rate decision and inflation report on Thursday.
Elsewhere, the composite PMI for the eurozone in January was revised up to 58.8 from 58.6, hitting its highest level in a dozen years, and providing further proof that the 19-nation bloc's economy started the year on a very strong footing.
At a national level, Italy stood out, recording its highest reading in a dozen years, as businesses hired at the fastest pace in 17-years.
Note: The ECB will be encouraged to expect acceleration in wages growth, which would help it meet its inflation target in the coming years.
