Friday February 9: Five things the markets are talking about
Stateside, the House of Representatives has approved the bill to fund the U.S. government and has raised spending limits over two-years, it is now sending the measure to President Donald Trump.
Investors should expect market turbulence to continue this year as pullbacks and volatility become more common in the wake of rising central bank interest rates and sovereign bond yields.
The growing consensus is that increasing market volatility should not be capable of derailing the underlying economic expansion or fundamentally dent risk assets, it does however make many things less predictable.
Ahead of the U.S. open, European stocks have pared their decline and U.S. stock futures have gained despite an Asian session seeing red, with China’s bourses tumbling the most in 24-months.
Elsewhere, Treasury yields have backed up to trade atop of their four-year highs as the ‘buck’ edged lower. Crude oil is heading towards its worst week in 12-months on concerns of over growing U.S supply, and gold prices have temporarily stopped the bleeding.
On Tap: Canadian employment numbers are out at 08:30 am EST. Is the market about to see a deep revision to the last two-months of massive job gain headlines?
1. Stocks Sea of red
In Japan, the Nikkei share average tumbled again overnight, mirroring Wall Street’s losses, with oil-related equities leading the broad declines as crude prices slumped. The Nikkei finished down -2.3%, bringing its weekly loss to -8.1%. The broader TOPIX was -1.9%, down -7.1% for the week.
Down-under, Aussie shares slumped to a near four-month low overnight hammered by renewed selling on worries of higher inflation and interest rates. The S&P/ASX 200 index fell -0.9%. The benchmark has declined -4.6% on the week, its biggest loss in over 24-months. In South Korea, the KOSPI index fell -1.8%.
In Hong Kong, stocks crumble and cap the biggest weekly fall since the global financial crisis. At close of trade, the Hang Seng index was down -3.1%, the Hang Seng China Enterprise index fell -3.87%. For the week, the Hang Seng tumbled -9.5%, the biggest weekly loss since October 2008, while the HSCE posted a weekly loss of -12.01%.
In China, stocks were crushed and suffered their worst day in almost two-years, with blue-chip led carnage dragging the markets into correction territory. The benchmark Shanghai Composite Index tumbled -4.0% and the blue-chip Shanghai Shenzhen CSI 300 ended the day down -4.3%.
In Europe, regional indices trade mostly lower, but are off their session lows after a rebound in U.S futures ahead of the open stateside. Increased outlook for higher rates from the Bank of England (BoE) is weighing on the FTSE.
Indices: STOXX 600 -0.5% at 372.1, FTSE -0.4% at 7144, DAX -0.3% at 12221, CAC 40 -0.4% at 5129, IBEX 35 -0.7% at 9689, FTSE MIB -0.3% at 22407, SMI +0.1% at 8768, S&P 500 Futures +0.7%
2. Oil slides towards steep weekly loss as supply fears mount, gold higher
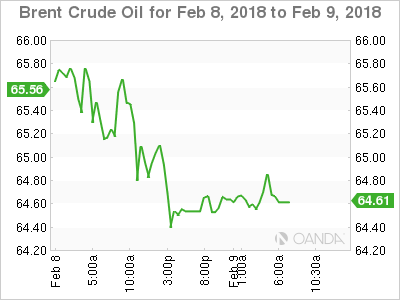
Oil prices are on track for their biggest weekly loss in 10-months after hitting new lows overnight, after data this week showed U.S. crude output had reached record highs and the North Sea’s largest crude pipeline reopened following an outage.
Brent futures are down -30c at +$64.51 a barrel. Yesterday, Brent fell -1.1% to its lowest close since Dec. 20. WTI crude is down -42c at +$60.73 a barrel, having settled down -1% Thursday, its lowest close since Jan. 2.
Note: Brent futures have lost around -9% from their four-year January high print of +$71. Futures positions suggest that investors are sitting on the largest bullish position in history.
Earlier this week, the U.S. Energy Information Administration (EIA) upped its 2018 average output forecast to +10.59m bpd, up +320k bpd from its last forecast 10-days ago.
Note: The output is now higher than the previous bpd record from 1970 and above that of top exporter Saudi Arabia.
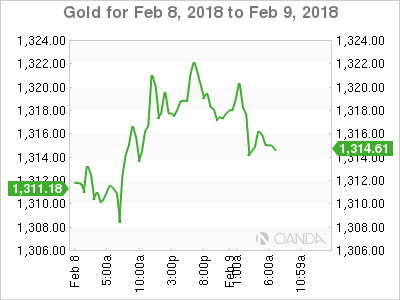
Ahead of the U.S. open, gold prices have edged a tad higher after hitting more than one-month lows yesterday, as the correction in equities drove investors towards safe-haven assets like gold.
However, gold ‘bulls’ should expect a stronger U.S. dollar and concerns over rising global interest rates to keep gains somewhat capped. Spot gold is up +0.1% at +$1,320.72 an ounce.
Note: On Thursday, gold prices touched their lowest since Jan. 4 at +$1,306.81 an ounce.
3. Equity pain brings relief to bonds
The eurozone and U.S. bond yields have edged a tad lower as renewed global stock selling has managed to lend some support to safe-haven debt markets.
Equity markets are thought to have lost about $5 trillion in the week's selloff globally.
Meanwhile, bond yields have been backing up aggressively all week as investors brace for an end to easy-monetary policies by G7 central banks.
Note: Yesterday’s more hawkish than expected Bank of England (BoE) was the latest catalyst to cause fixed income to steepen sovereign yield curves.
The yield on U.S 10-year Treasuries has decreased less than -1 bps to +2.84%. In Germany, the 10-year Bund yield fell -1 bps to +0.76%, while in the U.K the 10-year Gilt yield declined -2 bps to +1.617%.
4. Dollar jives and dips
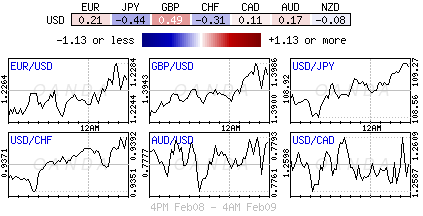
Market risk aversion sentiment remains to the fore, but the G10 forex pairs continue to stay locked within their recent ranges. The U.S dollar bull, and they are dwindling, maintain that it’s the Fed that may be caught behind the curve on rates. Next week’s U.S. CPI may very well put the ‘cat amongst the pigeons.’
Note: The greenback has caught a bid now that the House of Representatives has approved the bill to fund the U.S. government.
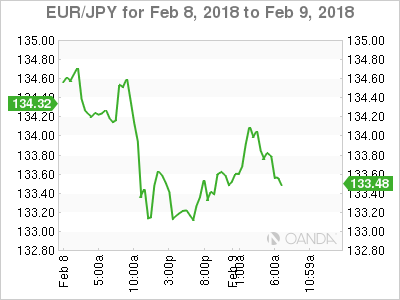
Elsewhere, the EUR/USD (€1.2254) is little changed, the pound continues to benefit, albeit struggling after the U.S. funding announcement, from the Bank of England saying on Thursday that it expected to “increase interest rates earlier and faster” than previously projected, seen by many to mean a likely May rate rise.
The Chinese currency is on track for its first weekly loss in nine-weeks as the yuan(¥6.3400) has weakened against the dollar in thin volume.
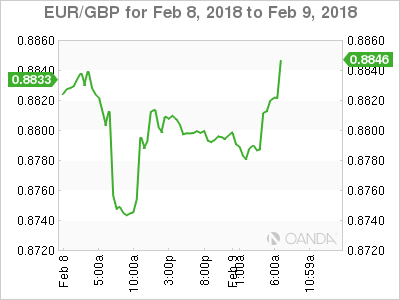
5. UK industrial output falls on North Sea pipeline shutdown
Data this morning showed that U.K. manufacturing continued to grow in the final month of 2017, but overall industrial production fell by more than anticipated due to an emergency shutdown of a North Sea pipeline.
In monthly terms, U.K. factory output grew by +0.3%, in line with market expectations, the eighth consecutive month of growth.
However, overall industrial production, meanwhile, declined by -1.3%, +0.4% more than forecast.
Separately, the ONS said that the U.K.’s trade deficit widened in December, driven by increased oil imports and rising prices. The December goods trade deficit stood at -£13.6B – significantly wider than expected (-£11.8B).
