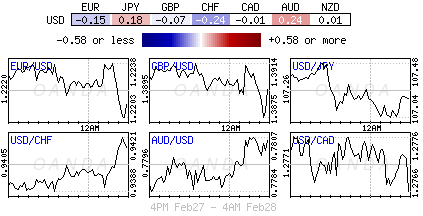
Wednesday February 28: Five things the markets are talking about
US interest rates and the dollar have moved higher after the new Fed Chair, Jerome Powell, noted in his first public outing on the ‘hill’ that his outlook for the US economy has moved up since the December FOMC meeting.
Powell’s ‘hawkish’ comments yesterday have left the door ajar for a possible four-fed hikes for this year.
Note: Futures contracts are pricing in a +33% probability it would move at least four times, in +25 bps steps.
Global equities remain under pressure as investors shift their focus to this morning’s US GDP data at 08:30 am EST.
1. Stocks see ‘red’
In Japan, the Nikkei share average fell overnight, snapping a three-day winning streak; pressured by US losses yesterday and a larger-than-expected fall in Japanese industrial output. The BoJ’s decision to trim purchases of long JGB’s is also souring sentiment by boosting the yen (¥107). The Nikkei ended down -1.4%, while the broader TOPIX fell -1.2%.
Down-under, the Aussie ASX 200 declined -0.7%, while in South Korea, the KOSPI fell -1.2%.
In Hong Kong, stocks fell to a two-week low and have posted their biggest monthly fall in 24-months. The Hang Seng index fell -1.4%, while the Hang Seng China Enterprise Index lost -2.1%.
In China, stock indices extended their losses, with the benchmark Shanghai index recording its worst month since early 2016, as weak factory data rekindled worries about the country’s economic health amid fears of faster rate hikes in the US. For the month, the Shanghai Composite Index dropped -6.4%, while the Shanghai Shenzhen CSI 300 lost -5.9%.
In Europe, regional indices trade lower across the board, mirroring Asia and US losses. The U.K’s FTSE 100 Index and Germany’s DAX have fallen -0.3%.
US stocks are set to open a tad higher (+0.2%).
Indices: STOXX 600 -0.1% at 381.8, FTSE 100 -0.2% at 7266, DAX -0.2% at 12472, CAC 40 -0.2% at 5334, IBEX 35 -0.5% at 9855, FTSE MIB +0.1% at 22755, SMI -0.4% at 8952, S&P 500 Futures +0.2%
2. Oil struggles on China demand concerns, gold unchanged
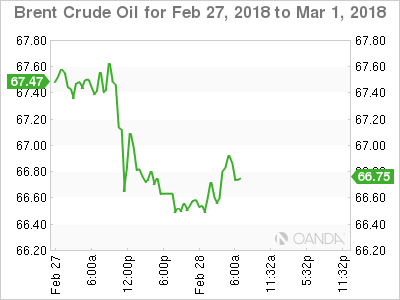
Oil prices are struggling to stay in positive territory after Asia data overnight showed that industrial activity has softened.
Three out of the world’s top consumers of crude – China, India and Japan – reported a slowdown in monthly factory activity.
May Brent crude futures are up +5c at +$66.57 a barrel, while the front-month April contract (which expires today) is also up +5c at +$66.68 a barrel. US WTI crude is down -5c at +$62.96 a barrel.
In the US, the world’s biggest oil consumer, rising crude stockpiles and a drop in refinery runs continues to cap crude prices. Expect dealers to take their cues from today’s US EIA inventory report (10:30 am EST).
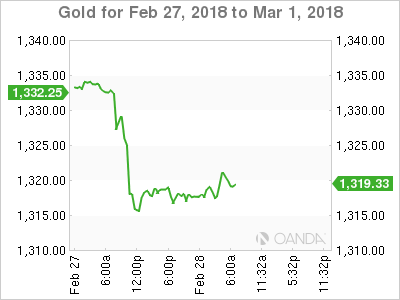
Ahead of the US open, gold prices trade flat after a more than -1% drop yesterday on a ‘hawkish’ Fed Chair Powell. Spot gold is at +$1,317.90 an ounce. It closed -1.1% lower on Tuesday after hitting the lowest since Feb. 9 at +$1,313.26.
3. Sovereign yields edge higher
G7 central bank yields are now moving in the same direction, but they are doing so at very different speeds – see Fed, BoE, BoC, ECB and BoJ.
According to the latest positioning data from the Chicago futures exchanges, speculators are making their biggest ever short-term bet on higher US interest rates. The amount of speculative ‘net-short’ positions in Eurodollar futures rose to record -3.65m contracts in the week ended Feb. 20.
Note: Money markets are pricing in a rate hike at the conclusion of the Fed’s March 20-21 policy meeting – this will be the sixth hike in the current cycle, with another two/three this year factored into market pricing.
After Fed Chair Powell’s testimony yesterday, US yields continue to grind their way towards their four-year highs. The yield on US 10-years has backed up +1 bps to +2.90%. In Germany, the 10-year Bund yield dipped -1 bps to +0.68%. In the U.K, the 10-year Gilt yield fell -1 bps to +1.561%, while in Japan, 10-year JGB yield rallied +1 bps to +0.05%.
4. Loonie in trouble as the Pound waits its fate
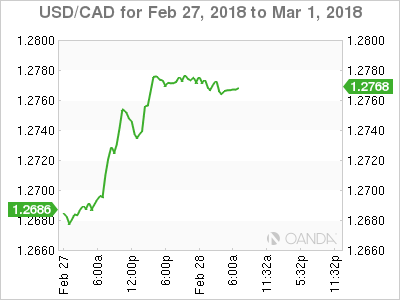
The CAD fell to a new three-month low overnight – C$1.2777 – amid a strengthening USD and the release of Canada’s fiscal budget yesterday that signaled several more years of deficits. The loonie weakened for the second-straight day as investors boosted the greenback amid growing signs the Fed could hike rates as many as four times this year.
Elsewhere, the USD is holding onto gains in the aftermath of Fed Powell’s inaugural Humphrey Hawkins testimony. Overall the market take of the testimony was interpreted as hawkish. The EUR/USD (€1.2210) is a tad lower by -0.1% as eurozone inflation data this morning continued to highlight that regional CPI had yet to show more convincing signs of a sustained upward adjustment.
GBP/USD is holding below the psychological £1.39 handle as markets waits for the EU publication of its first draft of Brexit treaty. The draft is expected to ignore some of the UK most important demands – PM’s May’s proposals for how the transitional phase would work. The draft may say that Northern Ireland might have to follow EU single market rules to avoid a hard border.
Note: Northern Ireland’s DUP party (part of May’s coalition) has already stated that if the Irish Sea became a trade border it would withdraw its support for the U.K government.
5. Switzerland’s KOF economic barometer climbs
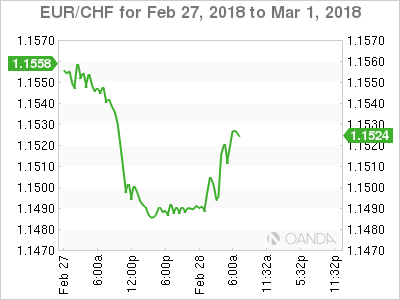
Data this morning showed that the Swiss KOF Economic Barometer climbed from 107.6 in January (revised up from 106.9) by +0.4 pt. to a level of 108.0.
Digging deeper, the strongest positive contributions to this morning’s print came from the construction sector, followed by the hospitality industry and the indicators relating to domestic private consumption.
The indicators from the financial sector and the exporting industry have remained somewhat unchanged, while an overall slight negative signal came from manufacturing.
The net result, the data suggest that the Swiss economy is expected to grow at rates above average.
