There are four funds sitting right under investors’ noses throwing off rich 10.6% dividends today. What’s more, these high-yield closed-end funds (CEFs) deliver these rich payouts monthly.
We can thank the recent selloff for this opportunity. It’s weighed on these CEFs’ prices, tweaking their yields higher.
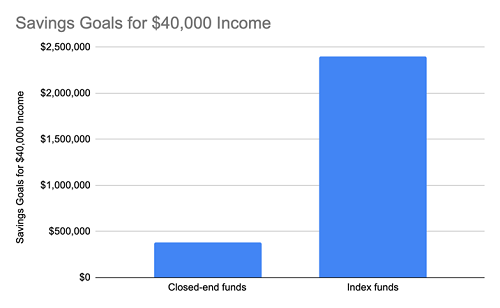
With a 10.6% payout, you can get a yearly dividend stream of $40,000 on just a $378,000 investment. If you went with an index fund like the S&P 500 ETF Trust (ASX:SPY), which yields 1.7% as I write this, you’d have to invest $2.4 million to get the same payout!

You might wonder how CEFs can yield six times as much as the index funds most investors buy. It’s actually not as radical as you might think: CEFs fuel their huge dividends by purchasing the same kinds of assets index funds do (including large cap stocks, corporate bonds and real estate investment trusts, or REITs).
But instead of being run by algorithms, as ETFs are, CEFs have human managers who optimize their portfolios, buying and selling to create a cash flow they can pass on to investors. CEFs also tend to employ some leverage to enhance their returns. That’s a particularly effective strategy today, with interest rates essentially at zero.
Another trick up CEFs’ sleeve: a focus on high-yield assets. Many CEFs specialize in corporate bonds, REITs and high-dividend stocks, so they’re naturally set up to capture some of the biggest payouts on the market and pass them on to investors.
Does this mean they sacrifice performance for income? Sure, some CEFs do. But there are many CEFs that have outperformed their benchmark index for many years. One pick in the portfolio of my CEF Insider service, for example, has posted a total return that’s beaten that of the S&P 500 by a margin of nearly 50% over the past five years!
That’s just one example, and there are plenty of others. And because of their large dividends (the CEF Insider portfolio boasts an 8% average yield today), CEFs deliver most of their returns in cash.
A 4-Fund Portfolio For 10.6% Income
So how can we create a CEF portfolio that will maximize our income-earning potential? This simple four-fund portfolio is a good way to start:

These four funds typically yield between 8% and 11%, depending on market sentiment. Today, their yields are almost uniform, at around 10.6%. Put them together and, with less than a $400,000 investment, you’ve got a monthly income stream of around $3,500.
These four funds also hand us some nice diversification, too. Pimco Income Strategy Closed Fund (NYSE:PFL) and Pimco Income Strategy II Closed Fund (NYSE:PFN) are both managed by bond experts at PIMCO, a leading firm in the CEF world, who use their unique market position to get the best corporate bonds and other assets in the credit market.
Alpine Global has an inconsistent track record, but in the last couple years, a new management team has turned AWP around by making some timely REIT picks. Among its top holdings are warehouse landlord Prologis (NYSE:PLD), which benefits from rising e-commerce; data-center owner Equinix (NASDAQ:EQIX) and cell-tower REIT American Tower (NYSE:AMT), both of which profit from the work-at-home shift; and Alexandria Real Estate Equities Inc (NYSE:ARE), whose life-science and technology research facilities are also in high demand.
Meanwhile, Calamos Global Dynamic Income Closed Fund (NASDAQ:CHW) gives you exposure to large-cap stocks from the US and around the world. Top-10 holdings include the Walt Disney (NYSE:DIS) and Microsoft (NASDAQ:MSFT), as well as Chinese tech giants Tencent Holdings (OTC:TCEHY) and Alibaba Group (NYSE:BABA).
And no, investors haven’t had to sacrifice performance for yield with these four funds.

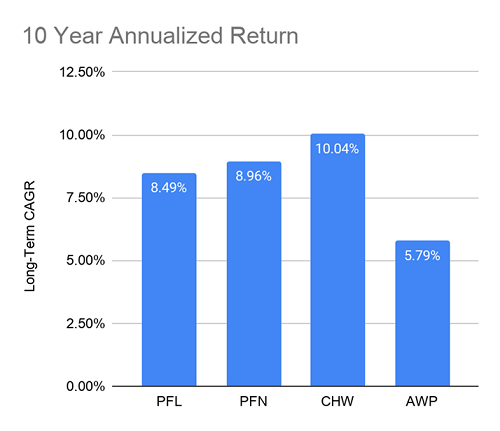
While AWP’s annualized 5.8% total return is on the low side, that’s due to the underperforming management I mentioned a second ago (that’s no longer with the fund). The other three funds have delivered an impressive 9.2% annualized return between them over a decade.
There’s only one hitch with these funds: they’re still not quite cheap enough for my taste today.
Let me explain.
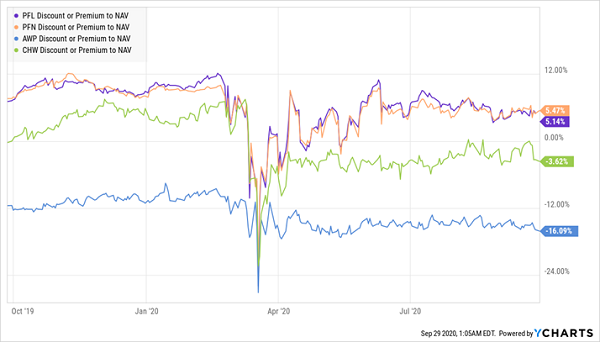
Unlike ETFs, which tend to trade at the net asset value (NAV) of their portfolios, CEFs will often trade higher than their NAV or at discounts to their NAV. Right now, PFL and PFN trade at modest premiums, while CHW’s 3.6% discount is dwarfed by a big sale at AWP.
Prices Vary For CEFs

AWP’s discount is compelling, as investors haven’t fully realized that the fund’s management shakeup has improved its quality. But premiums are rarely worth paying in the CEF world, while the 3.6% discount at CHW is pretty small: the average discount in CEFs is currently 7.5%.
The bottom line? AWP has the most upside of these four funds right now. But don’t dismiss the others; if you’re looking for a high monthly income stream, they’re still worth considering. Even better if you put them on your watch list and wait for wider discounts (or the disappearance of premiums, in the cases of PFL and PFN).
