By Edward Krudy
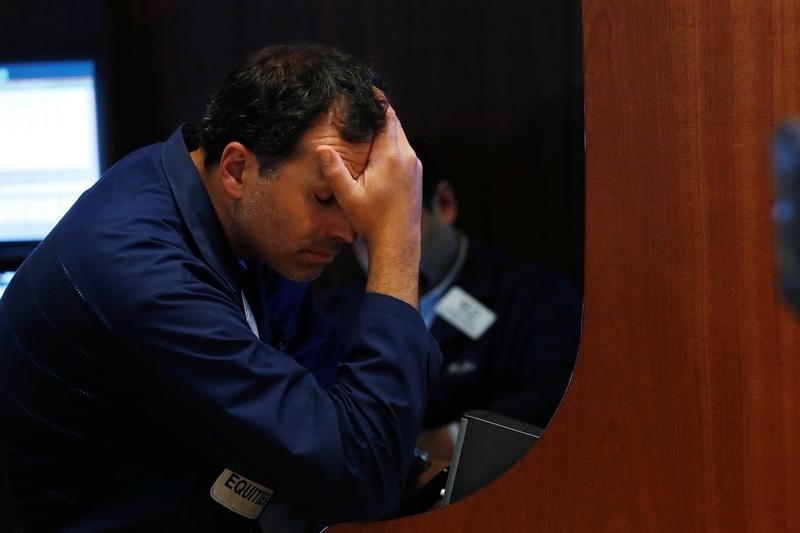
NEW YORK (Reuters) - The $2.08 trillion wiped off global equity markets on Friday after Britain voted to leave the European Union was the biggest daily loss ever, trumping the Lehman Brothers bankruptcy during the 2008 financial crisis and the Black Monday stock market crash of 1987, according to Standard & Poor's Dow Jones Indices.
Global markets skidded following the unexpected result from the June 23 referendum, in which Britons voted to withdraw from the EU by a 52 percent to 48 percent margin.
Markets in mainland Europe were hit the worst, with Milan (FTMIB) and Madrid (IBEX) each down more than 12 percent for their biggest losses ever. Britain's benchmark FTSE 100 (FTSE) was down nearly 9 percent at one point on Friday, but rallied to close down 3.15 percent.
The route started in Asia, with the Nikkei (N225) down 7.9 percent, and carried over into Wall Street as the S&P 500 fell 3.6 percent.
Mohit Bajaj, director of ETF trading solutions at WallachBeth Capital LLC in New York, said the severity of the sell-off was partly due to investors misreading the outcome and betting the wrong way.
"People positioned themselves longer because they thought the market was going to pop," he said. "We knew that we were going to sell off pretty hard and people were kind of shocked by the market."
In dollar terms, Friday's loss overtook the previous record from Sept. 29, 2008, the day when Congress rejected a $700 billion bailout package for Wall Street during the financial crisis. On that day, global markets lost $1.94 trillion.
The losses are calculated using the S&P Global Broad Market Index (BMI), which includes equity markets in 47 countries.
To be sure, the record size of the dollar decline is partly due to the larger absolute size of today's equity markets compared with the period during the financial crisis, and especially compared with the 1980s, said Howard Sliverblatt, senior index analyst at Standard & Poor's Dow Jones Indices.
Friday's decline as a percentage of total market capitalization was 4.7 percent. That was outstripped on seven occasions during the financial crisis. The largest percentage decline during that period was 6.92 percent on Oct. 15, 2008, when the market was panicking about a deep recession. The loss corresponded to a $1.65 trillion decline.

A rival measure of global stocks, the MSCI all-country world index (MIWD00000PUS), fell 4.76 percent on Friday, its biggest percentage loss since Aug. 8, 2011, when it fell 5.09 percent on the first trading day after S&P stripped the United States of its "AAA" credit rating.
(Additional Reporting by Trevor Hunnicutt; Editing by Dan Burns and Dan Grebler)