By Sam Forgione
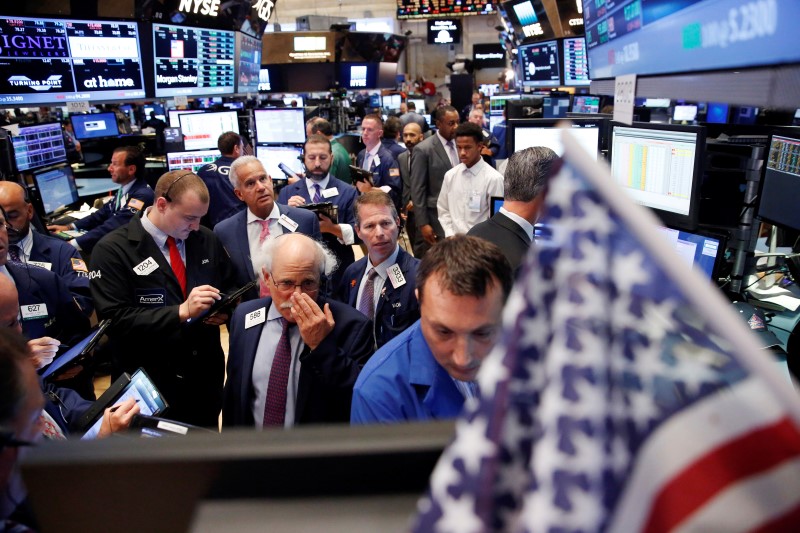
NEW YORK (Reuters) - U.S. and European shares fell on Wednesday as a drop in oil prices weighed on energy stocks, while two-year U.S. Treasury yields ended August with the biggest monthly increase since November on growing expectations the Federal Reserve will raise interest rates.
Oil prices tumbled to more than two-week lows, with U.S. crude falling more than 3.5 percent, after government data showed a large weekly build in U.S. crude and distillate stockpiles and a smaller-than-expected draw in gasoline.
The weakness in oil prices drove declines in the S&P energy index (SPNY) and the European STOXX 600 Oil and Gas sector (SXEP), both of which closed down 1.4 percent.
Investors focused, however, on U.S. non-farm payrolls data due on Friday, which could provide clues on the timing of the next Fed rate increase. [nL1N1BC230] [nL1N1BB1S1]
Data showing the U.S. private sector added 177,000 jobs in August, compared with expectations of 175,000, boosted investors' optimism about Friday's numbers.
"People are too focused on transitory events and that's what is causing these ups and downs in oil prices," said John Conlon, chief equity strategist at People's United Wealth Management.
Yields on U.S. two-year Treasuries (US2YT=RR), which are more sensitive than longer-dated maturities to expectations about the timing of Fed rate increases, rose 14 basis points for August. [nL1N1BC10M]
Benchmark 10-year Treasury (US10YT=RR) yields posted their biggest monthly increase in more than a year, of 12 basis points.
MSCI's all-country world equity index (MIWD00000PUS) was last down 1.16 points, or 0.28 percent, at 416.61.
The Dow Jones industrial average (DJI) ended down 53.42 points, or 0.29 percent, at 18,400.88. The S&P 500 (SPX) closed down 5.17 points, or 0.24 percent, at 2,170.95. The Nasdaq Composite (IXIC) closed down 9.77 points, or 0.19 percent, at 5,213.22.
Europe's broad FTSEurofirst 300 index (FTEU3) closed down 0.36 percent, at 1,352.28.
The S&P 500 posted its first monthly decline, of just 0.1 percent, in six, while the FTSEurofirst 300 rose 0.4 percent, marking its second straightly monthly rise but dwarfed by July's 3.4 percent gain.
Brent crude (LCOc1) settled down $1.33, or 2.75 percent, at $47.04 a barrel. U.S. crude (CLc1) settled down $1.65, or 3.56 percent, at $44.70 a barrel. Prices still posted their biggest monthly rise since April, with Brent gaining 11 percent.
"Not only are we getting shocking builds, we're also being squeezed by the bullishness of the U.S. dollar," said Tariq Zahir, a trader in WTI timespreads at Tyche Capital Advisors in New York, on the declines in oil prices.
The U.S. dollar index, which measures the greenback against a basket of six major rivals, hit a three-week high of 96.255 after the U.S. jobs data on Wednesday. While the index turned flat in afternoon trading, it was set for a gain of 0.5 percent for August. [nL1N1BC1SX]

Spot gold slid to a two-month low of $1,304.91 an ounce after the release of the U.S. private payrolls data. U.S. gold futures