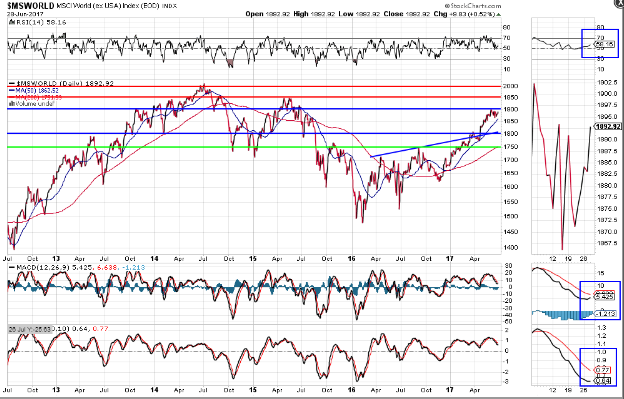
When I wrote my article on March 10, the World Market Index was trading around the 1750 level. By this past Wednesday it closed just shy of 1900, where it faces the next resistance hurdle, as shown on the following daily chart.
Inasmuch as the RSI is above the 50 level, I'd watch for a bullish crossover to occur on the MACD and PMO indicators to confirm that any breakout above 1900 has enough support to reach the next resistance target of 1950, or even 2000.
Failure to regain and hold above 1900 could negatively impact U.S. equities.
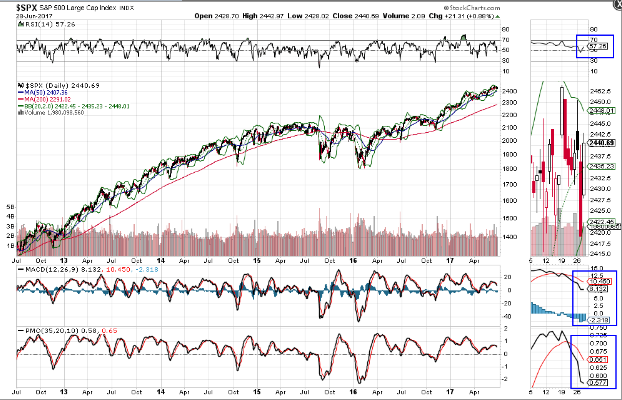
As can be noted on the S&P 500 daily chart below, price is currently stuck in a tight trading range between 2425 and 2450.
Any break and sustained hold above 2450 should be confirmed by the formation of new bullish crossovers on the MACD and PMO indicators, as well as the RSI holding above 50.
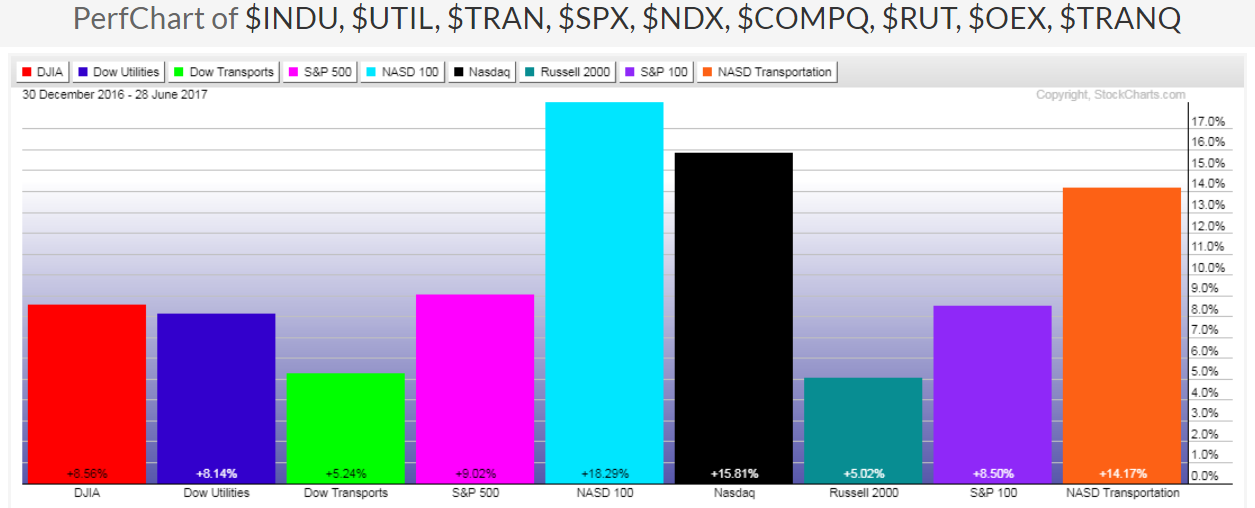
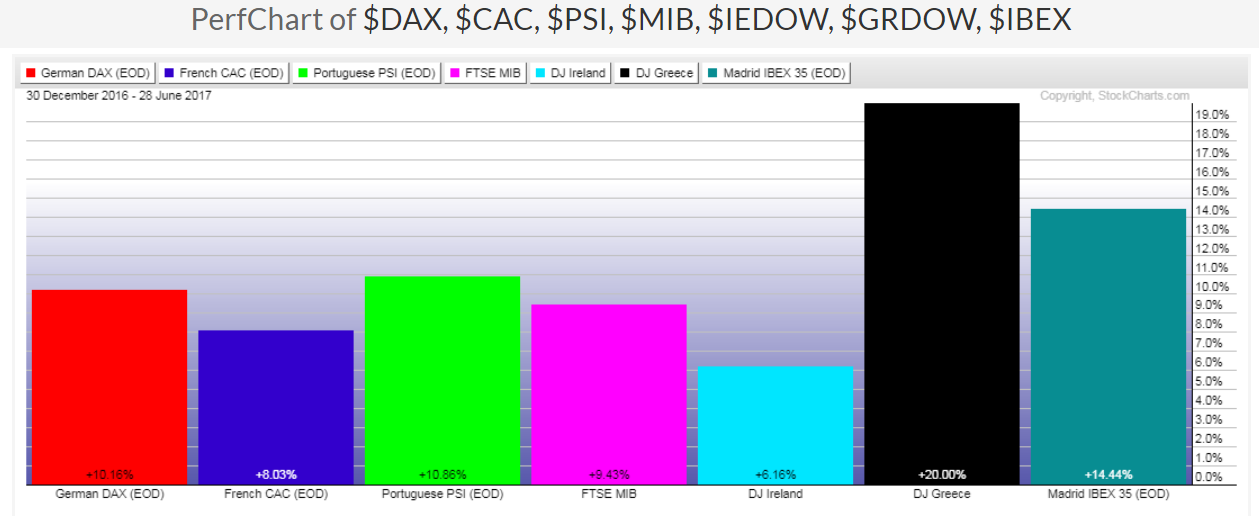
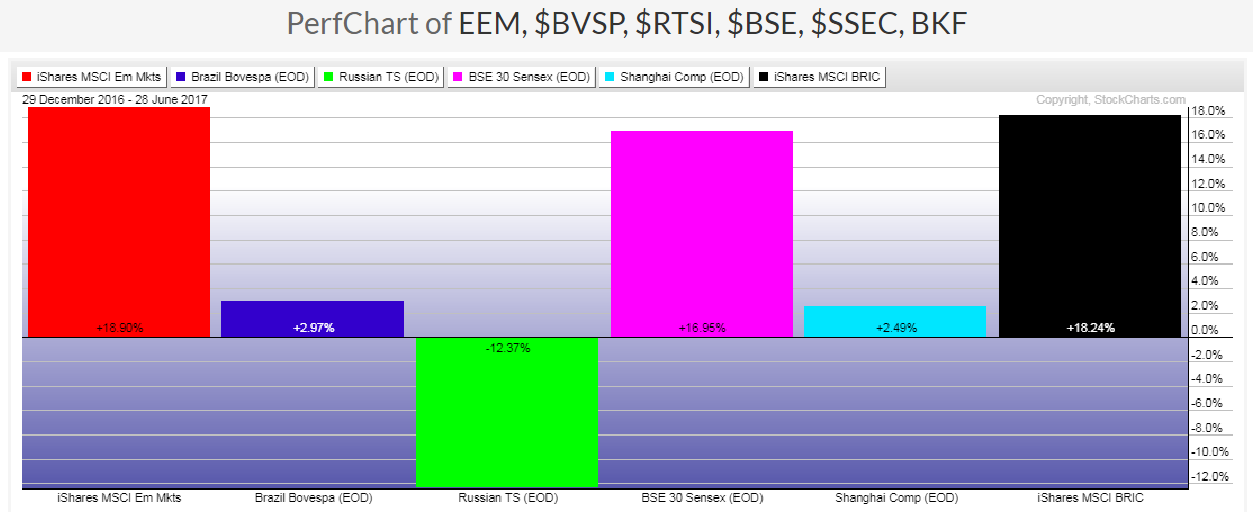
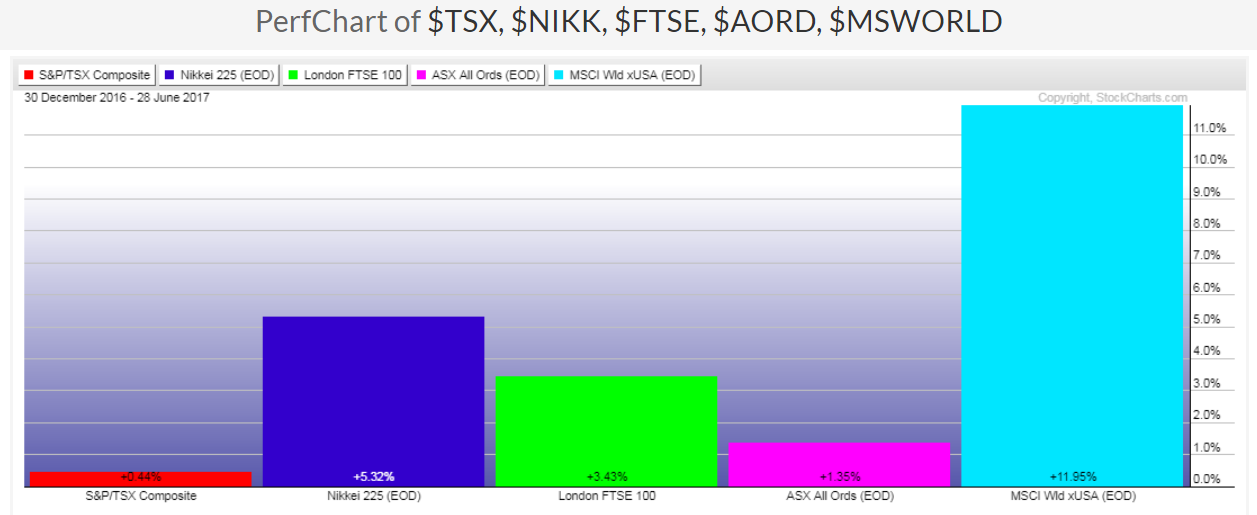
So, which major world indices are lagging in terms of percentages gained year-to-date?
The following graphs are presented without individual comment, as a glance at each will show those laggards, the most notable being Brazil, Russia, China, Canada and Australia.
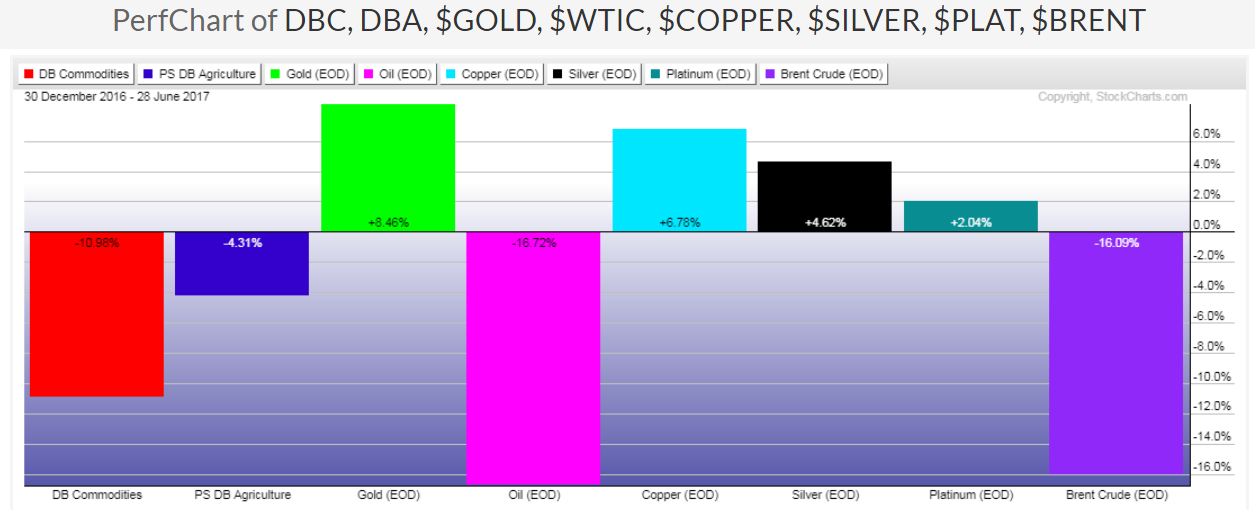
I've included a graph of the major commodities and WTI Oil and Brent Crude Oill are -16.72% and -16.09% year-to-date, respectively.
As I mentioned in my post of June 22, it's worth watching Canada's TSX Index, along with WTIC Oil, to see if their subsequent rallies above 15,250 and 43.50, respectively, are now sustainable.
We'll see whether the indices that have gained the most so far this year can hold onto those gains and whether the five laggards mentioned above are able to gain support to push the World Market Index above 1900 and propel the SPX to new all-time highs.

