Quick Review
In this past weekend’s newsletter, I discussed the confirmation of the breakout by the markets to “all time” highs.
“The breakout does keep our allocation model nearly fully allocated. We are holding onto a little larger than normal cash pile just to hedge some volatility risk during the summer months. Also, stops have now moved up to the bottom of the bullish trendline as shown in the chart below which coincides with the 100-day moving average which has been a running support line.”
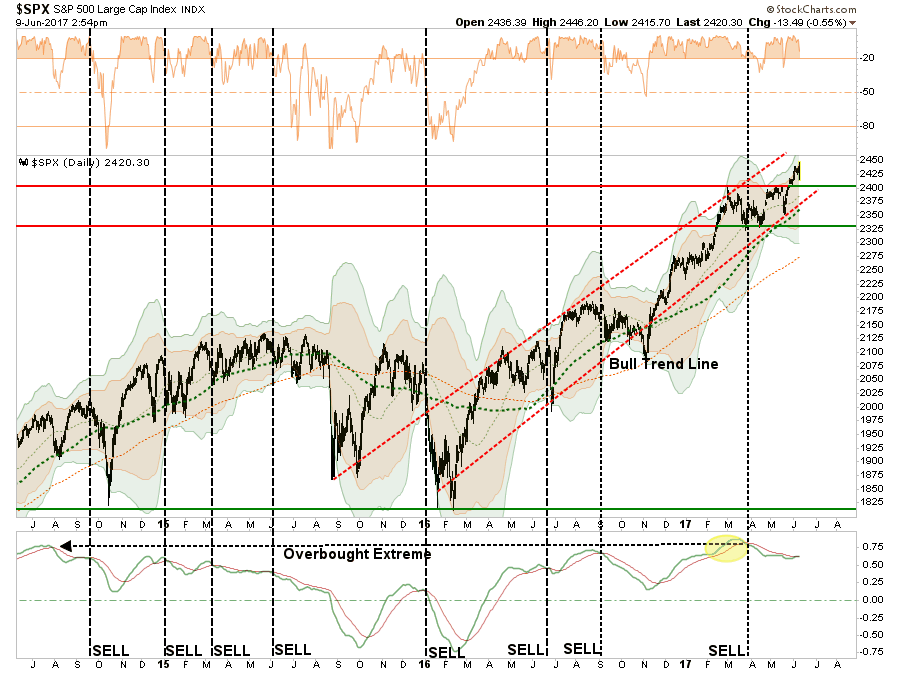
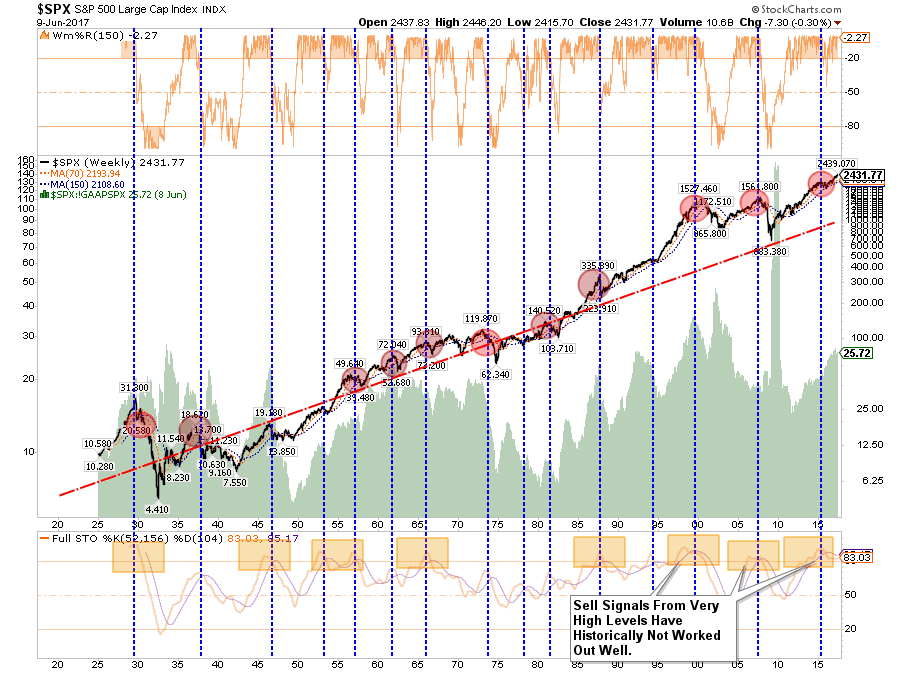
The “sell signal” currently remains in place for the S&P 500 from very high levels, and with a push into 3-standard deviations above the 50-dma currently, we remain cautious for now.
The reversal on Friday, following an early morning surge out of the gate, was not surprising given the current extension of the market. However, while the reversal wiped out all of the gains for the week, it did not change the tenor of the underlying “bullish bias” in the market.
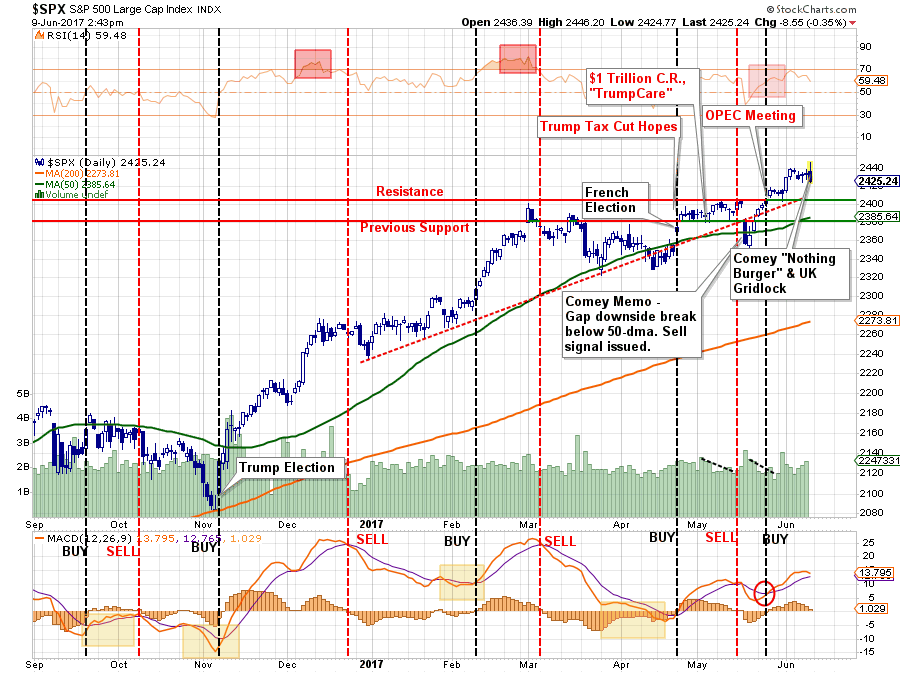
As I have noted above, as events have come and gone, the market has ratcheted its way higher, and with each ratchet higher we have added long-exposure where needed within portfolios to participate.
However, I am doing so with offsetting hedges, i.e. bonds, and through maintaining very tight stop levels.
The Risk To The “Bull” Thesis
Following the election, the markets began pricing in a strongly recovering economic environment driven by a wave of legislative policies. While the market has indeed advanced, the economic and fundamental realities HAVE NOT changed since the election. As noted on Friday:
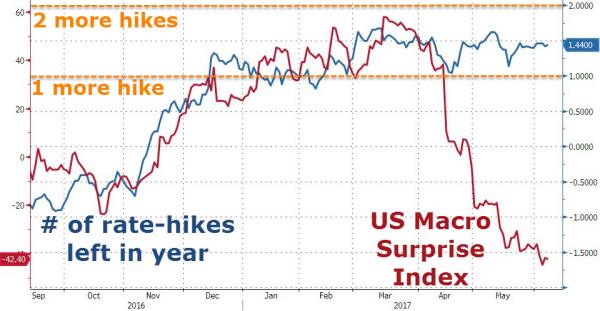
“Economic data is not buying it either. Headline after headline, as of late, has continued to disappoint from new and existing home sales to autos, inventories, and employment. This also puts the Fed at risk of further rate hikes this year.
‘It appears traders are losing faith in the rest of the year as the odds of a hike occurring in December are now above that of September (as both drop to around 25%). As economic data has crashed since The Fed hiked rates in March, so the markets expectations has dropped to just 1.44 rate-hikes this year (one in June guaranteed), well below The Fed’s guidance of 2 more rate-hikes minimum.’”
Another huge risk going forward, as well, is the risk to further stock buybacks to support higher EPS as the lack of legislative reforms to boost the bottom line fade. As noted by Goldman just after the election:
“We expect tax reform legislation under the Trump administration will encourage firms to repatriate $200 billion of overseas cash next year. A significant portion of returning funds will be directed to buybacks based on the pattern of the tax holiday in 2004.” – Goldman Sachs
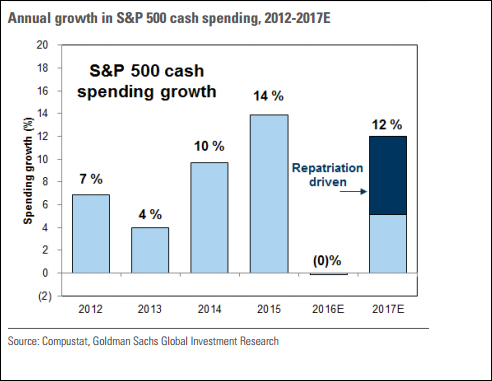
But it is not just the repatriation but lower tax rates that will miraculously boost bottom line earnings, but as noted from Deutsche Bank tax cuts are the key.
“Every 5pt cut in the US corporate tax rate from 35% boosts S&P EPS by $5. Assuming that the US adopts a new corporate tax rate between 20-30%, we expect S&P EPS of $130-140 in 2017 and $140-150 in 2018. We raise our 2017E S&P EPS to $130.”
Maybe not so fast. Here is the problem.
While you may boost bottom line earnings from tax cuts, the top line revenue cuts caused by higher interest rates, inflationary pressures, and a stronger dollar (as expected would be the result of tax reform) will exceed the benefits companies receive at the bottom line.
I am not discounting the rush by companies to buy back shares at the greatest clip in the last 20-years to offset the impact to earnings by the reduction in revenues. However, none of the actions above go to solving the two things currently plaguing the economy – real jobs and real wages.
Economic realities and wishful fantasies eventually reconnect and generally in the worst possible way.
Welcome To The Melt-Up
Not surprisingly, the rush by Wall Street to price in fiscal policy, which will likely not arrive anytime soon, has pushed markets higher in the short-term, completing the final leg of the current bull market cycle. This was a point I addressed back in October on the potential for a rise to 2400 in the markets. With the breakout of the market to new highs, the bullish spirits have emboldened investors to rush into the most speculative areas of the market.
As noted by Ed Yardeni this week:
“So far, the current bull market has marched impressively forward despite 56 anxiety attacks, by my count. They were false alarms. I remain bullish. My long-held concern is that the bull market might end with a melt-up that sets the stage for a meltdown. The latest valuation and flow-of-funds data certainly suggest that the melt-up scenario may be imminent, or underway.”
But it isn’t just “irrational exuberance” of investors pushing the markets higher, but a whole lot of liquidity as well.
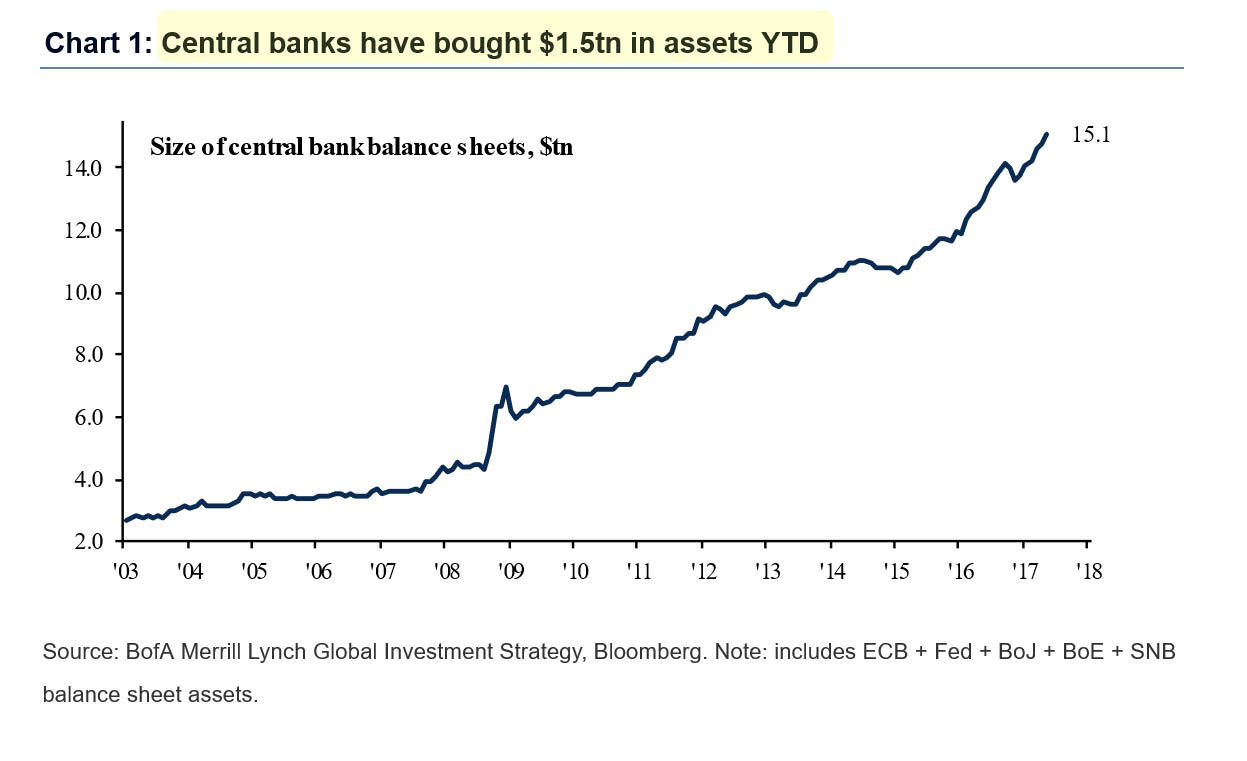
“One month ago, when observing the record low vol coupled with record high stock prices, we reported a stunning statistic: central banks have bought $1 trillion of financial assets just in the first four months of 2017, which amounts to $3.6 trillion annualized, ‘the largest CB buying on record’ according to Bank of America. Today BofA’s Michael Hartnett provides an update on this number: he writes that central bank balance sheets have now grown to a record $15.1 trillion, up from $14.6 trillion in late April, and says that ‘central banks have bought a record $1.5 trillion in assets YTD.'”
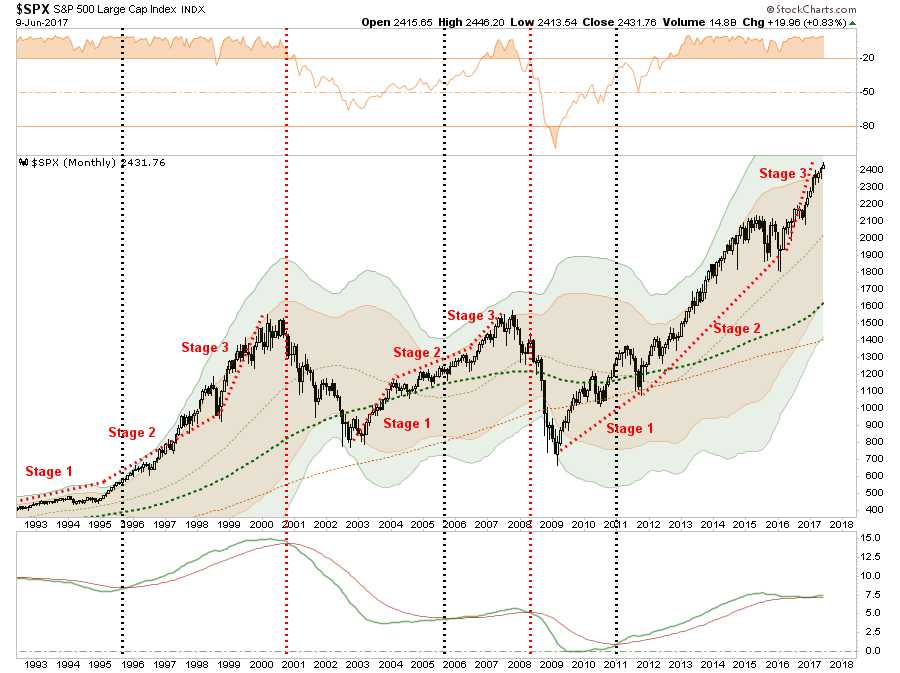
Moreover, a simple look at the markets would suggest the current near “vertical acceleration” of the market has been indicative of previous “3rd-stage melt-ups” in the market. Of course, such phases of “exuberance,” can last longer and rise further than logic would dictate.
It should be remembered that despite the “hope” of fiscal support for the markets, longer-term “sell signals” only witnessed during major market topping processes currently remain as shown below.
For now, the market is ignoring the lack of forward motion on legislative agenda and the risk to earnings growth due to the fall in inflationary pressures, economic weakness and the drop in energy prices is significant. In fact, the current setup, a potential for lower oil prices due to a stronger dollar, suggests a decline in earnings is possible.
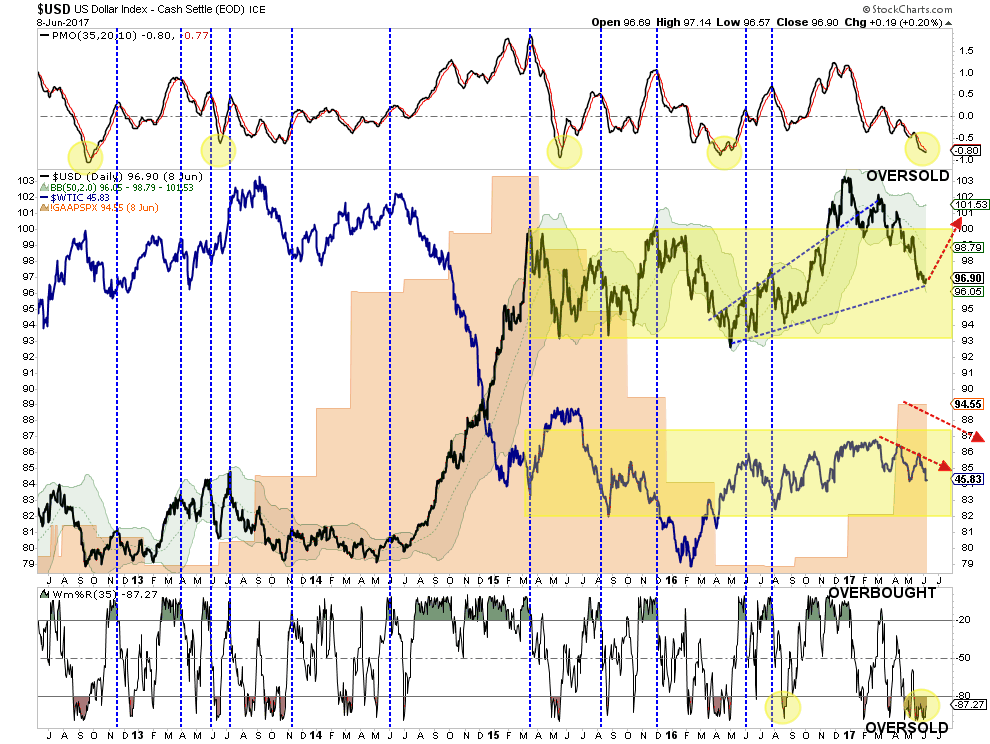
This is something we are monitoring very closely.
Let me state this VERY clearly. The bullish bias is alive and well and a move to 2500 t0 3000 on the S&P 500 is viable. All that will be needed is a push-through of some piece of legislative agenda from the current administration which provides a positive surprise. However, without a sharp improvement in the underlying fundamental and economic backdrop soon, the risk of something going “wrong” is rising markedly. The chart below shows the Fibonacci run to 3000 if “everything goes right.”
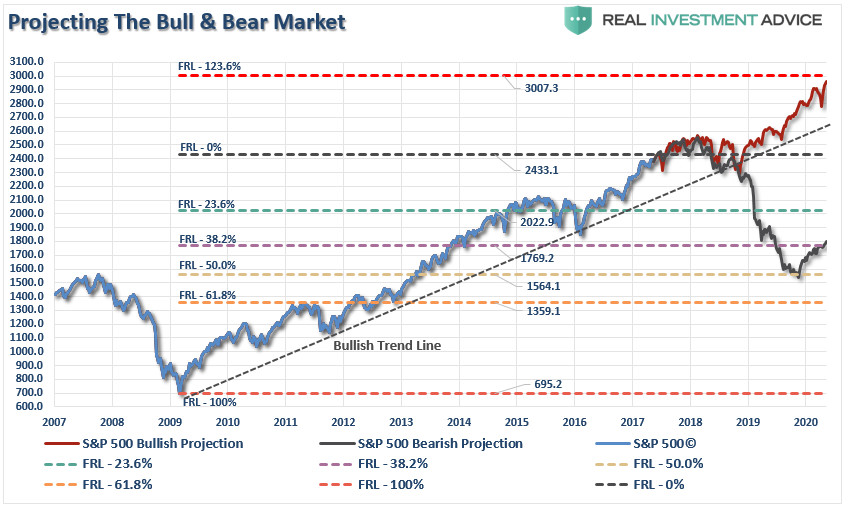
The bull-run is a one-way trip.
The question you have to ask yourself is simply this.
“From current levels, IF everything goes right there is roughly 600 points of upside. If something goes wrong there are 900 points of downside. Are those odds I am willing to take?”
It’s easy to get wrapped up in the bullish advance, however, it is worth remembering that making up a loss of capital is not only hard to do, but the “time” lost can not.
The point is while the media and bulk of the commentary continue to “urge you to ride the bull,” they aren’t going to tell you when to get off.
And when the ride does come to an end, the media will ask first “why no one saw it coming?”
Then they will ask “why YOU didn’t see it coming when it so obvious.”
In the end, being right or wrong has no effect on the media as they are not managing your money nor or they held responsible for consistently poor advice. However, being right, or wrong, has a very big effect on you.
Let me repeat for all of those who continue to insist I am bearish and somehow am missing out on the “bull market” advance:
“While our portfolios remain long currently, we do so with hedges and stops in place, a thorough methodology of analysis and a strict investment discipline we follow to mitigate the risk of long-biased exposure. In other words, whenever the market does turn, we will sell and move to cash.”
If you are going to “ride this bull,” just make sure you do it with a strategy in place for when, not if, you start to fall.
Just something to think about.
See you next week.
Market and Sector Analysis
Data Analysis Of The Market & Sectors For Traders
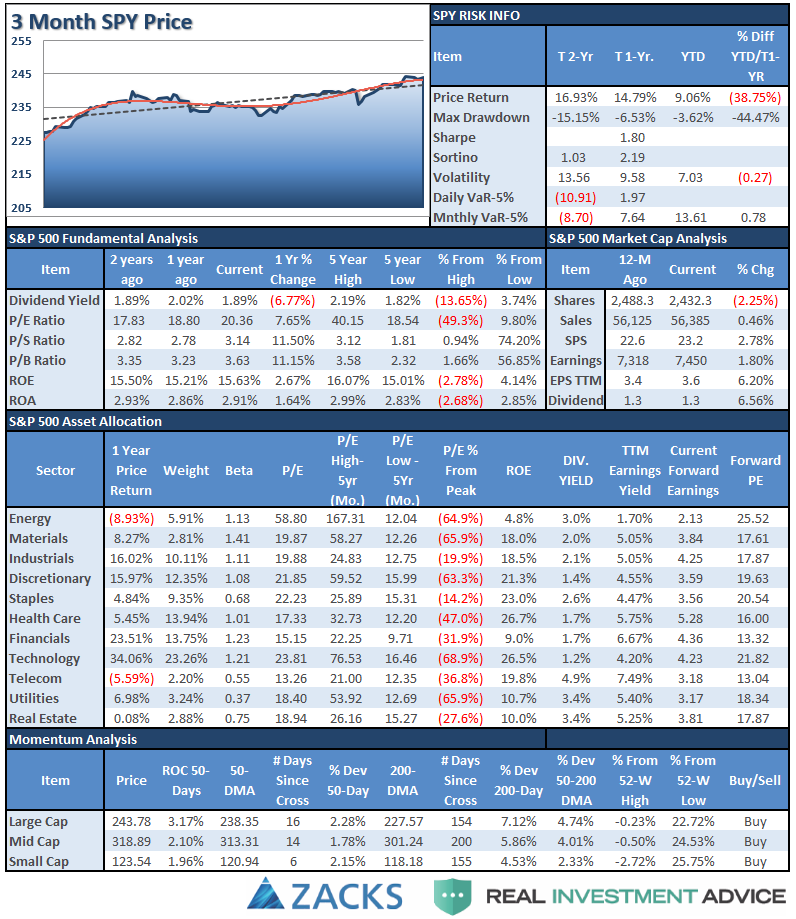
S&P 500 Tear Sheet
The “Tear Sheet” below is a “reference sheet” provide some historical context to markets, sectors, etc. and looking for deviations from historical extremes.
If you have any suggestions or additions you would like to see, send me an email.
Performance Analysis
New! Thank you for all the comments on the performance analysis below. Due to many of the emails I got, I have swapped out the sector weight graph for a year-to-date performance range analysis. Keep the comments coming. (Email Me)
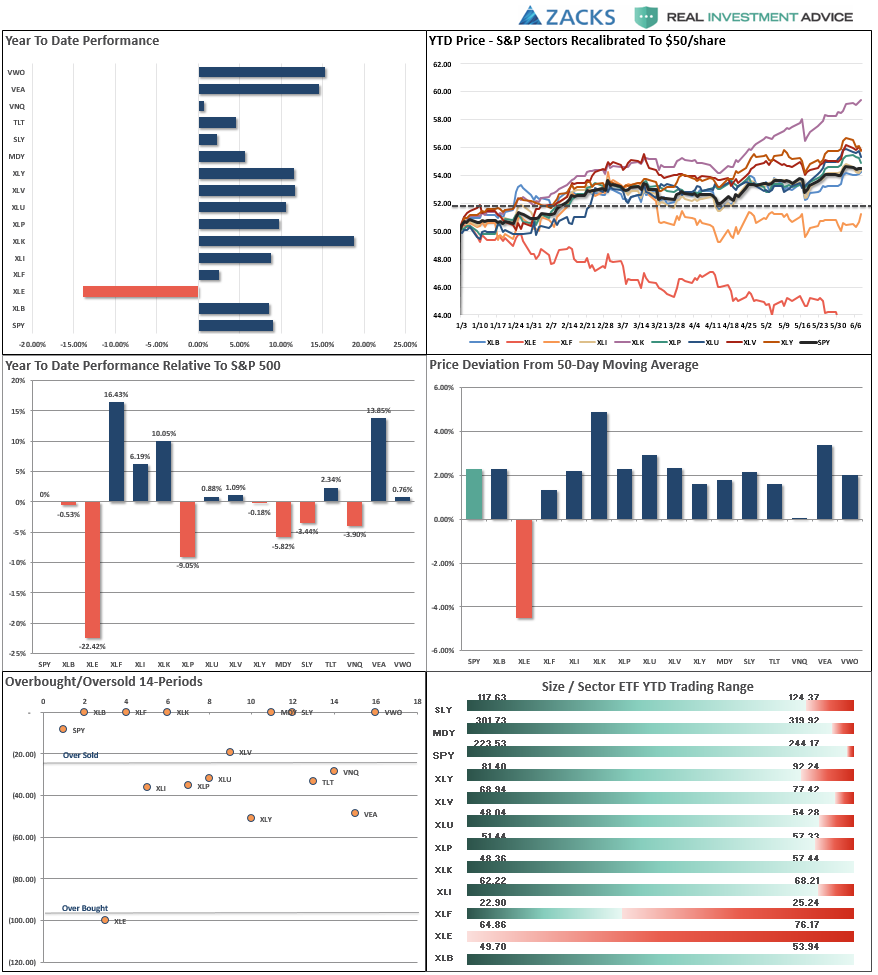
Do you find this chart useful? If you have any suggestions or additions you would like to see, send me an email.
Sector Analysis
As noted last week, we have added modestly to our broader-based “core” holdings to participate with the breakout. Stops have been moved up and remain very tight. A reversal and failure of the breakout would NOT be surprising.
On a bullish note, participation has finally started to improve. The improvement suggests there could be at least some short-term “legs” to the current advance as the market rotates leadership, however, with the markets extremely overbought currently, sustainability remains a concern.
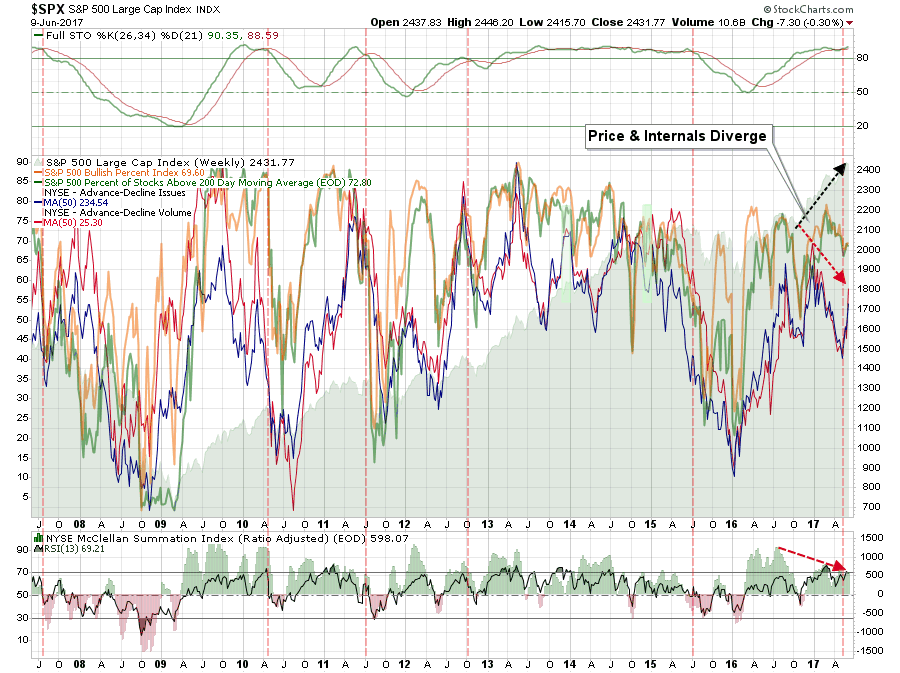
Sector Review
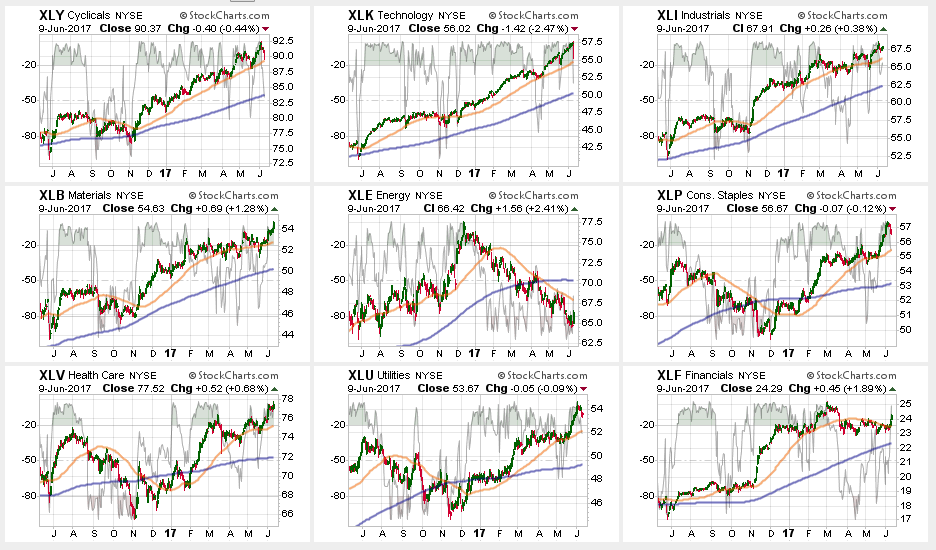
Whoa! Did That Just Happen? PAY CLOSE ATTENTION TO NYSE:DISCRETIONARY AND TECHNOLOGY.
I have previously discussed what will happen when someone hits the “sell” button. If you weren’t paying attention on Friday, you missed it.
Both Discretionary and Technology plunged on Friday as a headline from Goldman Sachs questioning “tech valuations” sent algo’s running wild. The plunge was extremely sharp but fortunately regained composure and shares rebounded. A “flash crash.”
One day, we will not be so lucky. But the point I want to highlight here is this is an example of the “price vacuum” that can occur when computers lose control. I can not stress this enough. This is THE REASON why the next major crash will be worse than the last.
While Technology, Staples, Discretionary and Utilities gave up some ground last week, In Financials, Health Care, Materials, and Industrials all took the lead.
Financials popped above their 50-dma average on a bill passed in Congress which will repeal Dodd-Frank and unleash the “holy hell” of Wall Street back onto Main Street. However, it’s good for the banks' profit margins, so financials rose. The bill is unlikely to pass in the Senate due to the “Audit The Fed” language contained in the bill. Therefore, I would “fade” the financial rally for now.
Energy – Despite the OPEC meeting extending production cuts and the rally in oil prices, the sector remains in a negative downtrend. With a major sector sell signal, and the cross of the 50-dma below the 200-dma, we remain out of the space for the time being.
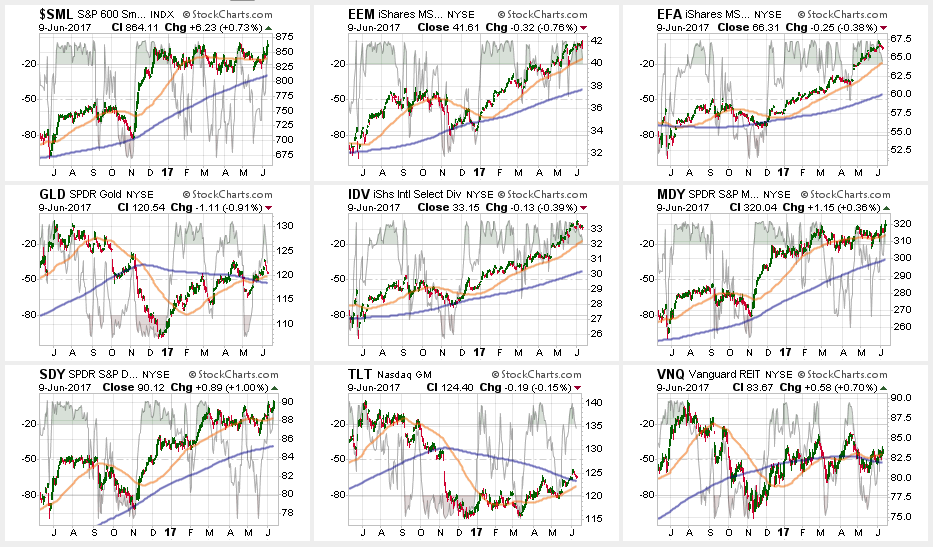
Small- and Mid-Cap stocks regained their respective 50-dma’s which removes their warning signs. Both sectors also improved on a relative basis by outperforming the broad market. Maintain exposure for now.
Emerging Markets and International Stocks continued their strength since their election lows as money continues to chase performance. There is a good bit of risk built into international stocks currently. We took profits a few weeks ago, but the recent extension suggests another round of rebalancing is likely wise. Take profits and rebalance sector weights but continue to hold these sectors but stop levels should be moved up to the 50-dma.
Gold – The rally in gold over the last couple of weeks once again failed at critical resistance at 1300/oz keeping us out of our long-term positions. Short-term trading positions will be stopped out on a move below 1220/oz.
S&P Dividend Stocks (IDV, SDY) regained key support levels currently after briefly breaking below their 50-dma. Hold current positions but maintain stops at the recent lows.
Bonds and REIT’s continued their advances this week breaking solidly above resistance. With the 50-dma’s moving upward, these sectors can be added to selectively if underweight. However, this feeds back into the conundrum of the overall market, with both offensive and defensive sectors rallying, someone is going to be wrong. We will be watching these sectors for clues as to what happens next.
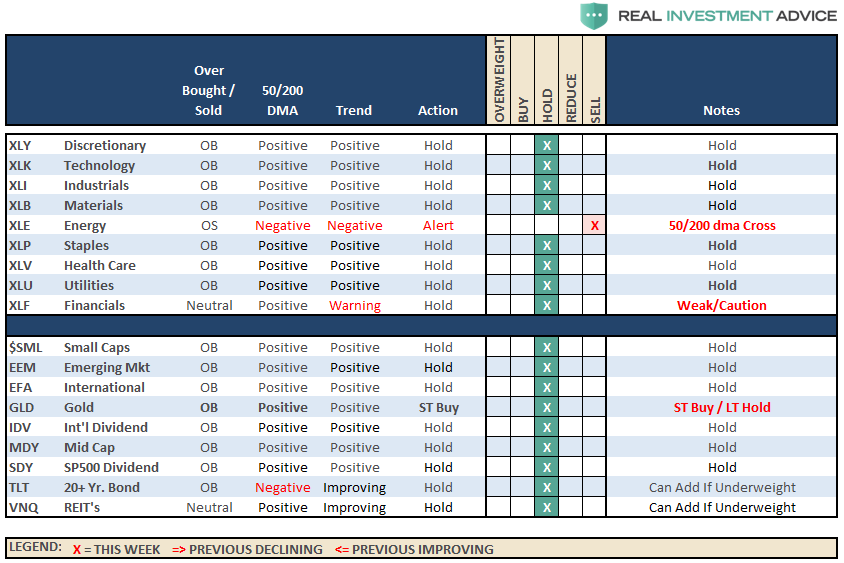
The table below shows thoughts on specific actions related to the current market environment.
(These are not recommendations or solicitations to take any action. This is for informational purposes only related to market extremes and contrarian positioning within portfolios. Use at your own risk and peril.)
Portfolio Update:
The bullish trend remains positive, which keeps us allocated on the long side of the market for now.
As noted in two week’s ago:
“With the breakout, we did increase our exposures a little bit, but I would like to see some continued strength into next week for confirmation before adding additional risk. This is particularly the case as we move into the seasonally weaker months of the year. We are maintaining stops at recent support levels on all sectors and at 2325 on the S&P 500.”
If this market can maintain its bullish underpinnings on Monday, we will review portfolios for potential additions of “risk” exposure where needed. However, be mindful, that we do so with the very strict “sell” discipline in place in the event that something goes wrong.
