Review and Update
Warning: I had a small surgery on Thursday, so I am currently “WUI,” – or Writing Under The Influence. So, hopefully, the following will make some sense.
Warning: I had a small surgery on Thursday, so I am currently “WUI,” – or Writing Under The Influence. So, hopefully, the following will make some sense.
In last week’s missive, I discussed the breakout of the market.
“The breakout does keep our allocation model nearly fully allocated. We are holding onto a little larger than normal cash pile just to hedge some volatility risk during the summer months. Also, stops have now moved up to the bottom of the bullish trendline as shown in the chart below which coincides with the 100-day moving average which has been a running support line.”
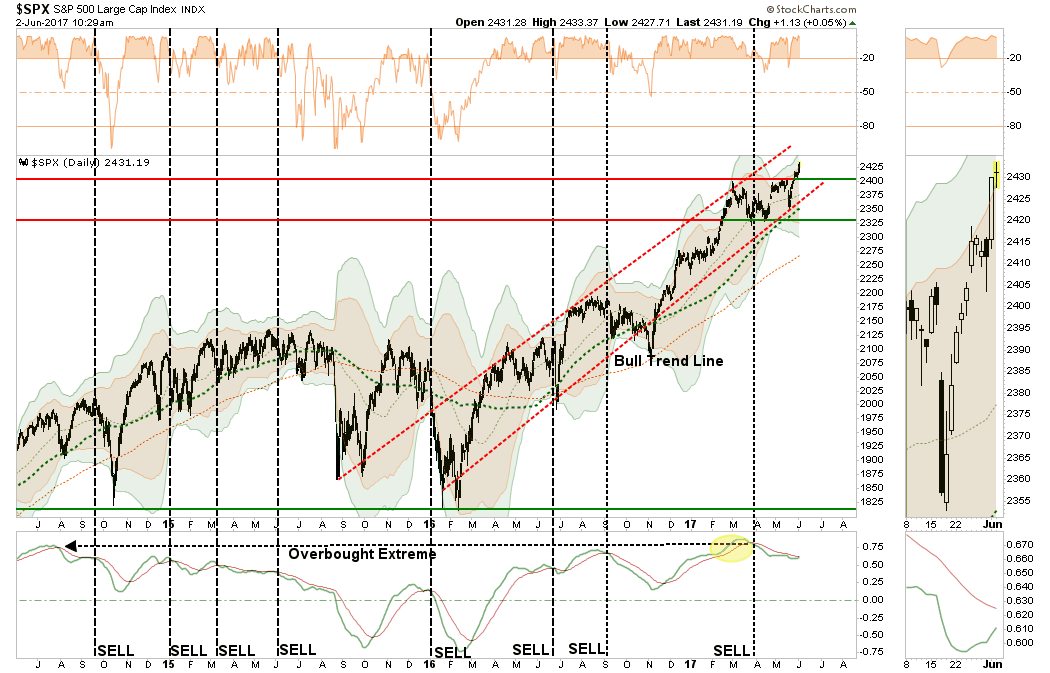
The S&P 500 “sell signal” currently remains in place from very high levels, and with a push into 3-standard deviations above the 50-dma currently, we remain cautious for now.
However, there is no denying the “bullish bias” currently remains in the market, and the sharp push higher reconfirms the underlying trend. Because of that “bias,” we remain allocated towards risk in our portfolios.
The biggest problem I have currently is simply that bonds are NOT buying the rally. As I discussed last week, and as we saw on Friday, bonds continue their “bullish bias” and broke through key support levels suggesting lower rates to come.
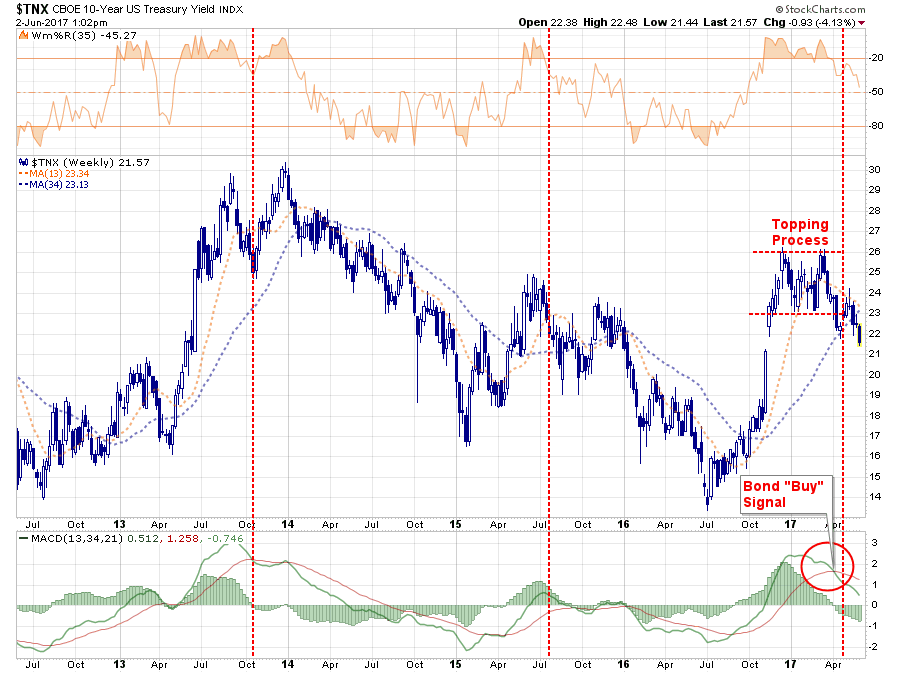
With interest rates still overbought, and on an important “sell signal,” the downside break from the recent consolidation process will likely prove problematic for stocks going forward as the flight from risk to safety continues.
But, as we discussed a couple of week’s ago, this is a very “confused market” with both offense and defensive sectors taking the lead. As shown in the “spaghetti chart” below, there are currently 8-sectors leading the S&P 500. More importantly, the “riskier” small and mid-cap markets continue to remain weak which is certainly not the backdrop to support a strongly running “bull.”
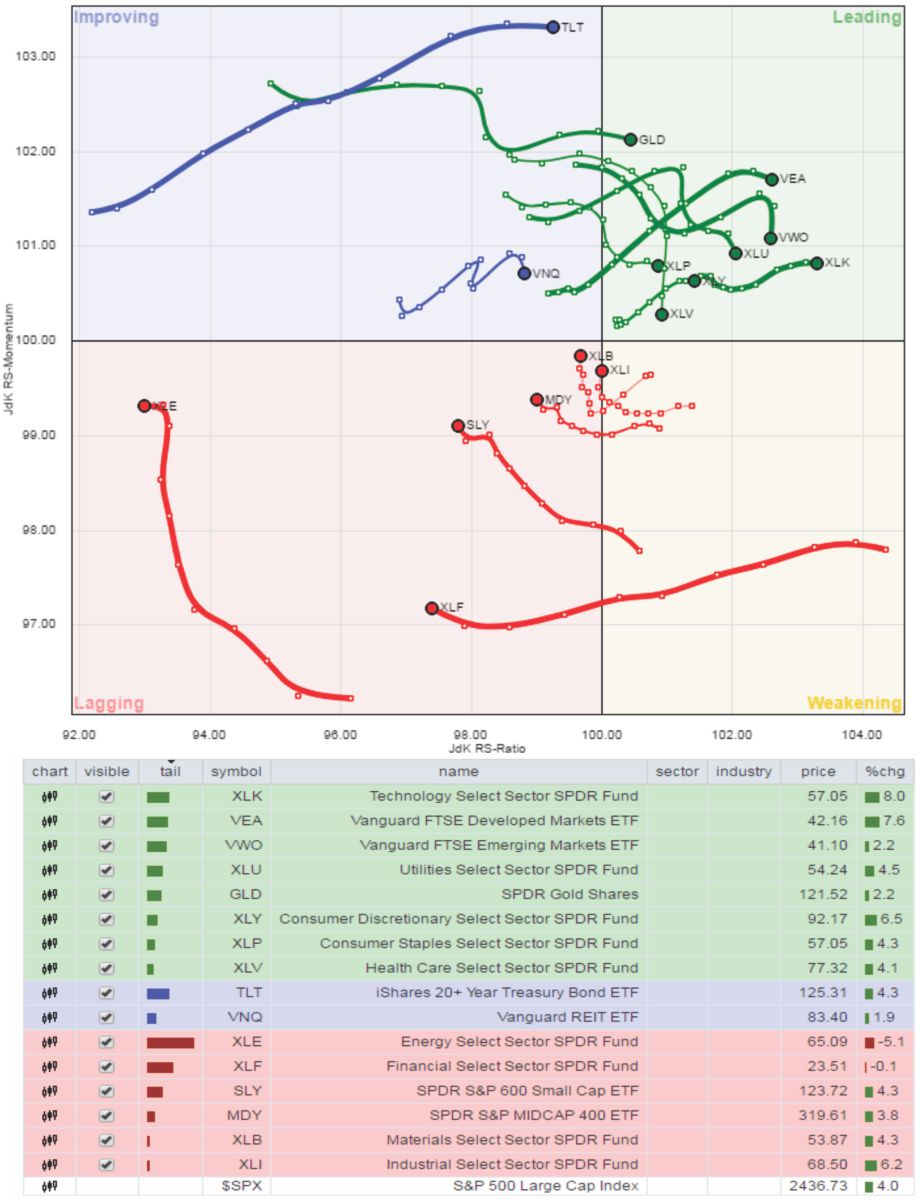
This really is a more bizarre clustering of markets and sectors that I have witnessed in quite some time. However, for now, the rotation between sectors remains tight and it is the #FANMAG stocks that continue to elevate markets because of their sheer size. (Facebook (NASDAQ:FB), Apple (NASDAQ:AAPL), Netflix (NASDAQ:NFLX), Microsoft (NASDAQ:MSFT), Amazon (NASDAQ:AMZN), Alphabet (NASDAQ:GOOG))
The question that continues to linger over the markets is just how stable is the advance? The answer to that question is unclear, but it is quite likely the spate of earnings growth seen over the last couple of quarters will soon end as year-over-year comparisons get decidedly tougher.
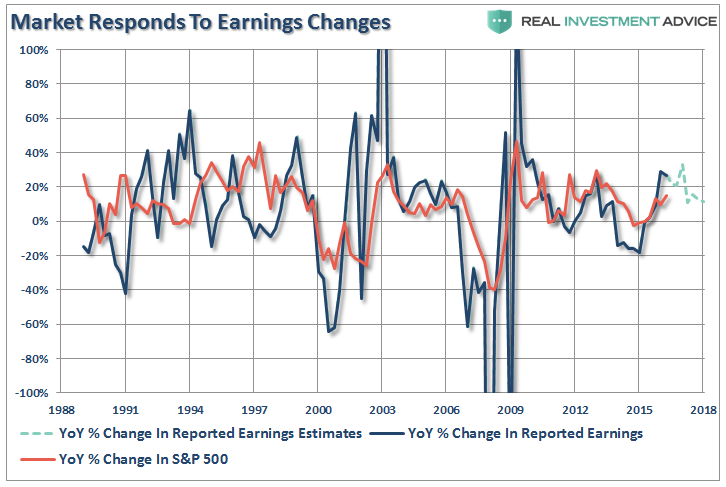
Considering that earnings estimates are generally overstated by roughly 30%, the actual net decline in earnings growth will likely be far sharper than currently anticipated. More importantly, since the bulk of the increase in earnings estimates were based upon tax cuts/reforms, when it becomes apparent those legislative policies are not forthcoming, earnings estimates will be ratcheted sharply lower. With the market trading well ahead of earnings growth currently, the risk of disappointment is extremely high.
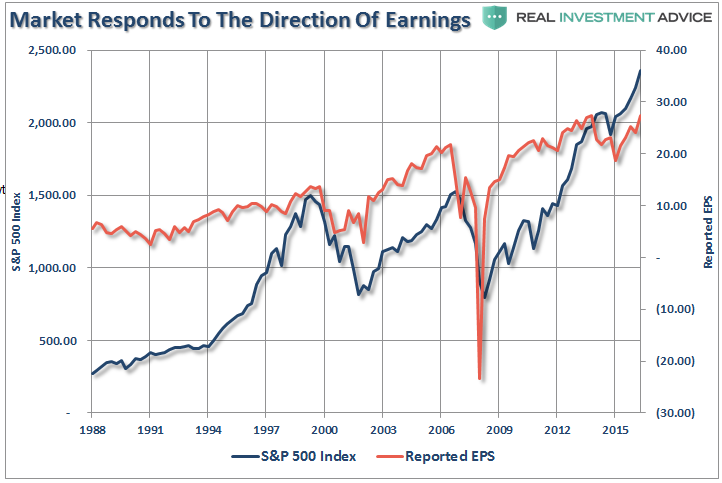
Lastly, given that much of the recent rebound in earnings came from the sharp rise in oil prices, with those prices once again on the decline, it is quite likely forward earnings are overly optimistic currently.
Importantly, and something I am going to address more on Monday, corporate profits after tax are not exhibiting the same “sharp rise” as earnings. In fact, since the lows following the financial crisis, the S&P 500 has grown by 266% versus profit growth of just 98%.
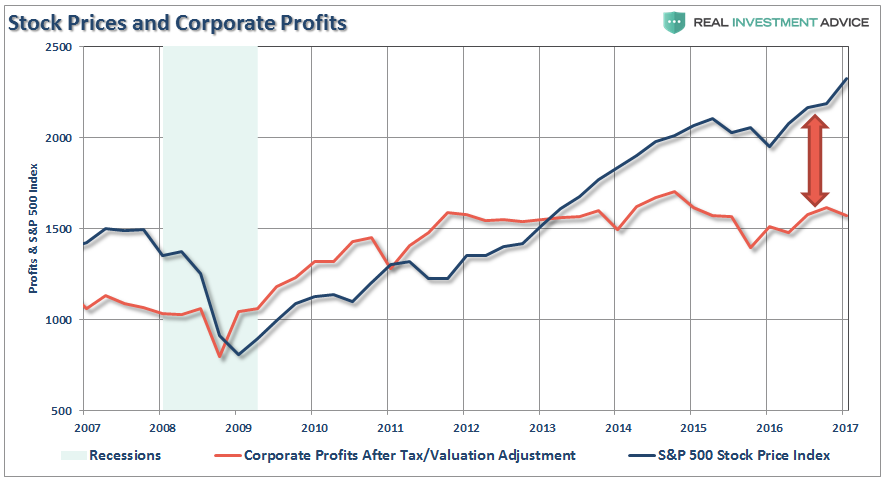
With corporate profits still at the same level as they were in 2011, there is little argument the market has gotten a bit ahead of itself. Since corporate profits are a reflection of what is happening in the economy, we can also look at inflation adjusted corporate profits as a percentage of Real GNP.
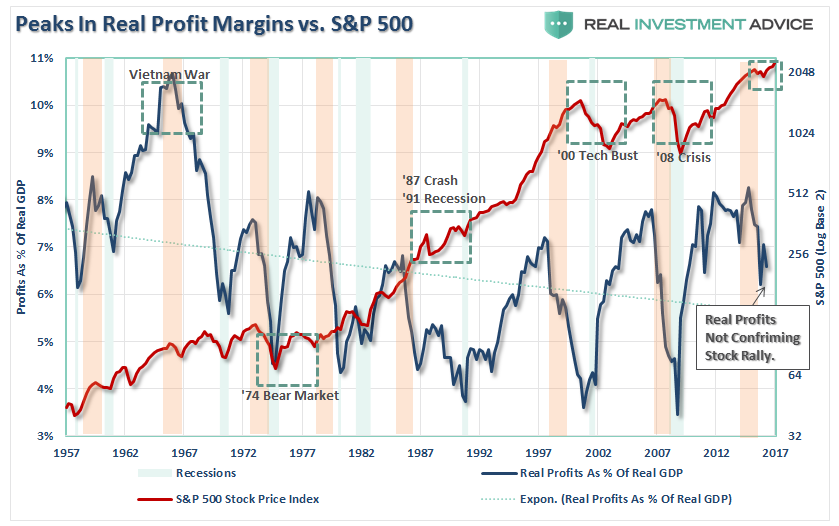
The light shaded green bars represent recessions while the light orange bars show peaks in corporate profits. Sure, this time could be different, but it just usually isn’t. The detachment of the stock market from underlying profitability suggests the reward for investors is grossly outweighed by the risk.
However, as has always been the case in the past, the markets can “remain irrational longer than logic would predict.”
As my friend and colleague, Jesse Felder, recently penned:
“But it’s even more troublesome than that because of the second attribute related to the “margin of safety” concept. Not only are we taking more risk by eliminating our margin for error we are also reducing our potential rate of return. In fact, the higher the price we pay the greater the risk we take AND the lower return we can achieve.
Considering the price-to-sales ratio for the median stock in the S&P 500 is higher than ever before and to a significant degree, you might say investors are taking the greatest amount of risk for the least amount of potential return in history. In other words, if there was ever an example of ‘reward-free risk’ this is it.”
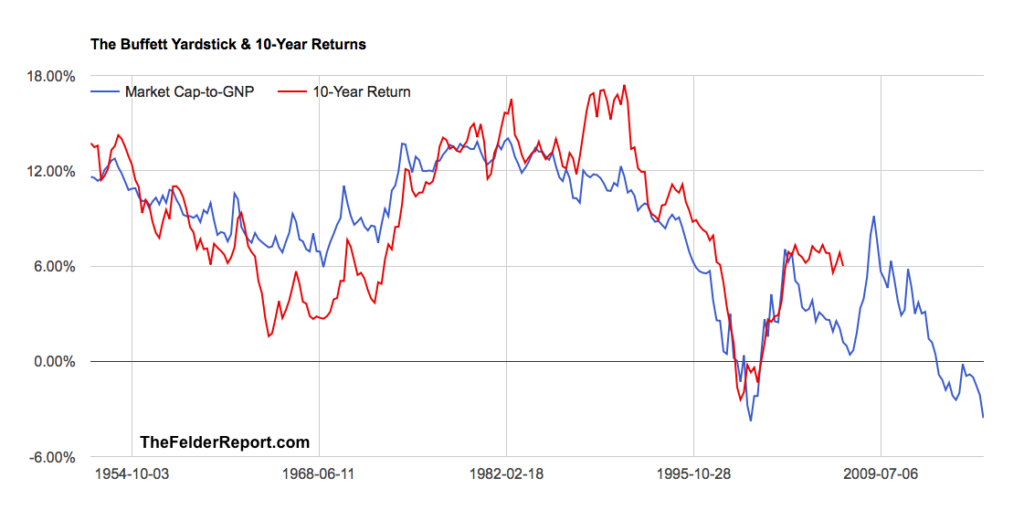
Currently, there has been NO CHANGE in the headlong bullish rush into the ethersphere. Therefore, we remain long, and even added some exposure following the breakout last week, in our portfolio allocations.
I agree with Jesse and remain convinced the longer-term reward is far outweighed by the risk. However, while we are maintaining our allocations to risk currently, we do so with the understanding everything could change very rapidly.
Caution is advised.
See you next week.
Market and Sector Analysis
Data Analysis Of The Market & Sectors For Traders
S&P 500 Tear Sheet
The “Tear Sheet” below is a “reference sheet” provide some historical context to markets, sectors, etc. and looking for deviations from historical extremes.
If you have any suggestions or additions you would like to see, send me an email.
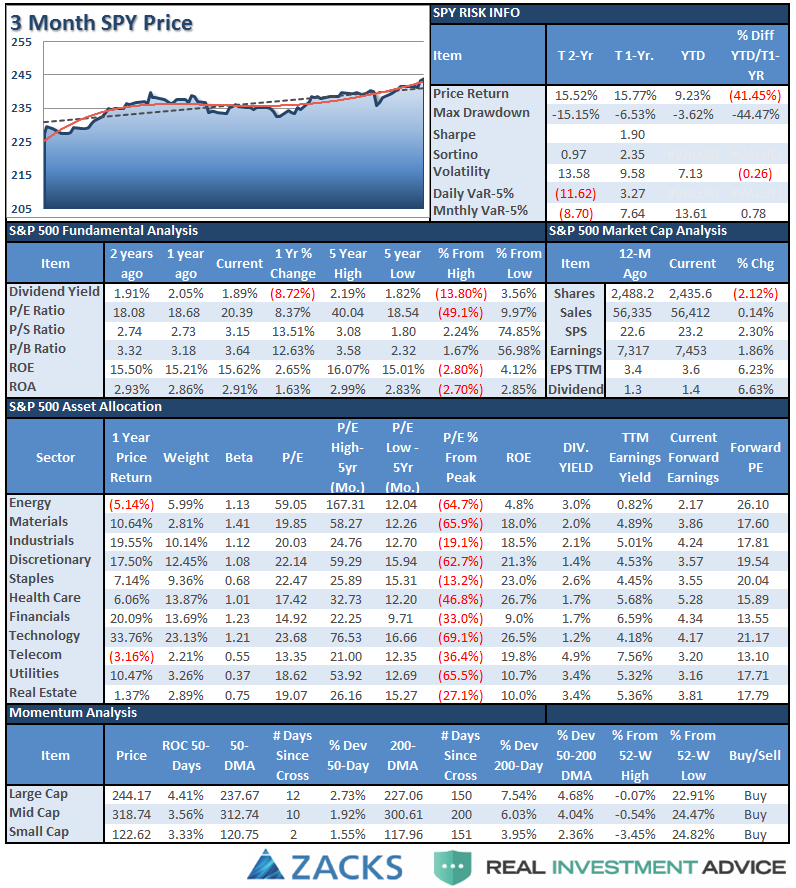
Performance Analysis
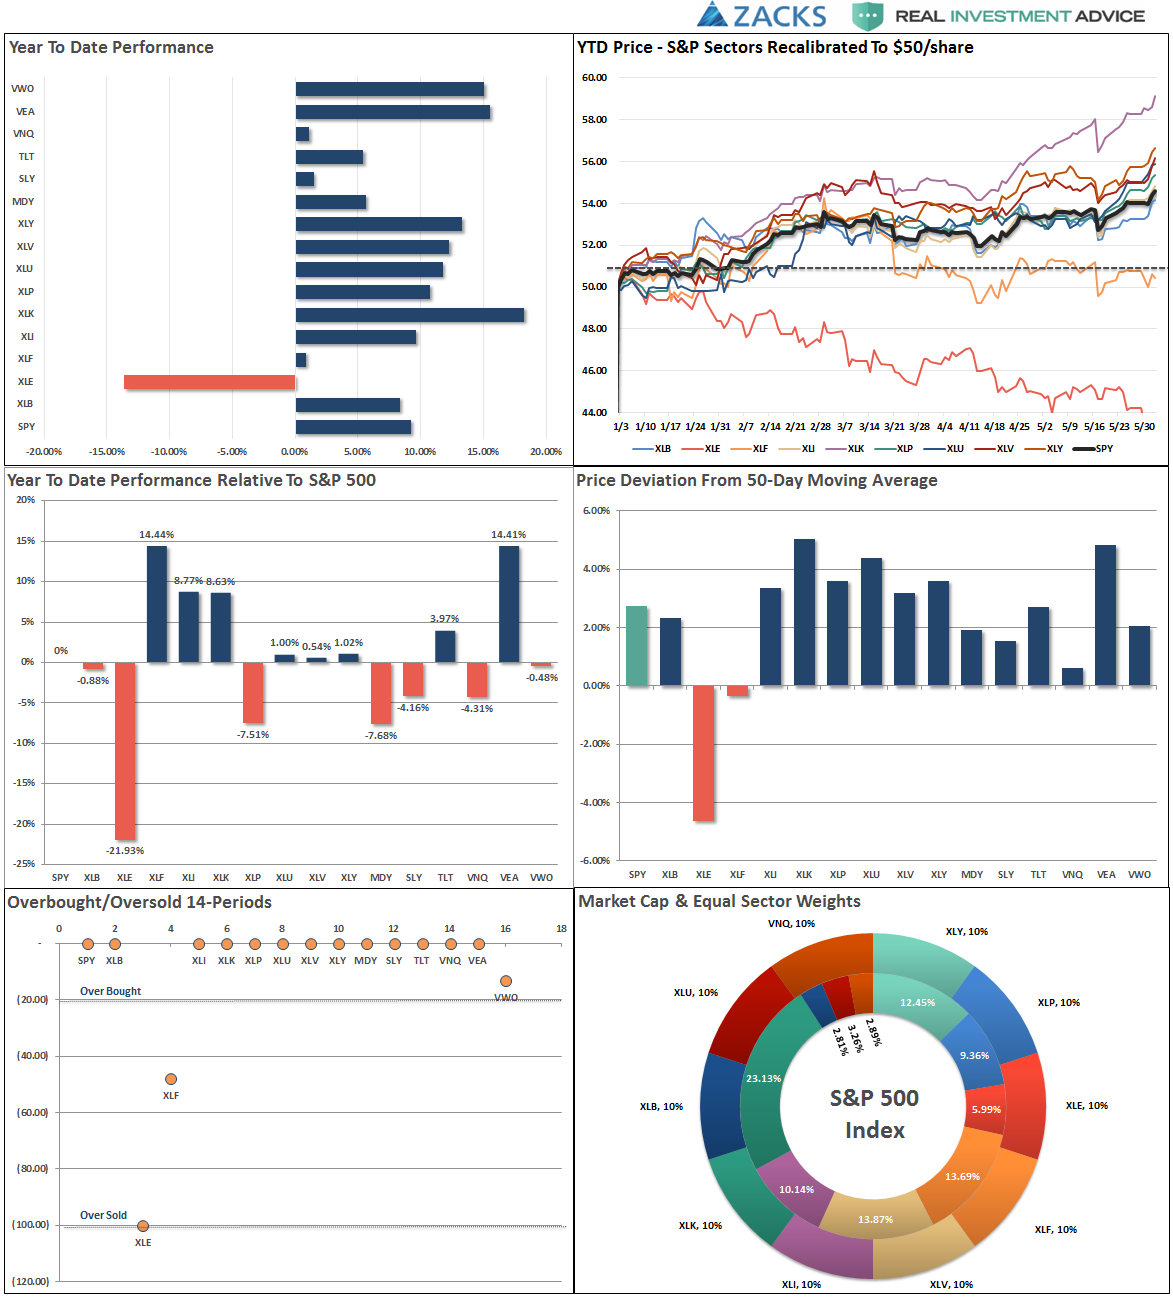
Do you find this chart useful? If you have any suggestions or additions you would like to see, send me an email.
Sector Analysis
With the markets breaking out of the two-month consolidation and hitting new highs this past week, as stated above, it keeps our portfolios allocated on the long side for now.
Last week, we did add modestly to our broader-based “core” holdings to participate with the breakout. However, as shown below, stops have been moved up and remain very tight. A reversal and failure of the breakout would NOT be surprising given the underlying weakness in the internal breadth and participation measures.
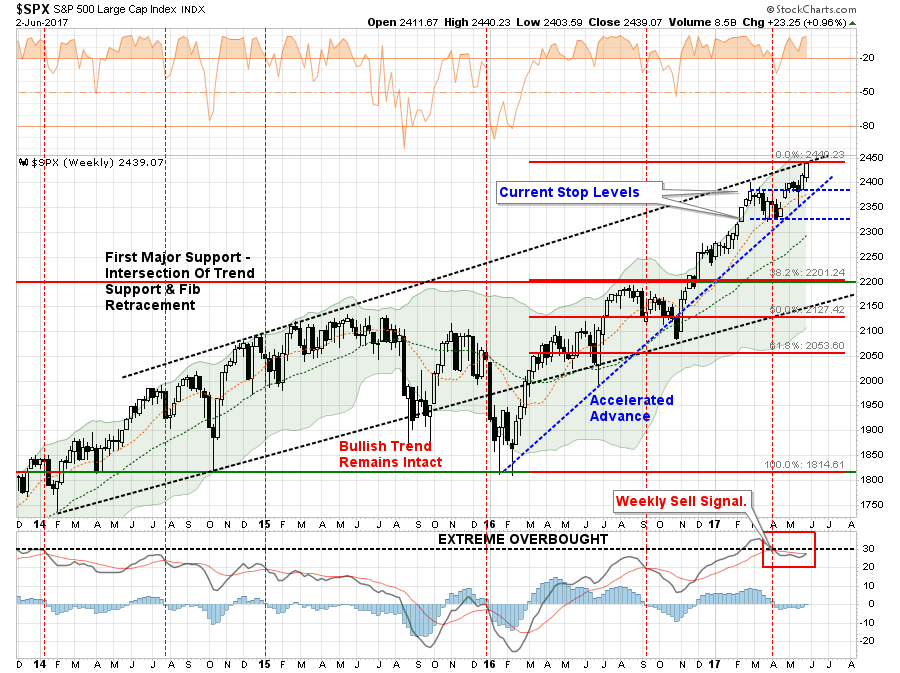
Importantly, notice that despite the “breakout to new highs,” it did NOT reverse the weekly “sell” signal due to the “volumeless” lift. This keeps us cautious at the moment until that signal reverses which would require a further rally next week.
Sector Review
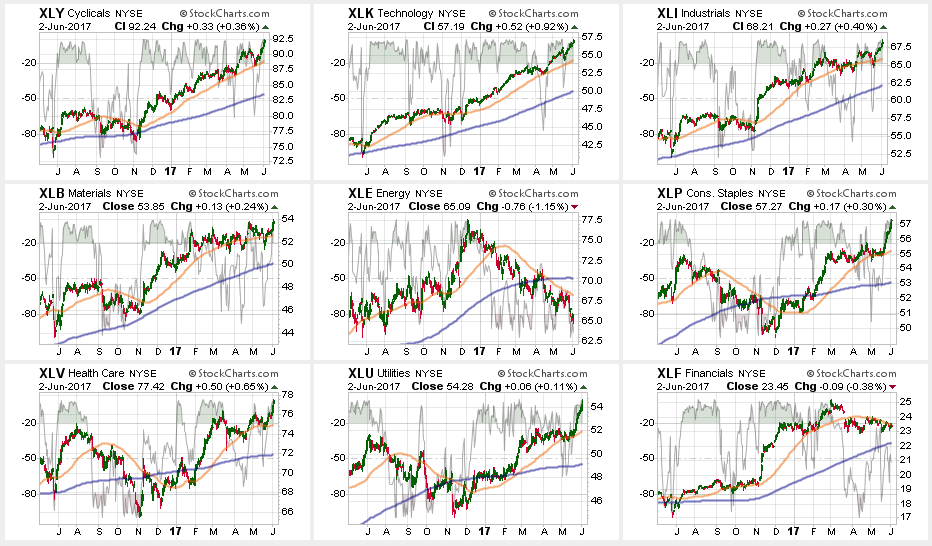
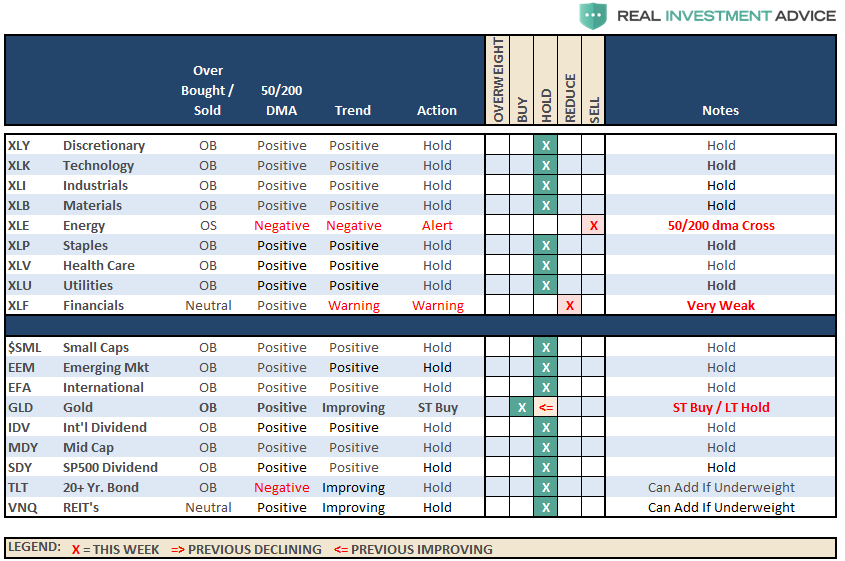
As discussed last week, this continues to be ONE CONFUSED MARKET as, once again, both DEFENSIVE and OFFENSIVE sectors rallied.
Discretionary, Technology, Staples, Utilities, Healthcare, Materials, and Industrials all rose last week. However, it was the sharp surge, again, in Staples and Utilities that stood out last week as traditionally defensive sectors took charge in a “bullish breakout.”
Financials remained exceptionally weak and keeps us cautious on these sectors at the current time.
Energy – Despite the OPEC meeting extending production cuts and the rally in oil prices, the sector remains in a negative downtrend. With a major sector sell signal, and the cross of the 50-dma below the 200-dma, we remain out of the space for the time being.
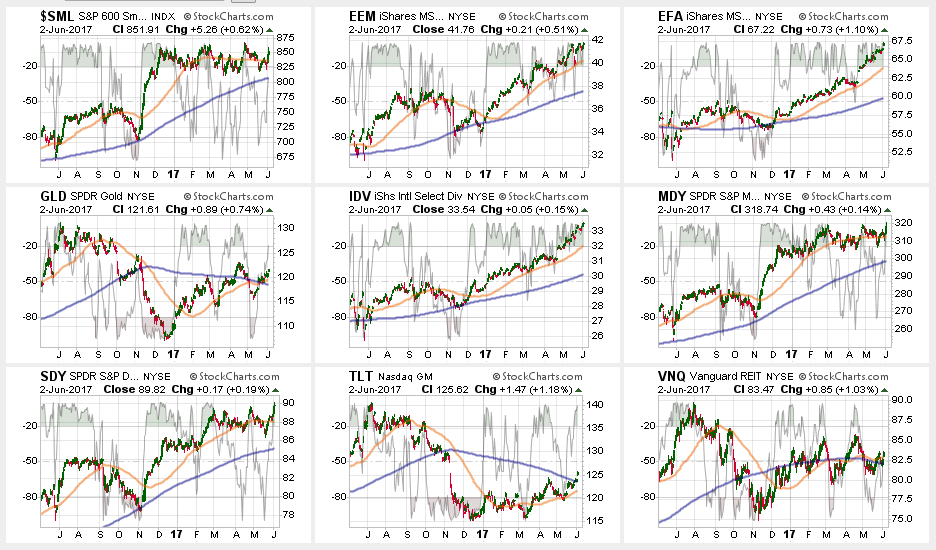
Small- and Mid-Cap stocks both broke their respective 50-dmas which had put these areas in on warning signs. However, last week, they regained their footing and pushed to new highs. However, on a relative basis, they are still underperforming the broad market which keeps the sectors on hold for now.
Emerging Markets and International Stocks continued their strength since their election lows as money continues to chase performance. There is a good bit of risk built into international stocks currently. We took profits a few weeks ago, but the recent extension suggests another round of rebalancing is likely wise. Take profits and rebalance sector weights but continue to hold these sectors but stop levels should be moved up to the 50-dma.
Gold – The rally in gold last week once again puts a potential trading opportunity in place on a “short-term” basis. For longer-term investors, like us, we still need a breakout of the long-term downtrend at $1300/oz to take on portfolio weightings. With the 50-dma now above the 200-dma, a position can be added with a stop at the 200-dma.
S&P Dividend Stocks (via iShares International Select Dividend (NYSE:IDV) and SPDR S&P Dividend (NYSE:SDY)) regained key support levels currently after briefly breaking below their 50-dma. Hold current positions but maintain stops at the recent lows.
Bonds and REITs continued their advances this week breaking solidly above resistance. With the 50-dma’s moving upward, these sectors can be added to selectively if underweight. However, this feeds back into the conundrum of the overall market, with both offensive and defensive sectors rallying, someone is going to be wrong. We will be watching these sectors for clues as to what happens next.
The table below shows thoughts on specific actions related to the current market environment.
(These are not recommendations or solicitations to take any action. This is for informational purposes only related to market extremes and contrarian positioning within portfolios. Use at your own risk and peril.)
Portfolio Update:
The bullish trend remains positive, which keeps us allocated on the long side of the market for now, but the weekly “sell signal” alert is not being dismissed.
As noted in last week’s missive:
“With the breakout we did increase our exposures a little bit, but I would like to see some continued strength into next week for confirmation before adding additional risk. This is particularly the case as we move into the seasonally weaker months of the year. We are maintaining stops at recent support levels on all sectors and at 2325 on the S&P 500.”
Given the move higher on Thursday and Friday, we will review portfolios on Monday for potential additions of “risk” exposure where needed. However, be mindful, that we do so with the very strict “sell” discipline in place in the event that something goes wrong.
