We face a modest week for economic data. While equity markets remain open, bonds will not trade on Monday (Columbus Day). Yom Kippur begins Tuesday at sundown and extends through Wednesday. The punditry, fueled by recent revelations as well as Sunday’s debate, will pounce on the election news. With the official start of earnings season on Tuesday and important reports by the end of the week, perhaps we can hope to see a serious market discussion before the week ends. I expect the punditry (eventually) to be asking:
Is the earnings recession over?
Last Week
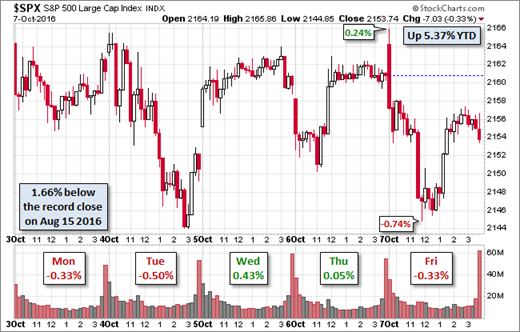
Last week’s news was very good, although there was little reaction in stocks.
Theme Recap
In my last WTWA, I predicted a shift from the gloomy outlook might be improving as some of the current worries were reduced. That was a good guess for an overall theme. There were quite a few “looking ahead” pieces both on TV and in print. The other news – the election, Brexit, and flash crash news was featured on some days, but it is difficult to plan for that.
The Story in One Chart
I always start my personal review of the week by looking at this great chart of the S&P 500 from Doug Short. Stocks had a flat week, and stayed within a range of about 1%. CNBC breathlessly noted the “triple digit moves” on several occasions. This is a great illustration of making something out of nothing.
Doug has a special knack for pulling together all of the relevant information. His charts save more than a thousand words! Read his entire post where he adds analysis grounded in data and several more charts providing long-term perspective.
Personal Note
The market is at a crucial point. It is not a time for sitting on the fence. Next weekend Mrs. OldProf (hometown Green Bay) and I are headed to visit her family in Wisconsin, so maybe I should say not a time for being a “deer in the headlights.” I am planning to write next week, but I can’t be sure. Meanwhile, we have a family fight brewing for tomorrow night, with the Presidential debate at the same time as a football game.
Because of the importance, I put extra effort into this week’s WTWA edition, and I hope it is helpful. People are sometimes bashful about reaching out to us with questions. Please feel free to get in touch via main at newarc dot com.
The News
Each week I break down events into good and bad. Often there is an “ugly” and on rare occasion something really good. My working definition of “good” has two components. The news must be market friendly and better than expectations. I avoid using my personal preferences in evaluating news – and you should, too!
The Good
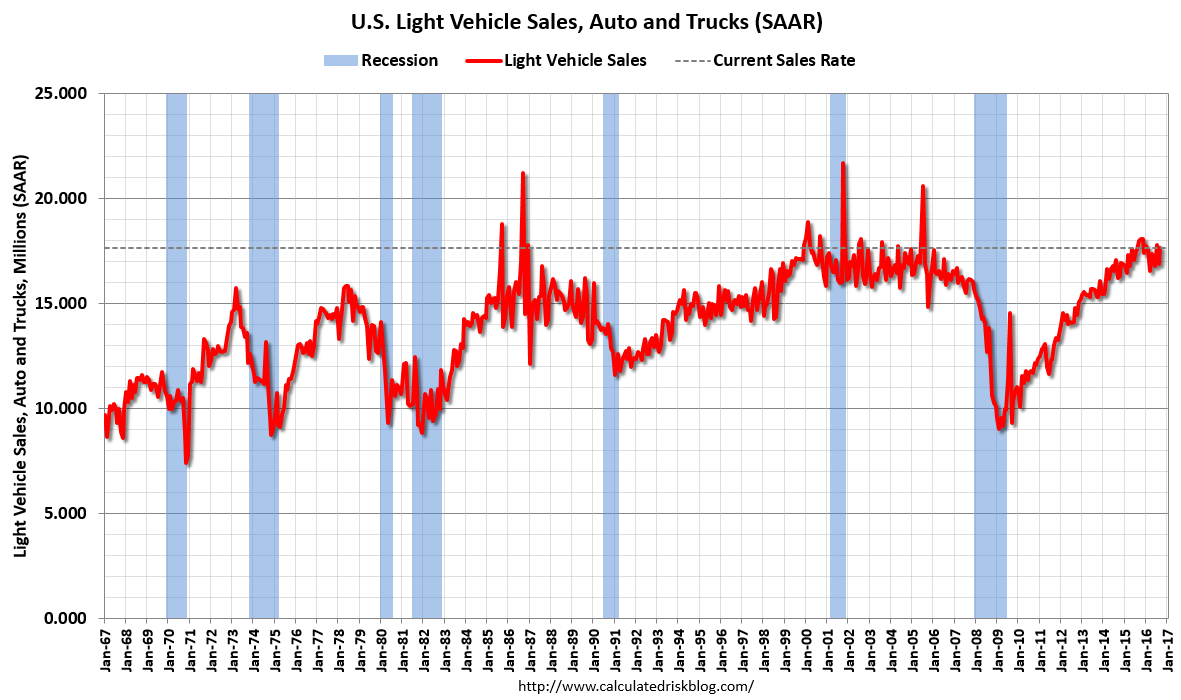
- Auto sales beat expectations, up 4.7% to an annualized rate of 17.8M. Calculated Risk puts this into perspective.
- High-frequency indicators remain strong. New Deal Democrat does an excellent weekly update, which I follow regularly. His latest report shows the strength in both long-leading and short-term indicators. The concurrent indicators are mixed. Reading this post helps to understand why many using less data are more confused about the market.
- A shortage of truck drivers? A $5000 bonus is available. Another among the many small, unremarked indicators which I follow. (Tyler Cowen)
- Home prices up 6.2% over last year according to the CoreLogic index. (GEI)
- Employment reports were generally positive.
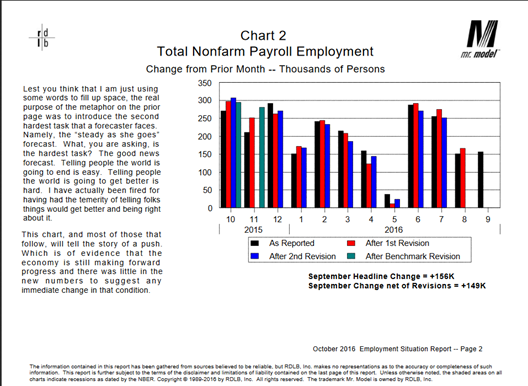
- The headline payroll number was slightly positive, including revisions. Bob Dieli’s excellent monthly employment report captures the conclusion widely shared by other top economists – “steady as she goes.”
- Jobless claims dropped to 249K.
- Labor participation increased, while the unemployment rate also increased from 4.9% to 5%.
- The work week moved higher.
- Best of all, hourly earnings increased 0.2% over August and 2.6% year-over-year.
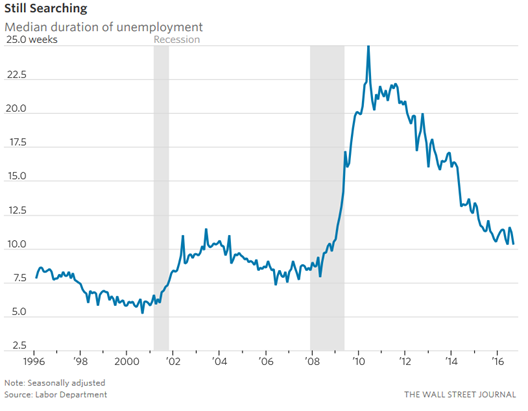
- The median duration of unemployment is down to 10.3 weeks. (WSJ)
- ISM Non-Manufacturing made a big jump to 57.1, almost 6 points higher than last month and four points higher than expectations.
The Bad
- Construction spending fell 0.7%.
- ADP Private Employment gained only 154K, down from 175K in the prior month and missing expectations. This was worse than the “official” private employment estimate.
- Commercial real estate index stumbles. Calculated Risk tracks this and provides a good update.
The Ugly
My original plan was the poll showing that over 40% of potential voters could not name the Vice-Presidential candidates. With the Presidential campaign in a descending spiral and a violent hurricane, my original idea seems lame. There is plenty of ugly news. We can all hope for a better week ahead.
The Silver Bullet
I occasionally give the Silver Bullet award to someone who takes up an unpopular or thankless cause, doing the real work to demonstrate the facts. This week’s award goes to Justin Lahart of the Wall Street Journal for his article, Shiller’s Powerful Market Indicator Is Sending a False Signal About Stocks This Time. The article has an excellent discussion of alternative methodologies, including an alternative profit measure that matched the results quite well until 2008. The Shiller CAPE is widely cited as a justification for not owning stocks, but both Prof. Shiller and his co-developer Prof. Harvey do not use it that way themselves. Here is the key conclusion, drawing upon the work of Prof Damodaran the leading expert on corporate valuation:
For New York University finance professor Aswath Damodaran, this is the real sticking point. He set up a spreadsheet to see if there was a way that using the CAPE could boost returns. When the CAPE was high, it put more money into Treasurys and cash, and when it was low it put more into stocks.
He fiddled with it, allowing for different overvaluation and undervaluation thresholds, changing target allocations. And over the past 50-odd years, he couldn’t find a single way he could make CAPE beat a simple buy-and-hold strategy. In the end, he doesn’t think it represents an improvement over using conventional PEs to value stocks.
“This is one of the most oversold, overhyped metrics I’ve ever seen,” says Mr. Damodaran.
Mr. Shiller agrees that the CAPE can’t be used as a market-timing tool, per se. Rather, he thinks that investors should tilt their portfolios away from individual stocks that have high CAPEs. But he says he isn’t ready to modify his CAPE for judging the overall market.
Attacking the most popular excuse for missing the rally is not a popular position. If only more journalists would step up with this kind of investigation.
The Week Ahead
We would all like to know the direction of the market in advance. Good luck with that! Second best is planning what to look for and how to react. That is the purpose of considering possible themes for the week ahead. You can make your own predictions in the comments.
The Calendar
We have a modest week for economic data, with some holiday effects included. While I watch everything on the calendar, you do not need to! Check out WTWA to focus on what is really important – and ignore the noise.
The “A” List
- FOMC minutes (W). Unlikely to provide fresh news, but will still be watched closely.
- Michigan sentiment (F). Good read on current employment and spending.
- Retail sales (F). Rebound in store?
- Initial claims (Th). The best concurrent indicator for employment trends.
The “B” List
- PPI (F). Not much is expected. This will not be important until we have a few “hot” months.
- Business inventories (F). August data, but relevant for GDP calculations.
- Crude inventories (W). Often has a significant impact on oil markets, a focal point for traders of everything.
Other news includes the Presidential debate on Sunday night and the start of earnings season. And of course, near-daily servings of FedSpeak.
Next Week’s Theme
The revelations surrounding the Presidential election campaign are going to dominate the news cycle. Sunday night’s debate will probably fan the flames. With bonds not trading on Monday, stocks will not have that cue. It is possible that these stories will persist, but there is a more important matter: Corporate earnings.
This earnings season could well be a turning point after a long “earnings recession” and a sluggish economy. Stocks have been resilient in the face of bad headlines and seasonal headwinds. Could stronger earnings be the spark for an upside breakout? I expect the pundits to be wondering:
Is this the end of the earnings recession?
There are three basic positions.
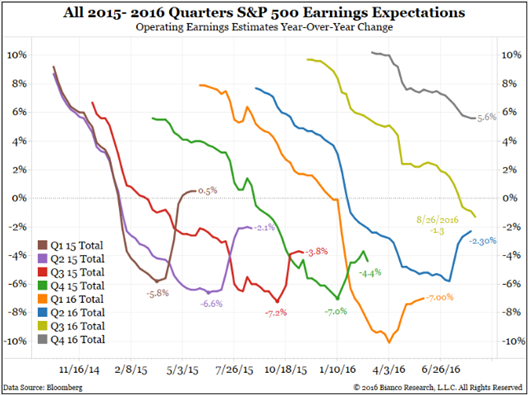
- Negative. Jim Bianco notes the declining estimates for the quarter and sees parallels to 1987. To be fair, he represents many taking this position. Here is his evidence of the plunging estimates.
- Eddy Elfenbein takes a neutral position, noting the trend toward lower earnings. He notes that the picture is much better if you exclude energy.
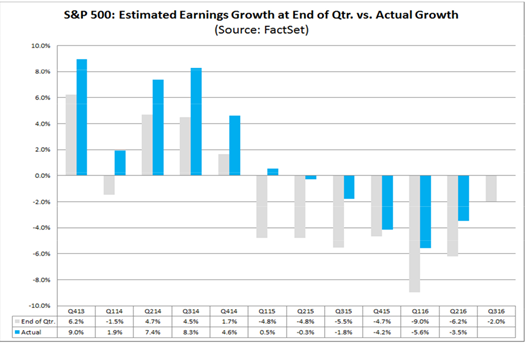
- Brian Gilmartin and FactSet see a possible inflection point. Brian has been the first on this story. Here is his latest analysis. While he is always a good read, it is especially important during earnings season. He provides a lot of analysis on specific stocks. FactSet explains that earnings estimate fall before the season begins, but the final returns beat estimates. Their expectation is that the final reports will break the streak of lower earnings.
The Bianco report seems strange. Surely he knows about the lowered bar and beating expectations. His squiggle chart starts in irrelevant territory and excludes the tail that is obvious in every other quarter. It is difficult for most people to see, exhibiting what I call a high coefficient of obfuscation (TM OldProf). Let us see what really happens. Like 1987? Really?
As always, I’ll have a few ideas of my own in the conclusion.
Quant Corner
We follow some regular great sources and also the best insights from each week.
Risk Analysis
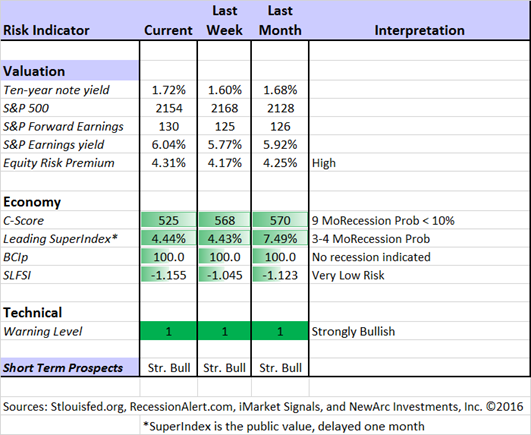
Whether you are a trader or an investor, you need to understand risk. Think first about your risk. Only then should you consider possible rewards. I monitor many quantitative reports and highlight the best methods in this weekly update.
The Indicator Snapshot
The Featured Sources:
Bob Dieli: The “C Score” which is a weekly estimate of his Enhanced Aggregate Spread (the most accurate real-time recession forecasting method over the last few decades). His subscribers get Monthly reports including both an economic overview of the economy and employment.
Holmes: Our cautious and clever watchdog, who sniffs out opportunity like a great detective, but emphasizes guarding assets.
Brian Gilmartin: Analysis of expected earnings for the overall market as well as coverage of many individual companies.
Doug Short: The Big Four Update, the World Markets Weekend Update (and much more).
RecessionAlert: Many strong quantitative indicators for both economic and market analysis. While we feature his recession analysis, Dwaine also has a number of interesting approaches to asset allocation.
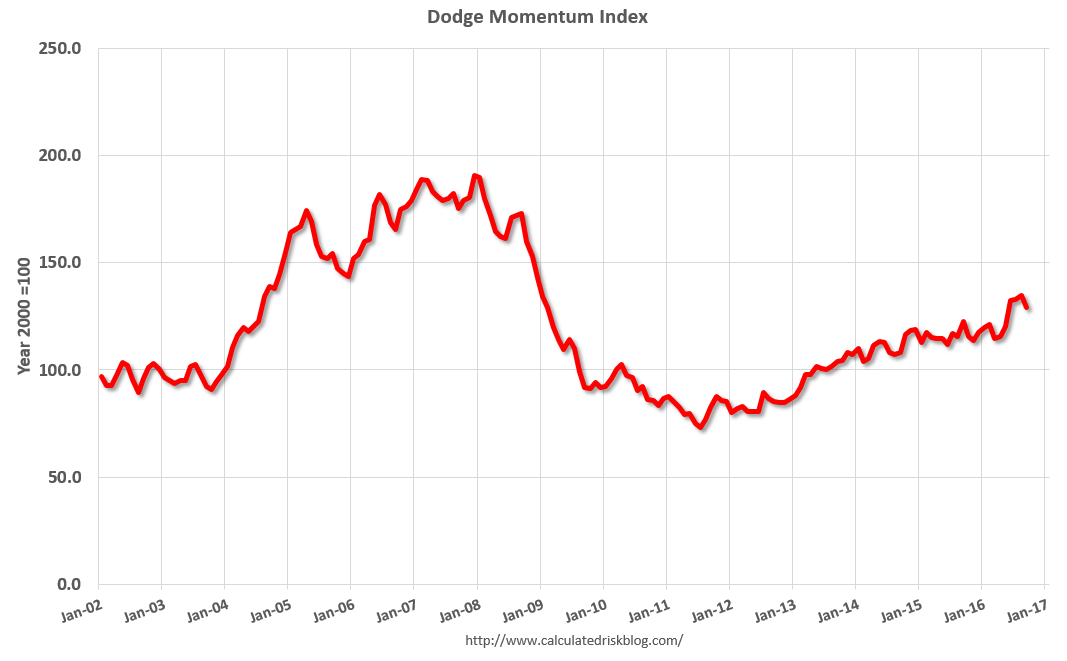
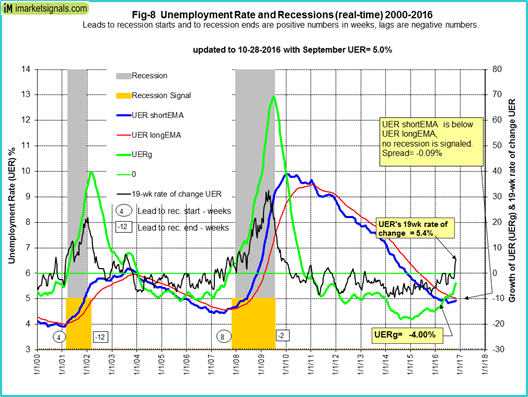
Georg Vrba: The Business Cycle Indicator, and much more. Check out his site for an array of interesting methods. Georg regularly analyzes Bob Dieli’s enhanced aggregate spread, considering when it might first give a recession signal. Georg thinks it is still a year away. It is interesting to watch this approach along with our weekly monitoring of the C-Score. This week Georg also updates his unemployment-based indicator, still not signaling a recession as you can see from the chart below.
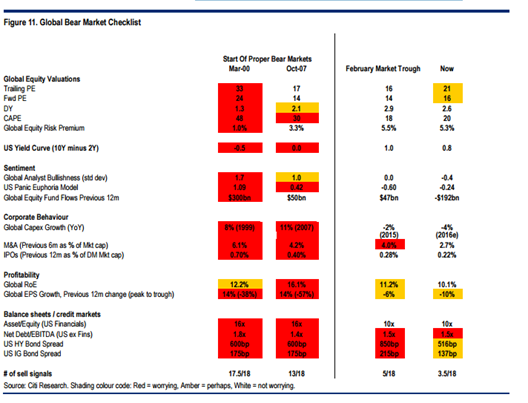
Citi does not see a recession either. (HT The Daily Shot)
How to Use WTWA (important for new readers)
In this series I share my preparation for the coming week. I write each post as if I were speaking directly to one of my clients. Most readers can just “listen in.” If you are unhappy with your current investment approach, we will be happy to talk with you. I start with a specific assessment of your personal situation. There is no rush. Each client is different, so I have six different programs ranging from very conservative bond ladders to very aggressive trading programs. A key question:
Are you preserving wealth, or like most of us, do you need to create more wealth?
My objective is to help all readers, so I provide a number of free resources. Just write to info at newarc dot com. We will send whatever you request. We never share your email address with others, and send only what you seek. (Like you, we hate spam!) Free reports include the following:
- Understanding Risk – what we all should know.
- Income investing – better yield than the standard dividend portfolio, and also less risk.
- Holmes and friends – the top artificial intelligence techniques in action.
- Why it is a great time to own for Value Stocks – finding cheap stocks based on long-term earnings.
You can also check out my website for Tips for Individual Investors, and a discussion of the biggest market fears. (I welcome questions on this subject. What scares you?)
Best Advice for the Week Ahead
The right move often depends on your time horizon. Are you a trader or an investor?
Insight for Traders
We consider both our models and also the best advice from sources we follow.
Felix and Holmes
We continue with a strongly bullish market forecast. Felix is fully invested. Oscar holds several aggressive sectors. The more cautious Holmes also remains fully invested. They now have a regular Thursday night discussion, which they call the “Stock Exchange.” This is the place to get some ideas from the best technical analysis – and you can ask questions!
Top Trading Advice
Brett Steenbarger (as I guessed a few weeks ago) is doing another book and will be taking a sabbatical for the month. He provides us two more great posts — an update on his trading model and an interesting measure of “pure sentiment.”
Adam H. Grimes also provokes thought with a post about losing. Few understand that it is part of winning.
Insight for Investors
Investors have a longer time horizon. The best moves frequently involve taking advantage of trading volatility!
Best of the Week
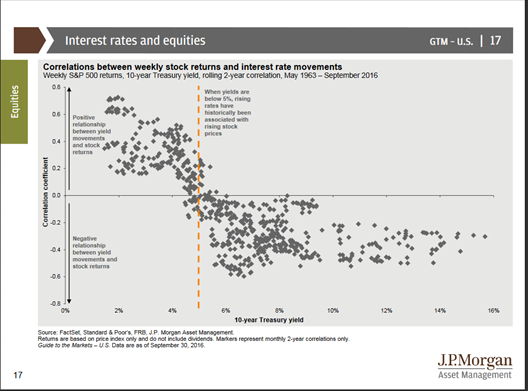
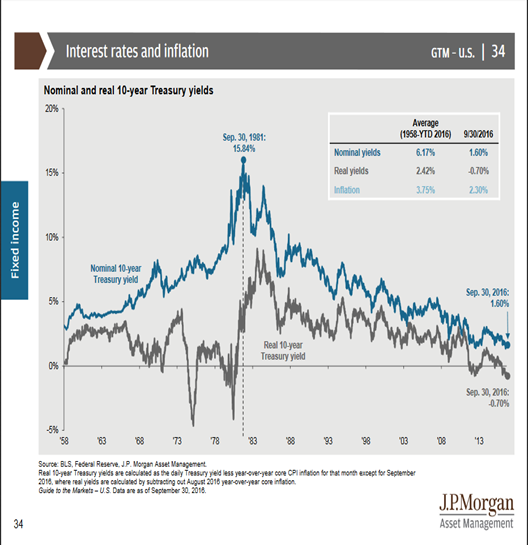
If I had to pick a single most important source for investors to read this week it would be JP Morgan’s wonderful quarterly chart book. Budget fifteen or twenty minutes to page through this carefully. My guess is that you will lose track of time as you enjoy the objective presentation of data. While it is difficult to find favorites, here are two that can have the biggest payoff for investors.
First, do not expect stocks to fall as rates move higher! As long as the starting yield is low, increased rates are associated with better earnings, a better economy, and higher stock prices.
And second, interest rates at the long end are not all about the Fed. Inflation is the key for the ten-year note. The Fed controls the short end. Look at the evidence.
Stock Ideas
When you read Chuck Carnevale’s articles, prepare for a stock idea combined with a great lesson. I am amazed at how well he does this, week after week. Following up on his analysis of Consolidated Edison (NYSE:ED), he uses the same techniques on Johnson & Johnson (NYSE:JNJ). Even if you are not one of the many investors who own these stocks, you will learn a great deal from Chuck’s process.
Our newest trading model, Holmes, has joined our other models in a weekly market discussion. Each one has a different “personality” and I get to be the human doing fundamental analysis. We have an enjoyable discussion every week, with four or five specific ideas that we are also buying. This week Holmes likes Air Products and Chemicals (NYSE:APD). Check out the post to see the other picks, ask questions, and choose your favorite model.
While we cannot verify the suitability of specific stocks for everyone who is a reader, the ideas have worked well so far. My hope is that it will be a good starting point for your own research. Holmes may exit a position at any time. If you want more information about the exits, just sign up via holmes at newarc dot com. You will get an email update whenever we sell an announced position.
Tech assumes the sector leadership. Jim Picerno has the story.
Energy seems to have stabilized in the range I identified a couple of months ago. Some believe the OPEC deal has provided a floor. This is important as a place for picking up a few beaten-down names as well as the implications for the overall market. I am doing more research on this topic.
Personal Finance
Professional investors and traders have been making Abnormal Returns a daily stop for over ten years. The average investor should make time (even if not able to read AR every day as I do) for a weekly trip on Wednesday. Tadas always has first-rate links for investors in his weekly special edition. There are always several great choices worth reading. My personal favorite this week is Jonathan Clements’ (MarketWatch) warning about seven key mistakes. Read them all, but here is a sample:
1. Stocks are risky.
Reality: Sure, they’re risky. But the implication — that other investments are less risky — simply isn’t correct. Bonds and cash investments may not offer the rollercoaster ride that you get with stocks. But they leave you vulnerable to inflation, which is arguably an even bigger threat.
Gil Weinreich had another superb post in his series that explores the intersection between clients and advisors. He includes a description of the qualities that an advisor needs:
The ability to listen, question and analyze; professional knowledge and core beliefs; knowledge of what one doesn’t know, or what is unknowable; a positive attitude; peer relationships that would allow the advisor to test the value of his ideas or seek needed advisor; a propensity to share knowledge with others; discipline; sense of responsibility; and sensitivity to others’ pain.
This may seem simple and obvious, but it is very strong and helpful. Many investors ask the wrong questions and many advisors just try to maximize fees with high-profit products.
Morgan Housel has a similar message, explaining why good advice is important.
Watch out for…
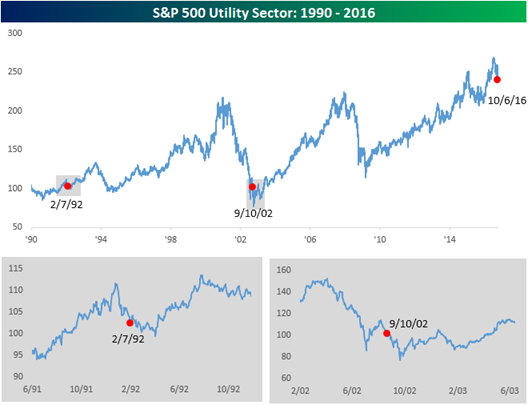
Utility stocks. Bespoke shows how rapidly these can fall as interest rates rise.
Dana Lyons agrees. Check out his post to see why this sector is at a crucial point.
And FMD Capital on the “fear trade” falling apart.
Final Thoughts
To many investors it may seem like nothing is happening. If you follow our indicators you will see significant changes. Stocks are both safer and more promising and there are signs of sector rotation. What do you think will happen when those invested in bond funds learn that the values do not always rise?
If the “earnings recession” ends, that will accelerate the current change in tone. We all know that seasonality improves as the year nears its end, but no one has a good explanation. Here is my hypothesis:
Market participants start thinking in terms of a multiple of the next year’s earnings!
I know it seems silly, but just watch those commenting or writing. You will see it. They will begin to describe stocks of interest in terms of multiples of 2017 earnings.
They will not mention Dr. Shiller’s method of looking at historical earnings. They certainly will not discuss Tobin’s Q. (Imagine: Well, Joe, we analyzed the replacement value for Amazon (NASDAQ:AMZN) and found it to be vastly overvalued. We could replace their buildings, their fleet, and their workforce for 15% of their market cap). Or Google (NASDAQ:GOOGL), or Facebook (NASDAQ:FB), or IBM (NYSE:IBM), or Accenture, or any non-manufacturing company. I have never seen Tobin’s Q cited in the context of valuing a specific stock.
My own method is a constant revision of estimates using a slightly modified CAPE approach to get my own expected multiple. Since I am always looking twelve months ahead, the calendar changes are not important. This is why tracking forward earnings is so important. In particular, we have an opportunity to look for stocks with improving outlooks matching the improving economy.
We are “front-running” the pack in a completely legal fashion.

