Introduction
Much of what I write about is related to the importance of valuation in one way or another. I do this, because I am a fervent believer that one of the most important metrics that investors should be considering before investing in a stock is the relative valuation of the shares they are purchasing.
To summarize what I’m saying, if they are interested in investing in a company and discover that the current market valuation is very high, I contend they should either wait or look elsewhere for better valuation. In contrast, if valuation is fair or sound, then I contend they could comfortably go ahead and make the investment. Finally, if the valuation is significantly undervalued, I contend they might consider investing aggressively.
However, before they even get to that step, they should be investigating a company that meets their specific goals, objectives and risk tolerances. This is vitally important, because valuation is not the final say in the rate of return they can expect from their investment in a given company. Instead, valuation is primarily a measurement of soundness or risk.
Although it is an important component of the possible rate of return they might achieve, it is not the primary driver. Once sound valuation is identified, from there the primary driver of future returns will be the growth rate of the earnings and dividends (if any) that the company generates going forward. Investing when valuation is sound empowers the investor to safely earn a rate of return that is commensurate with the operating results that the company they invest in produces in future time.
With this article, I intend to demonstrate the importance of fair valuation and how it mitigates risk, and how it can be utilized to assist in evaluating the future rate of return you can expect from investing in a given stock. This is consistent with the importance and utilization of the P/E ratio as a measurement of soundness or fair value. In my experience, both the relevance of fair valuation and the importance of the P/E ratio are grossly misunderstood by many. With this article, I intend to bring some enlightenment and better understanding of both.
Choose Common Stock Investments That Are Appropriate to Meet Your Goals or Objectives
There are many types of common stock investments available to investors. In other words, common stocks come in all sizes and shapes with each possessing their own individual characteristics. There are companies (stocks) that grow at very high rates and others that grow at moderate rates and some that grow very slowly - and everything in between.
Consequently, if you’re an investor looking for maximum capital appreciation, a company with a slow rate of earnings growth will not fit your needs. In contrast, if dividend income is what’s most important to you, then you want to look for companies with consistent records of paying a dividend and/or growing that dividend over time. Additionally, you also have the consideration of yield in combination with growth. Some stocks offer high-yield and low growth, some offer moderate yield and moderate growth, and some even offer high growth with very low yield. Of course, there is also everything in between.
The trick is to understand the characteristics of the common stocks you are considering, and most importantly, making sure that they are suitable to meet your own specific needs, goals and objectives. In other words, I believe it’s imperative that investors recognize what the potential capability and specific opportunities that any stock they are considering might be capable of giving them. Not all stocks are the same, and not all stocks fit in every portfolio.
However, in order to choose the common stocks to meet your own goals and needs, you also have to be realistic and understand a couple of important facts. For starters, you cannot solely depend on a company’s historical track record of growth. You must be cognizant of the fact that earnings growth rates change, and as a general statement, the bigger the company gets the harder it is for it to continue growing at high or above-average rates.
This last statement is conceptual in that there can also be companies that are growing slowly, but can be expected to continue growing at historical rates. In other words, what I am suggesting is that you understand as comprehensively as possible what the companies you are considering are capable of generating on an operating basis going forward.
Although you cannot invest in the past, you can learn from it. Moreover, it also pays to be realistic and even conservative with your expectations of the potential of any company you are examining. Again, this is important because you can only invest in the future potential of any common stock you are considering. Whether your expectations turn out to be accurate or not, your total rate of return will end up being a function of the actual operating results the company produces in conjunction with the valuation you initially paid to purchase those results.
Many times in the past I have stated that measuring performance without simultaneously measuring valuation is a job half done. However, I would like to modify that statement a little bit in order to make it more relevant. Measuring performance without simultaneously measuring valuation in conjunction with growth potential is a job half done.
I believe that when an investor understands the importance of valuation, and possesses a reasonable expectation of the growth potential of the companies they own, they are empowered to make safer, better and more profitable long-term decisions. I call it investing with your eyes wide open.
In order to illustrate these principles more clearly, I offer the following examples illustrating how growth and valuation impacts long-term rates of return. However, I am not capable of presenting every possible situation or option. Therefore, I will only be offering a few disparate examples in order to illustrate as clearly as possible the principles underlying the primary thesis of this article.
Utility Stocks: Slow Growth Above-Average Yield
Most utility stocks could be described as consistent, low growth businesses with high payout ratios offering above-average current yield. Consequently, it would not make sense to invest in a utility stock with the expectation of achieving a high rate of capital appreciation. The characteristics of utility stocks simply do not present that opportunity. Instead, utility stocks can be included in a portfolio when above-average current yield is a priority. However, it would also be unrealistic to expect a high rate of dividend growth. In the long run, a utility stock’s dividend is likely to grow consistent with and in conjunction with its earnings growth rate.
In a similar fashion, this would also be true of investing in bonds. Investors do not invest in bonds with the idea that they might double, triple or quadruple their money. Instead, bonds are typically invested in when the investor is looking for safety in the form of return of capital, not return on capital, and predictable yield. Of course, today yield on bonds are low. Consequently, utility stocks could be considered as bond alternatives. However, they do not possess the guaranteed return of principal offered by the bond, but they do offer reasonable yields with modest growth and relative consistency.
(Consolidated Edison) Inc: a Classic Utility Stock Example
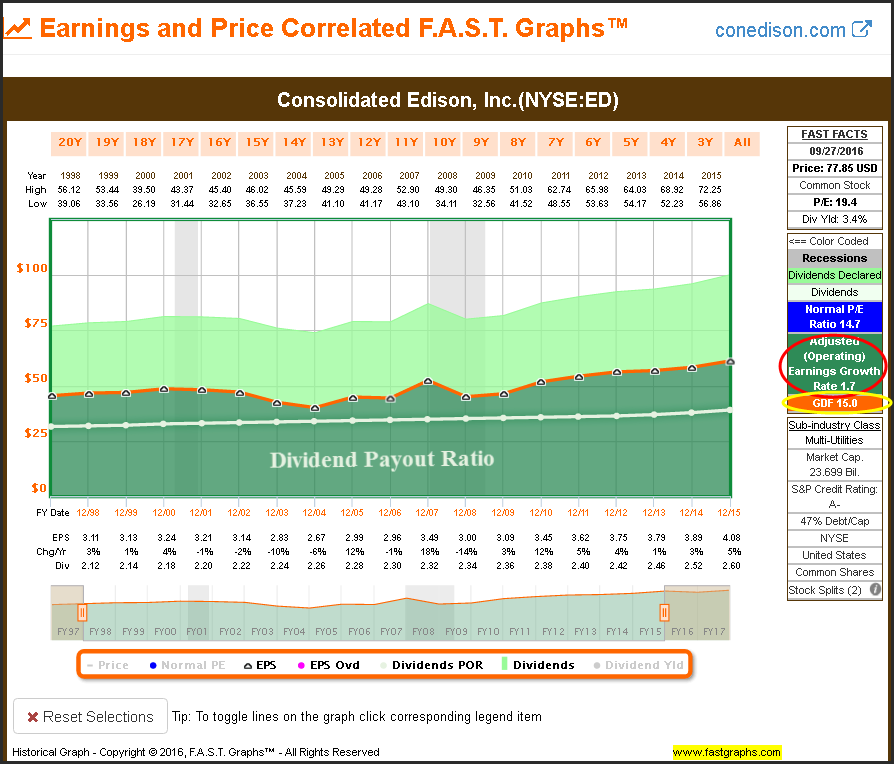
I chose Consolidated Edison (NYSE:ED) as a stereotypical example of a utility stock to represent the characteristics utility stocks typically offer. As usual, I will turn to F.A.S.T. Graphs™ the fundamentals analyzer software tool in order to illustrate my points. With my initial graph, I present only the earnings and dividends that Consolidated Edison has generated over the timeframe 1998 to its last completed fiscal year 2015.
The orange line on the graph represents a P/E ratio of 15 and is offered as a fair valuation reference. In other words, at this point I’m suggesting that a P/E ratio of 15 on Consolidated Edison represents soundness or fair value. However, as previously indicated, fair valuation only tells part of the story. The second aspect of the orange line that is critical to understand and recognize is the slope of the line. By slope, I am referring to the average earnings growth rate that that orange line represents in this example.
The color-coded FAST FACTS to the right of the graph lists the 15 P/E ratio in the orange section, and the dark green section lists the average earnings growth rate (slope of the line) of only 1.7%. The dark green shaded area represents a mountain chart of the company’s earnings, and the white line plots dividends with the area below it representing the company’s dividend payout ratio. The light green shaded area on top of the orange line represents dividends after they’ve been paid out to shareholders. Note: these representations will apply to all subsequent graphs to include other companies; however, the numbers will be different with different examples.
This next graph adds monthly closing stock prices (the black line), and here is where the valuation reference discussed earlier becomes important. When the price is touching the orange line (P/E ratio 15) fair valuation is implied. When the price is below the orange line undervaluation is indicated, and when the price is above the orange line overvaluation is indicated.
There are a couple of important observations that I would ask the reader to evaluate. First and foremost, note how the price tends to correlate to and with the fair valuation reference. Stated more simply, where earnings go price has followed. However, there are times when the two become disconnected which represent the overvaluation or undervaluation situations.
The next, but equally as important consideration, is to note that over the long run the price has not appreciated very much because neither have the earnings. The average earnings growth rate of a mere 1.7% clearly has limited the long-term capital appreciation potential that Consolidated Edison has provided shareholders.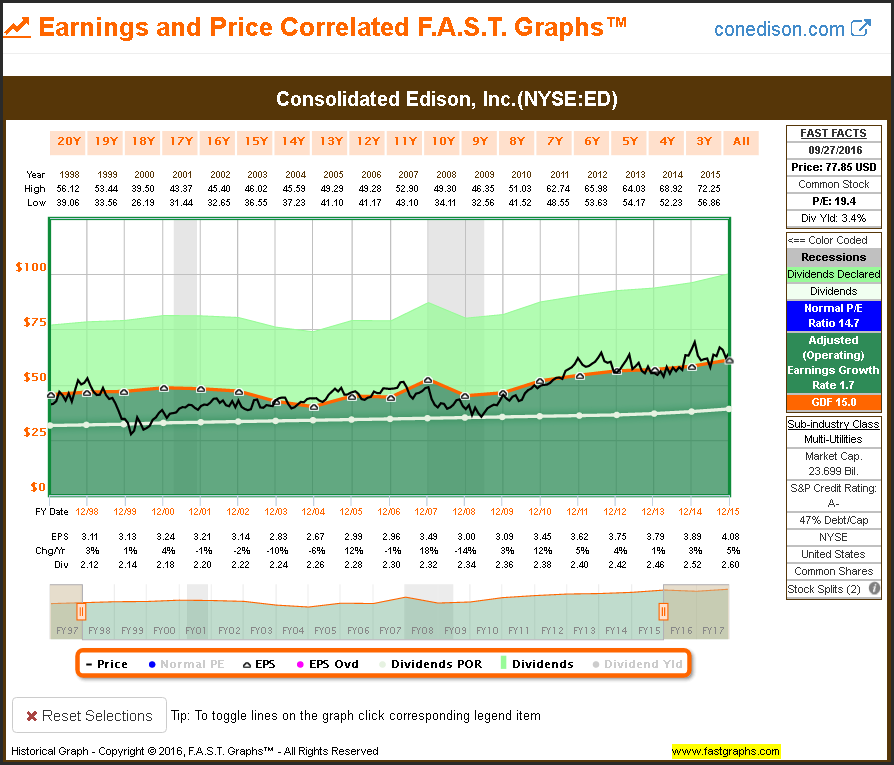
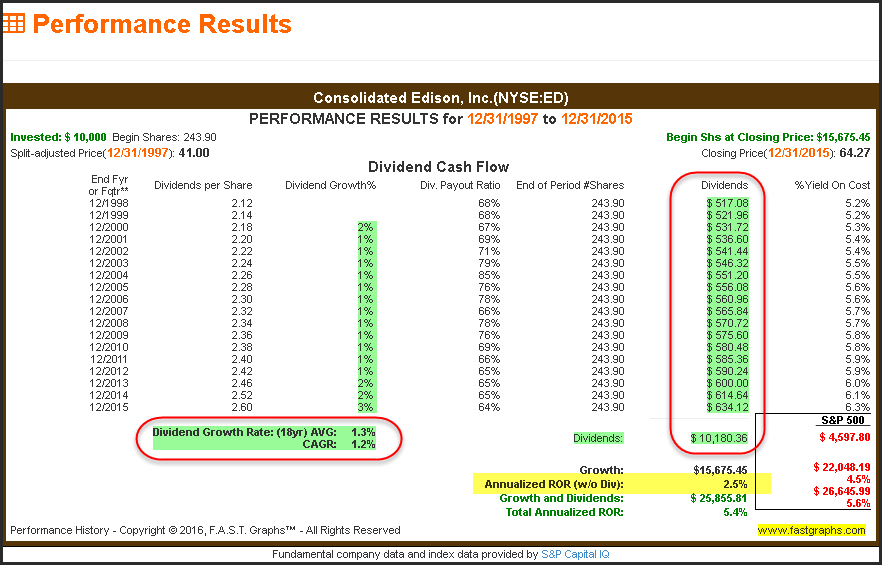
These principles will hopefully become clearer when you examine the performance report associated with the above graph. Capital appreciation (Annualized ROR) has only averaged 2.5% annually (see yellow highlight), which is highly correlated to the company’s earnings growth rate. It is only slightly higher because initial valuation had price slightly below the orange line, and ending valuation had price only slightly above it.
The cumulative dividends illustrate the value of investing in a slow growth utility stock, if dividend income is your goal. However, the reader should also note that the average dividend growth rate has only been 1.3% and the compound average growth rate (CAGR) of 1.2% both correlate closely to the company’s earnings growth rate over this time period. Clearly, investing in utility stocks is all about the dividend income and not about a high rate of capital appreciation.
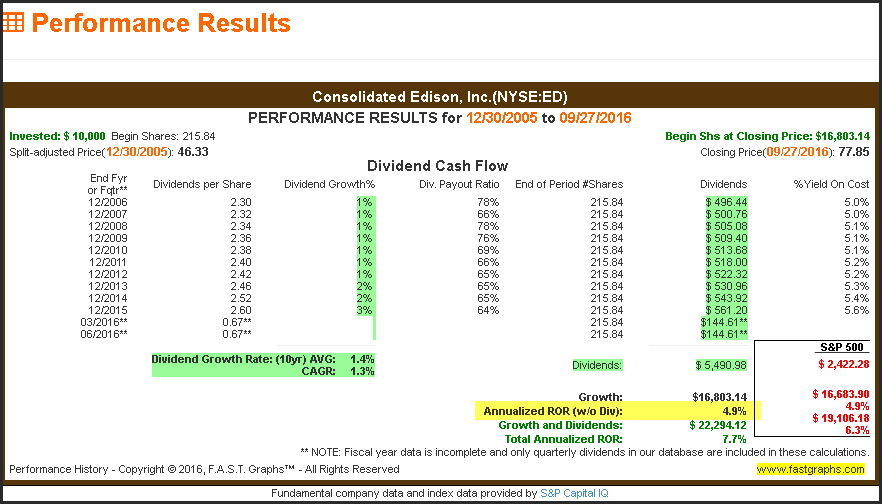
The only way that you can expect to get capital appreciation greater than the company’s earnings growth rate is to buy the stock at a low valuation and then measure future performance when its valuation is high. My next example looks at Consolidated Edison from 2006 when the stock was fairly valued to current when the stock is now significantly overvalued. Once again, note how the stock price correlates to and tracks closely to earnings. But more importantly, note how quickly price returns to fair value when it does get disconnected.
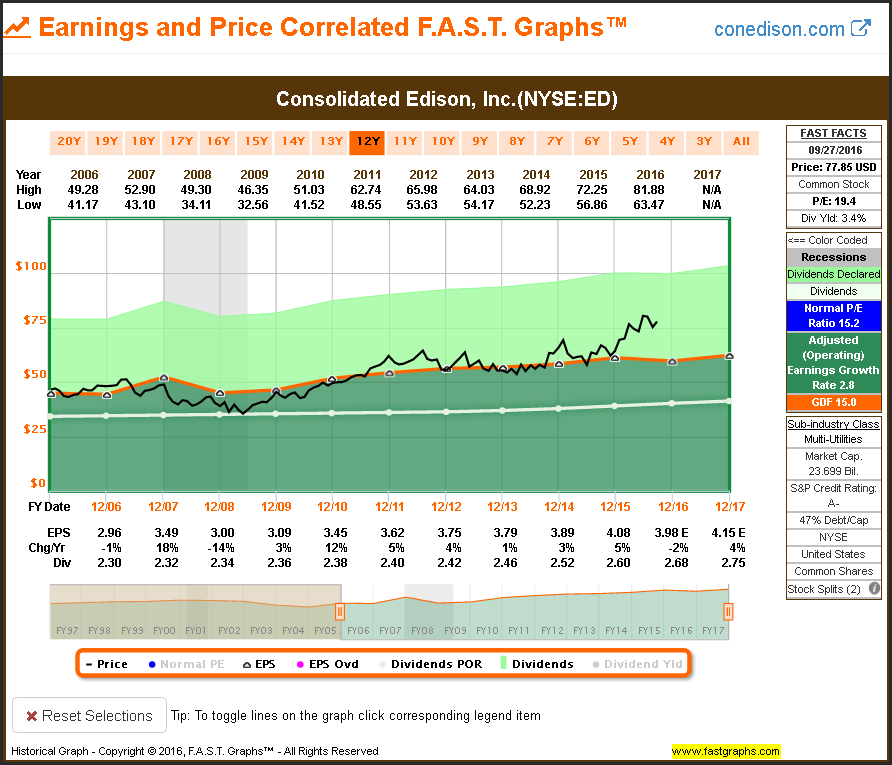
When you look at the performance report associated with the above graph, you note that capital appreciation of 4.9% exceeded the company’s earnings growth rate of only 2.8%. Consequently, when you measure the performance and recognize that the company was fairly valued at the beginning and is now overvalued, you understand why capital appreciation exceeded earnings growth. To repeat, measuring performance without simultaneously measuring appreciation and earnings growth is a job half done.
With this next graph, we scroll back in time and look at 2012 to 2015 where we can clearly see the effects that even moderate overvaluation can have on a slow growth stock like a utility. During this timeframe, we see the slope of the line or the growth rate at 3%, which is almost double the long-term historical we saw earlier on the long-term graph. However, the starting P/E ratio on January 1, 2012 was 17, only moderately higher than the 15 fair valuation reference P/E ratio 15, and the ending valuation was a P/E ratio of 15.8 which is only slightly higher than fair value.
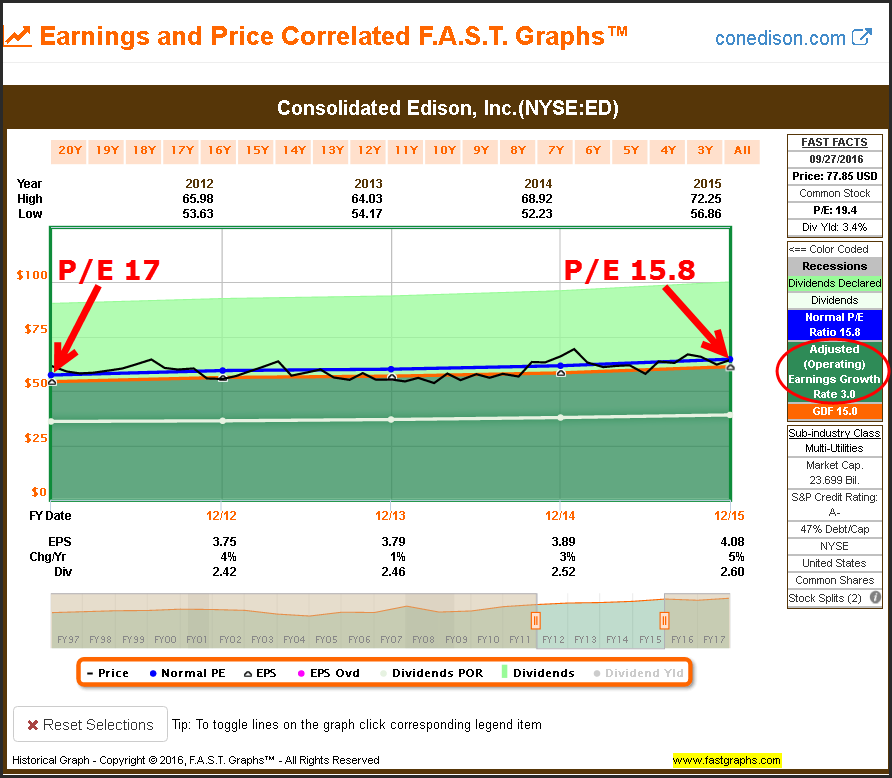
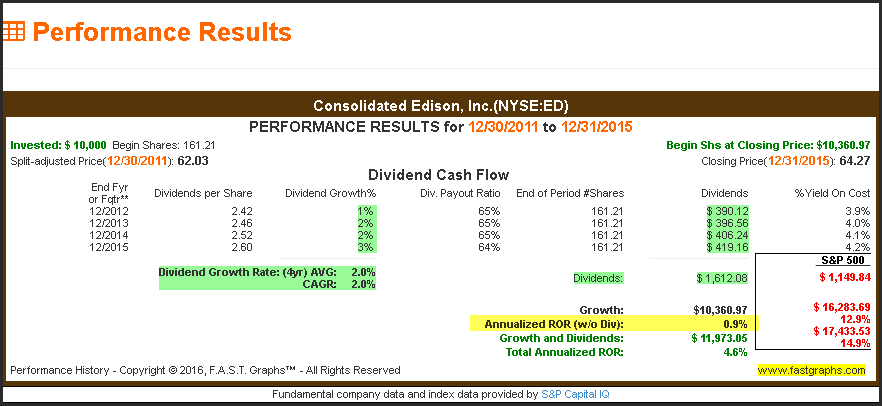
When we look at the associated performance report, we discover that capital appreciation is only .9% in spite of the 3% growth. The point being that even moderate overvaluation when investing in a slow growth company severely limits the capital appreciation you might receive. Consequently, when investing in low growth investments like utility stocks, the importance of valuation is heightened.
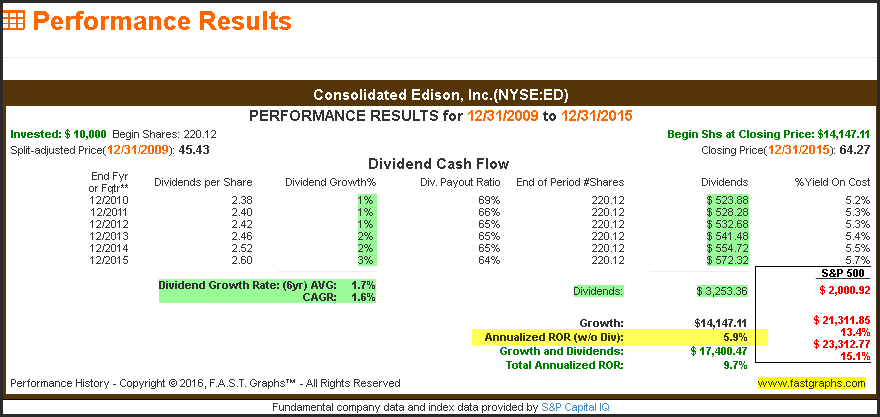
With my final set of graphs on Consolidated Edison I present the timeframe 2010 to 2015 where valuation was approximately fair at both the beginning of the period and the end. Note that in this timeframe Consolidated Edison’s average earnings growth rate was 4.7%, which is still relatively low, but higher than what we saw on the other examples.
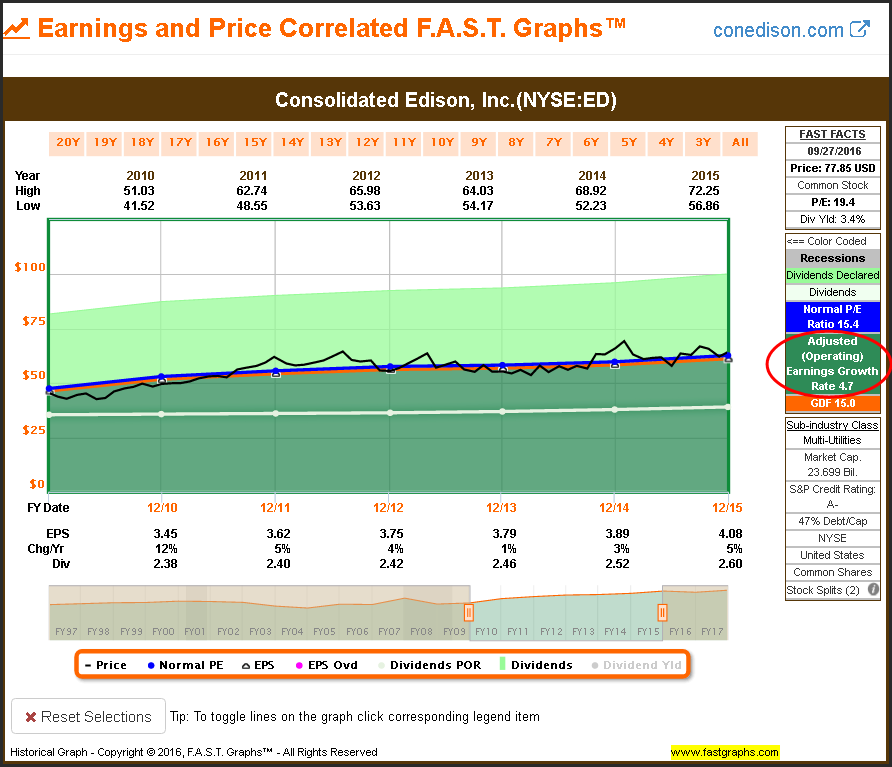
With valuation closely aligned in both the beginning and the end, a quick check of the associated performance report shows capital appreciation of 5.9% which is generally in line with the company’s earnings growth rate over that timeframe. To summarize, what I have attempted to show with these examples on Consolidated Edison is that valuation is a reference of risk and soundness. When thinking about total return, valuation in conjunction with the company’s earnings growth achievement must be also considered.
Lessons on Valuation: Johnson & Johnson Higher Growth Blue-Chip But Growth Is Slowing
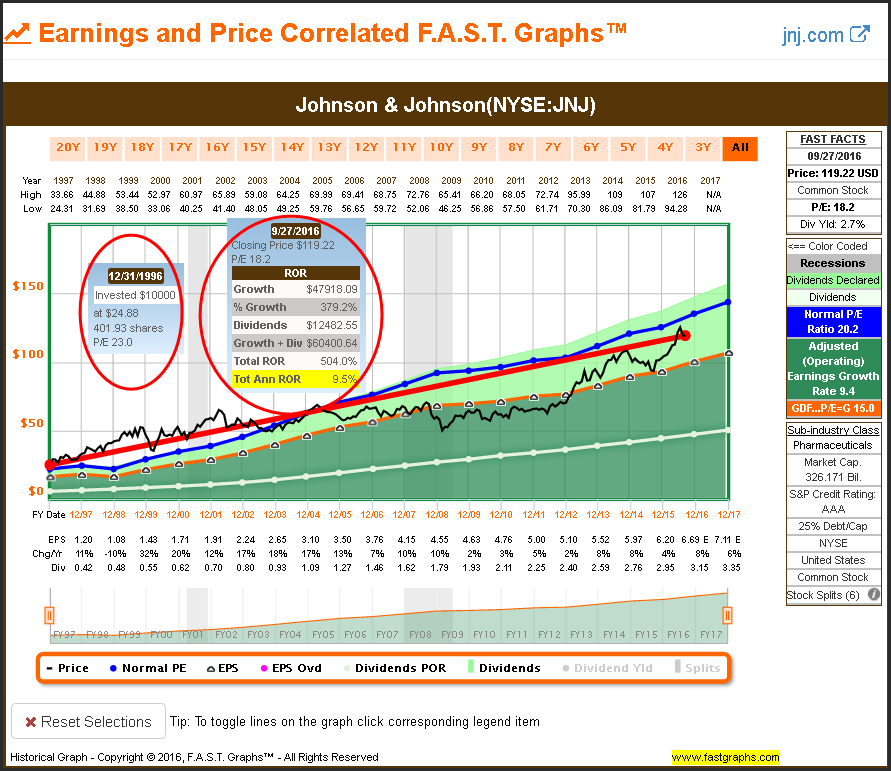
By moving from the low growth utility sector to the faster growing blue-chip dividend growth stock Johnson & Johnson (NYSE:JNJ), we can learn several additional lessons on valuation. Since 1997, Johnson & Johnson has grown earnings at the average rate of 9.4%. However, on December 31, 1996 Johnson & Johnson was trading at a P/E ratio of 23 which is significantly above the fair value reference of a P/E ratio 15. Currently, Johnson & Johnson trades at a lower blended P/E ratio of 18, which indicates a P/E ratio contraction versus the initial purchase.
Nevertheless, even though you overpaid for the stock in the beginning, the above-average rate of earnings growth still enabled you to earn a total annual return of 9.5%. The point being, if the company is growing fast enough, you can pay more than fair value and still earn a decent rate of return over the long run. The calculated performance on the following graph shows that shareholders that purchased Johnson & Johnson on December 31, 1996 earned an annualized rate of return of 9.5%. Most people would take that rate of return if it was guaranteed.
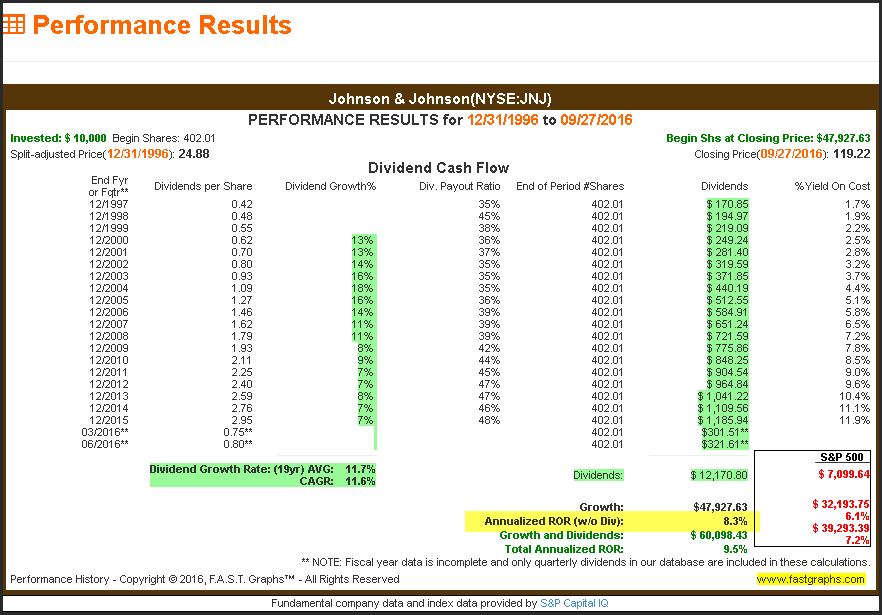
However, if we take a deeper look at the performance results we discover that capital appreciation only averaged 8.3%, which was less than the company’s earnings growth rate of 9.4%. However, dividends made an additional contribution which brought the total return up to the 9.5% total annualized rate of return. Moreover, Johnson & Johnson’s valuation from 1997 all the way out to 2007 was higher than earnings justified over that entire timeframe. Although the return was decent, I would argue that the risk associated with achieving it was rather high as I will illustrate next.
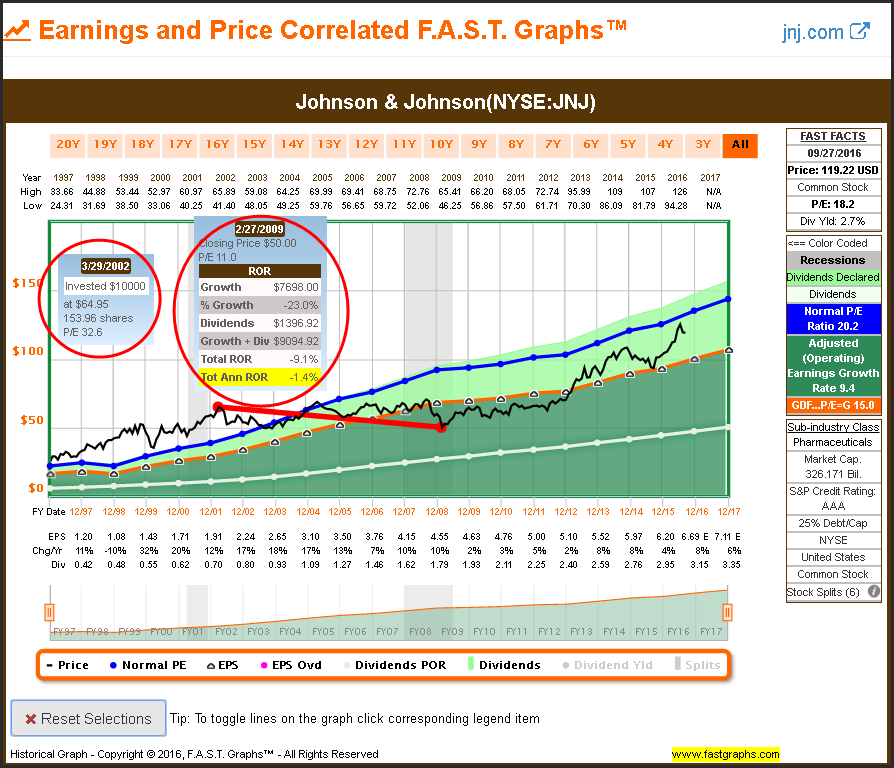
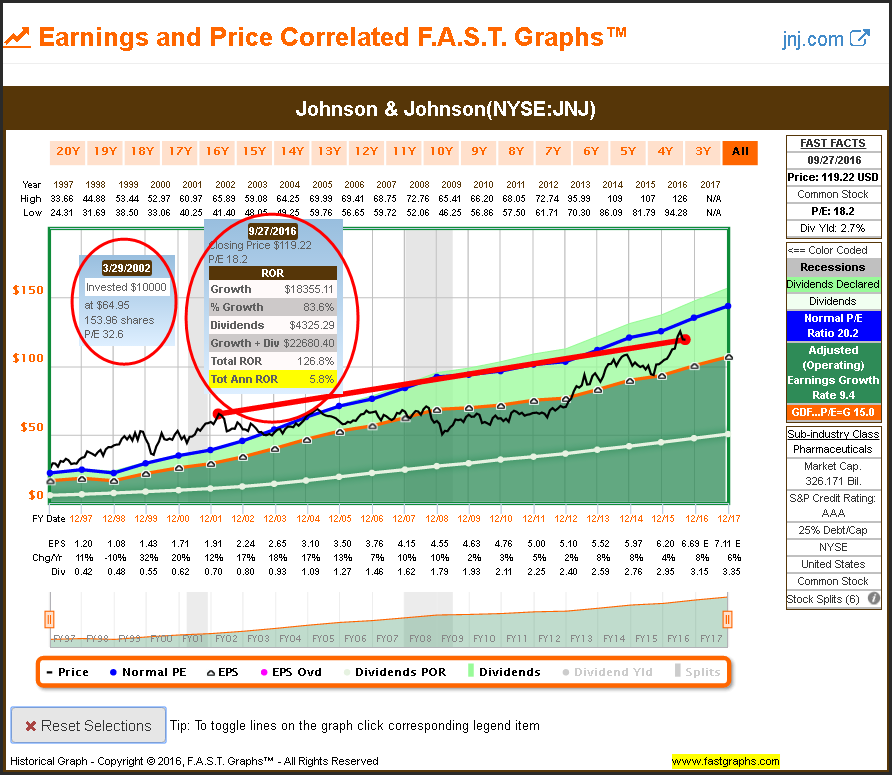
This next illustration shows the risk associated with investing in even a high quality AAA-rated blue-chip like Johnson & Johnson when its valuation is high. This is an extreme example from the perspective of investing in Johnson & Johnson at an all-time high valuation and then measuring its performance 8 years later at an all-time low valuation. What is not shown on this graph is the fact that this was a time period when Johnson & Johnson grew earnings at 11.7% per annum. Consequently, you could have owned it and lost money investing in this blue-chip based on high valuation, even when the company itself was performing in an exemplary manner.
With my final Johnson & Johnson example, I once again illustrate that had you not panicked and sold at the bottom and still held Johnson & Johnson today, you would have received a positive total annual rate of return of 5.8%. Once again, that is not a horrible return assuming you had the intestinal fortitude to hold on during all the valuation challenges that followed. Valuation is a component of total return, but its primary value relates to risk assessment and soundness.
Cisco Systems, Inc.
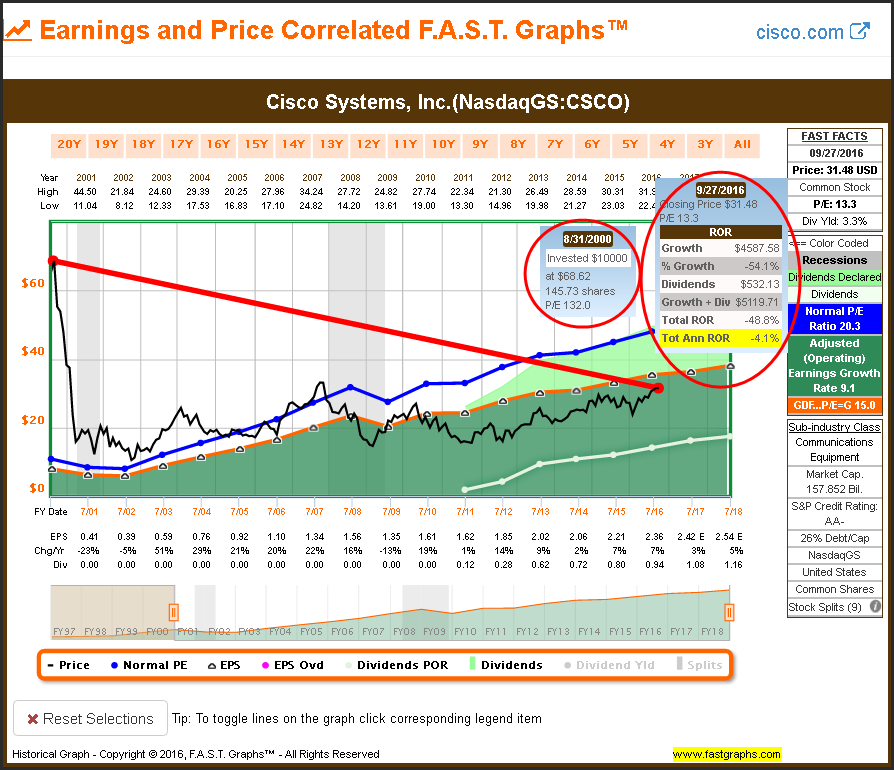
With my final example on this essay on valuation as a measurement of risk and soundness, I will turn to Cisco Systems Inc (NASDAQ:CSCO). Most investors should remember the incredible bubble in technology that began to burst in the summer of 2000 to 2002. At its peak on August 31, 2000, Cisco was trading at an incredible P/E ratio of 132. To me, this represents a pure picture of the risk associated with high valuation. Although it is extreme, it clearly illustrates how valuation can destroy returns over time, even when the company performs well on an operating basis.
Had an investor purchased Cisco on that fateful day in calendar year 2000 and were foolish enough to have held all these years, that investor would have lost more than half of their money. But most importantly, the company did well as a business, and instituted a dividend in 2011 that has grown at an incredible rate. Although extreme, this is a clear picture of valuation as a risk assessment.
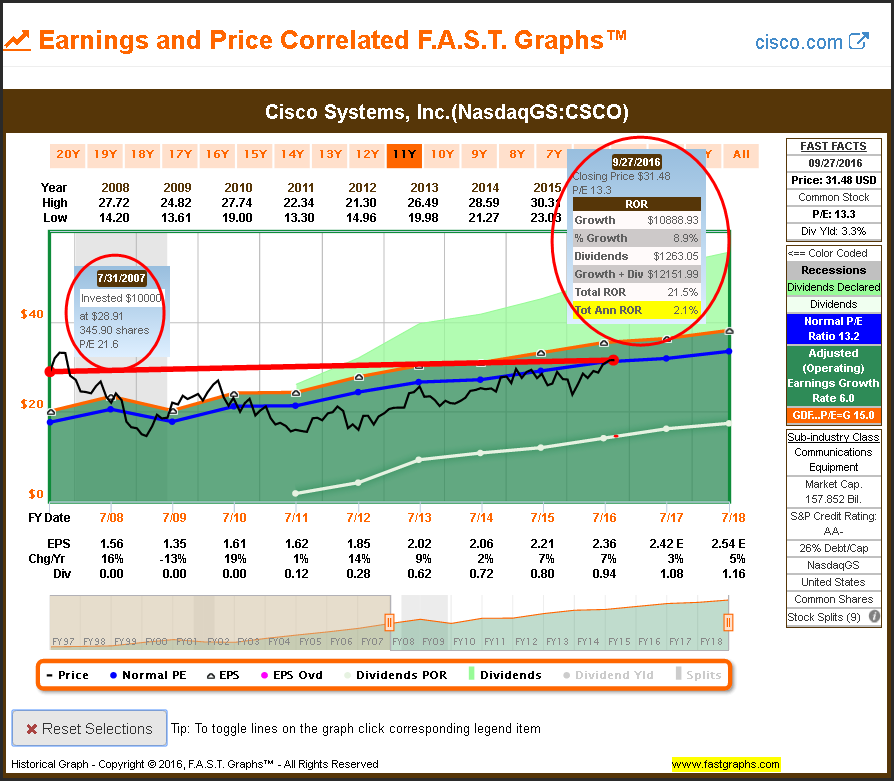
With my next Cisco example I also look at a period of time when Cisco was overvalued - but not at the extremes I showed in the first example. Once again, we see that Cisco performed rather well where earnings grew at a 6% average rate, and just a few years before they started paying a dividend. Cisco’s P/E ratio at the beginning of this performance measurement was 21.6. That is still high, but nothing like we saw in the previous example.
Although Cisco was able to eke out a modest rate of return over this timeframe, it was hardly justified and certainly not reflective of how the business itself performed. Cisco is a high risk investment that time, and the subsequent returns, illustrate the risk of paying too much.
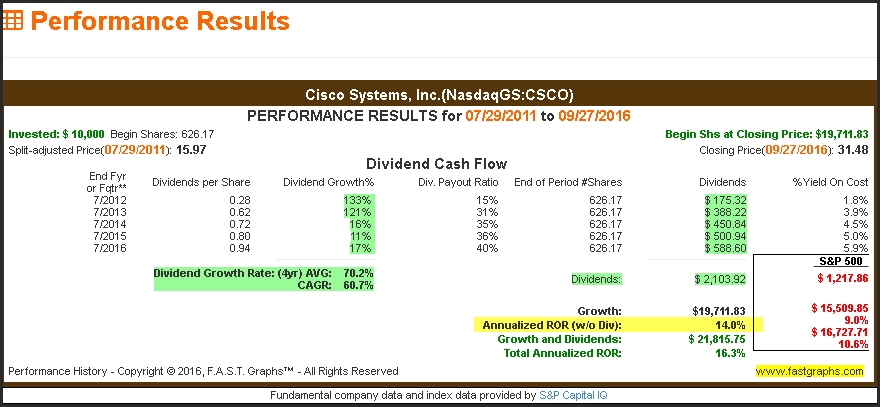
With my next and final example on Cisco, I look at a time when Cisco was significantly undervalued and available at a P/E ratio of only 9.6. Similar to what we saw with the previous graph, Cisco was growing earnings at an average of 6.6% per annum during this time.
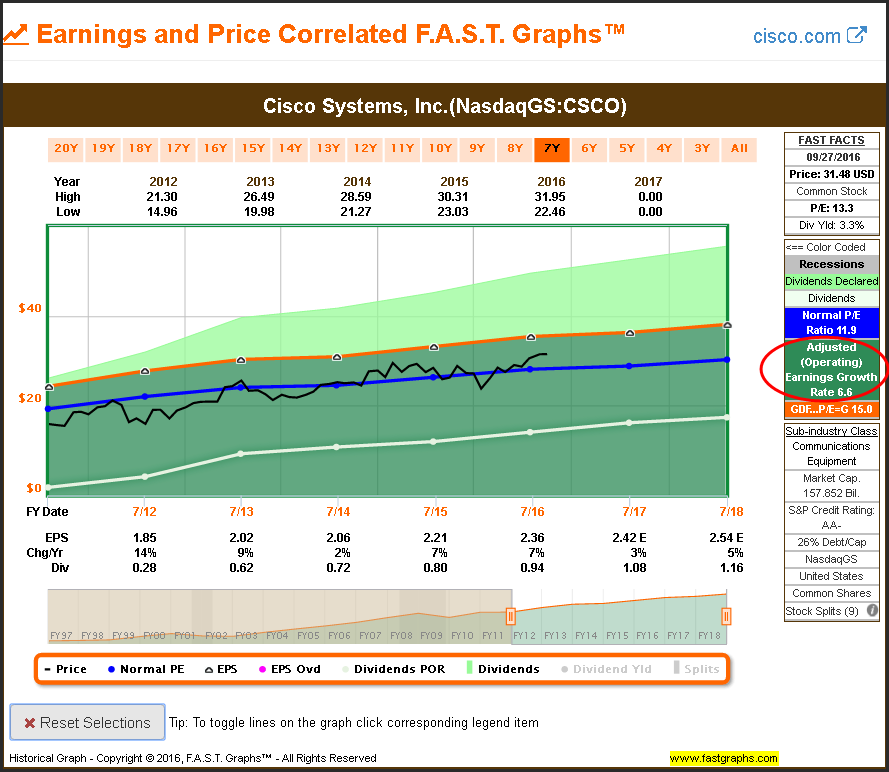
However, in contrast to what we saw when we overpaid for the stock, the exact opposite is true when Cisco was purchased at a bargain. This was the timeframe when the company was paying a dividend and was simultaneously undervalued. Over this timeframe, capital appreciation came in at 14% which is slightly more than double the earnings growth rate, and when you add in dividends to total annualized rate of return came in at 16.3%.
Not only is this an exceptional rate of return, but it also significantly outperformed the S&P 500 over this timeframe. But most importantly, the risk taken to achieve this return was extremely low relative to what we saw previously. Valuation is clearly a measurement of soundness and risk, but when you get it right, it can also produce powerful and better-than-justified total returns.
Special bonus: Fully Functioning F.A.S.T. Graphs™ and FUN Graphs on ED, JNJ and CSCO
One of the challenges that I face when writing articles that include F.A.S.T. Graphs™ is that I can only include a picture of the graph. This article is no different. However, as a special bonus, I am offering live fully functioning F.A.S.T. Graphs™ and FUN (financial underlying numbers) graphs on the three companies I reviewed in this article. Therefore, interested readers can follow the below links and research these three example companies deeper and faster.
Here is the link for a FAST and FUN Preview of F.A.S.T Graphs using the stock symbol ED
Here is the link for a FAST and FUN Preview of F.A.S.T Graphs using the stock symbol JNJ
Here is the link for a FAST and FUN Preview of our F.A.S.T Graphs using the stock symbol CSCO
Summary and Conclusions
With this article, I have primarily covered the principles of valuation and earnings growth from a historical and current perspective. My primary objective was to illustrate the importance of fundamental valuation as a measurement of soundness and risk control. Additionally, although attractive fundamental valuation will contribute to total return, it is not a guarantee of high returns. However, sound valuation in conjunction with the future operating performance that the stock you invest in achieves will be the key factors that generate long-term results.
In part 2, I will continue my discussion on valuation and earnings growth; however, my primary focus will be on assessing the future. I believe that investors should have a clear perspective on the potential returns that an investment in any given stock might be able to achieve for them. Importantly, this does not suggest that investors can precisely know what rate of return an investment in a stock might generate. However, they can have a reasonable expectation and understanding of what a given stock investment might be capable of achieving. I call this investing with your eyes wide open. In part 2, I will discuss how those perspectives can be developed.
Disclosure: Long CSCO,ED,JNJ
Disclaimer: The opinions in this document are for informational and educational purposes only and should not be construed as a recommendation to buy or sell the stocks mentioned or to solicit transactions or clients. Past performance of the companies discussed may not continue and the companies may not achieve the earnings growth as predicted. The information in this document is believed to be accurate, but under no circumstances should a person act upon the information contained within. We do not recommend that anyone act upon any investment information without first consulting an investment advisor as to the suitability of such investments for his specific situation.
