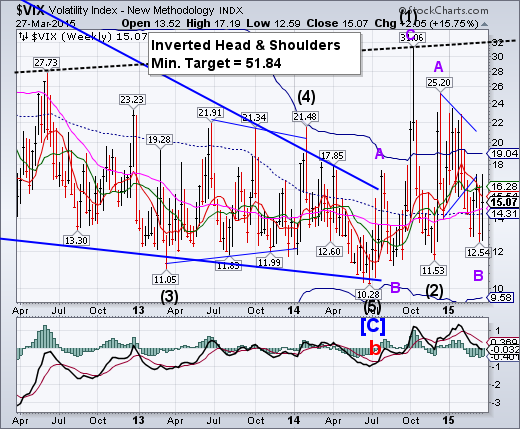
-- VIX challenged its February high at 17.19 after making a new Master Cycle low last week.Although it broke above weekly Short-term support/resistance at 15.54 and intermediate-term resistance at 16.28, it closed beneath them. VIX is back on a buy signal.
SPX declined beneath two supports.
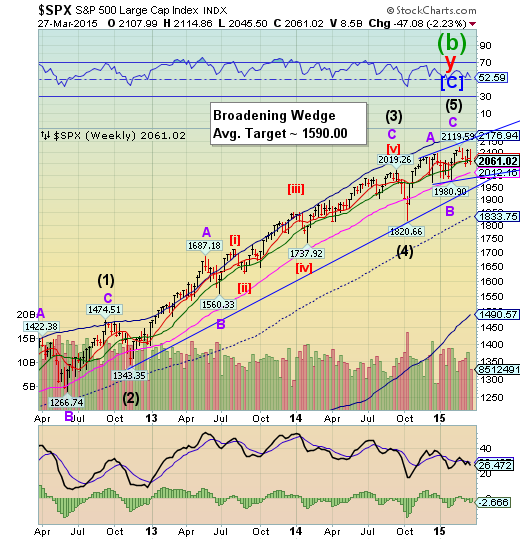
SPX declined beneath its Short-term support/resistance at 2072.89 and closed beneath Intermediate-term support/resistance at 2062.79.Further weakness may put its Long-term support at 2012.16 in its sights. Beneath that is the lower trendline for the Broadening Wedge formation. Crossing beneath that is a triggering event. The uptrend may be broken at the long-term trendline at 1960.00 The next decline may not be saved at Long-term support as the last one did on October 15.
(StreetTalkLive) This weekend's reading list is a bit of a hodge-podge of reads on a variety of different topics. However, before we get into it I wanted to address an interesting statement by the Atlanta Federal Reserve President Dennis Lockhart who Thursday:
"Atlanta Federal Reserve Bank president Dennis Lockhart said on Thursday there was little risk of a misstep that would force the Fed to lower rates once it begins raising them.
The economy is in solid shape to weather the upcoming turn to tightening monetary policy Lockhart, said at an investment education conference in Detroit.
"'Conditions are pretty solid,' said Lockhart, who regards an initial rate hike at the June, July or September Fed meetings as a high probability. 'I take the decision pretty seriously,' Lockhart said. 'Once we start, I want to be able to move deliberately towards higher rates.'"
NDX loses Short-term support.
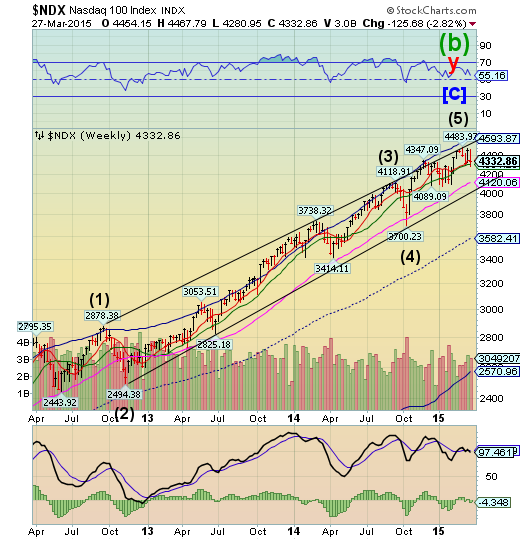
NDX declined through weekly short-term support at 4350.04 and Intermediate-term support at 4301.23, but closed the week above the Intermediate-term support. A break of Long-term support at 4120.00 and the 3-year trendline at 4050.00 may send the NDX into a much deeper decline to the weekly Cycle Bottom at 2570.96.
(ZeroHedge) To let everyone’s favorite “diminutive” Fed chair tell it, biotech valuations have been “substantially stretched” for the better part of a year. Despite that, blockbuster M&A deals and IPOs for pre-revenue newcomers have managed to sustain the insanity despite the objections of both bubble-spotting naysayers and some industry insiders like Roche Ventures’ Carole Nuechterlein who recently predicted that “the end is coming.”
High Yield takes a second dip to the Lip.
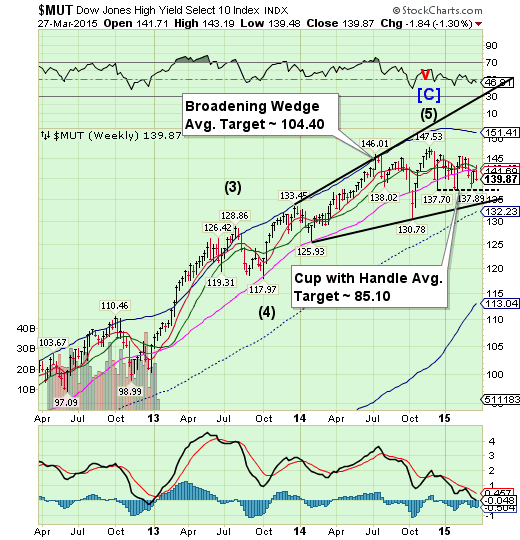
The High Yield Index challenged its Long-term resistance at 142.15, but quickly reversed back down toward the Lip of the Cup with Handle formation.The Cup with Handle formationhas a very high probability of success once it is triggered.A failure at this point may cause difficulties in new high yield financing that has helped finance stock buybacks, especially in the NASDAQ.
(MarketRealist) Investor flows in high yield bond mutual funds
Net inflows in high yield bond mutual funds were negative for the second time in eight weeks. According to Lipper, net outflows totaled $1.0 billion in the week ended March 20. Net outflows had come in at $1.96 billion in the week ended March 13. Inflows total $7.2 billion year-to-date in 2015.
The euro consolidates its gains.
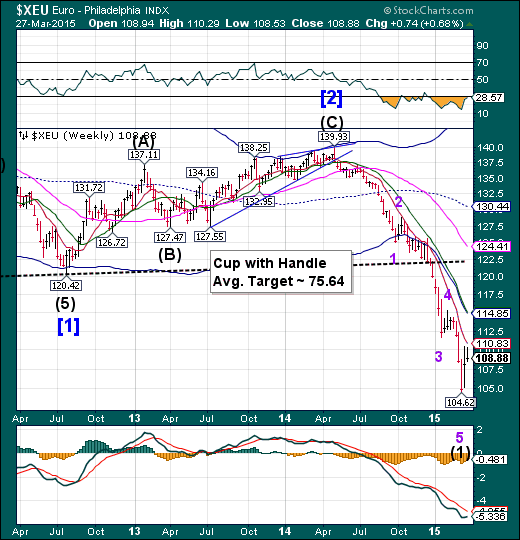
The euro consolidated its gains as it probed toward Short-term resistance at 110.83. The consolidation/decline may extend toward 106.38-107.75 before moving higher. A very likely target for this retracement may be the combined cycle Bottom/Intermediate-term resistance at 114.85. The consolidation and subsequent rally may last another 2-3 weeks.
(Reuters) - Greece is unlikely to exit the euro, either intentionally or accidentally. But it might be forced to introduce an alternative means of payment, in parallel to the euro, to pay some domestic bills if a reform-for-cash deal with its creditors is not secured soon, several euro zone officials said.
Athens has lost access to bond markets and international creditors are not willing to lend it more money until it starts implementing reforms. An official familiar with the matter told Reuters this week that without fresh funds, the government will run out of money by April 20.
EuroStoxx may be reversing.
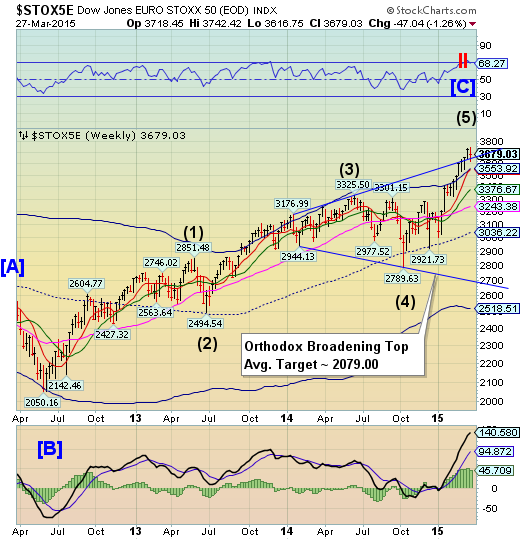
The EuroStoxx 50 probed the upper trendline of its Orthodox Broadening Top from above this week, which may signal the end of the rally. This rally appears to have been dependent on the declining euro. Could a rising euro reverse this trend?
(CNNMoney) Investors can't get to Europe fast enough.
American cash is pouring into European stocks. Last week alone, U.S.-based funds sent a record amount --$3.9 billion -- into Europe equities. That's according to EPFR Global, a research firm that tracks fund flow data.
"The trend is definitely accelerating," says Cameron Brandt, director of research at EPFR.
U.S. investments going to Europe thru mid-March have already outpaced February's total and are triple the size of January's figure.
The yen peeks above Intermediate-term support.
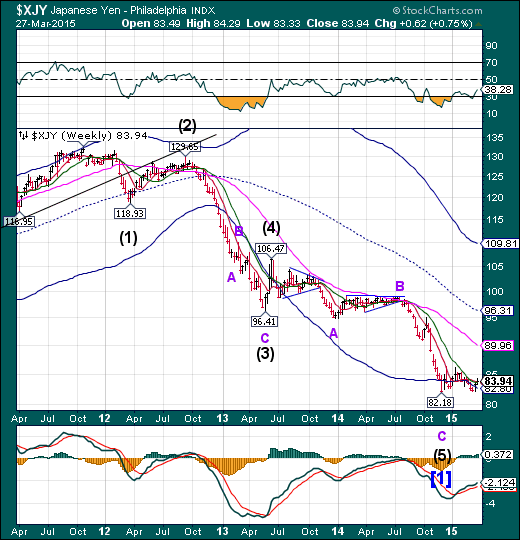
The yen emerged above Intermediate-term resistance at 83.76 for the first time since the end of February. It appears to have another 3 weeks of potential rally, so climbing above the lower resistance allows it to seek the next resistance level at 89.96. The declining dollar may give it impetus to go even higher.
(CNBC) Foreign exchange expert Kathy Lien says we can get a clue about where the market's going next by looking at just one currency pair: the dollar-yen.
Lien, managing director of FX strategy with BK Asset Management, says that judging by the Japanese yen, the odds of U.S. stocks bouncing back after four losing sessions are slim.
"Right now, I'm quite worried about the lower highs and lower lows that we're seeing in dollar/yen," she said. "Until we get back above 120, I think that this signals that we could possibly have further risk aversion and downside in U.S. equities."
The Nikkei reaches upper trendline resistance, reverses.
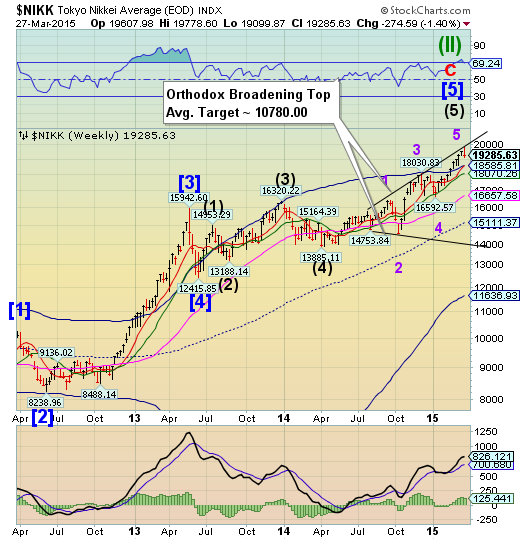
The Nikkei probed the upper trendline of its Orthodox Broadening Top on Monday then spent the rest of the week in decline. The Broadening toprepresents a market that is out of control and has a highly emotional public participation.Danger signs will become more pronounced once it declines beneath the Cycle Top support at 18585.81.
(BBC) Asian markets experienced mixed fortunes after weak economic data from Japan underlined the struggle policymakers face in reviving the world's third-largest economy.
Consumer inflation, excluding the impact of the April 2014 tax rise, returned to zero for the first time in nearly two years in February.
Meanwhile, household consumption was 2.9% lower than a year ago, while retail sales were down 1.8%.
The Nikkei closed down 1% at 19,285.63.
U.S. dollar closes lower, but still above support.
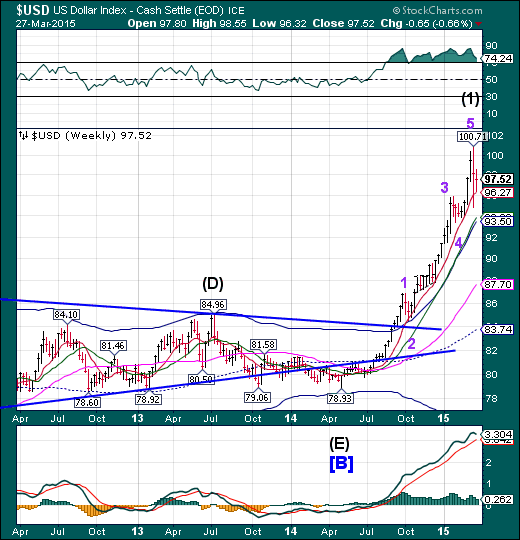
The US dollar bounced off Short-term support at 96.27, but closed lower for the week. The Cycles Model calls for a probable month-long decline as far as mid-cycle support, currently at 83.74. Critical support is at the Cycle Top at 93.50. Dollar longs may be crushed in the next decline.
(Reuters) - Positive bets on the U.S. dollar rosein the latest week, while net shorts on the euro jumped to arecord high, according to data from the Commodity FuturesTrading Commission and Thomson Reuters that was released onFriday.
The value of the dollar's net long position increased to$43.91 billion in the week ended March 24 from $38.59 billion the previous week. Last week, net longs in the dollar fell under $40 billion for the first time in 12 weeks.
To be long a currency is to take a view that it will rise, while being short is a bet its value will decline. The Reuters calculation for the aggregate U.S. dollar position is derived from net positions of International Monetary Market speculators in the yen, euro, sterling, Swiss franc, Canadian and Australian dollars.
USB breaks out.
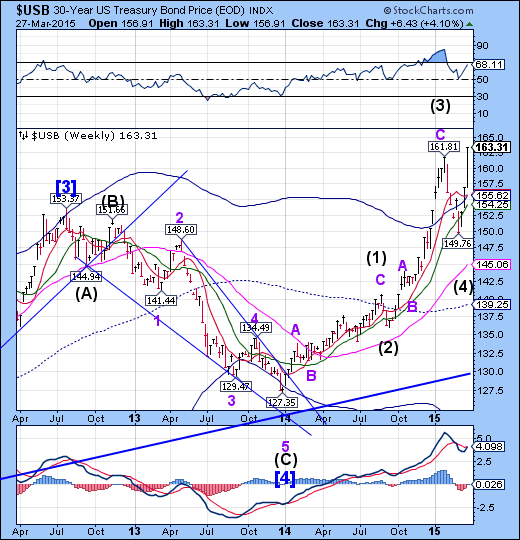
Money poured into the Long Bond despite rising rates ($TYX). Cycle rotation now favors bonds over stocks but caution is advised as rising rates may discourage bond investors.
(NASDAQ) U.S. government bonds strengthened for the first time in three days Friday after a report showed growth in the U.S. economy slowed in the final quarter of last year.
A selloff in U.S. crude oil--down about 5% Friday--reduced worries over inflation, a main threat to the value of fixed-income assets over time, contributed to the bond market's strength.
Gold bounces may have completed a right shoulder.
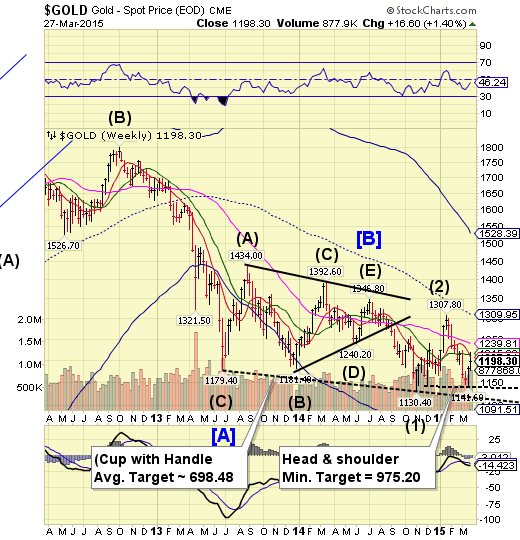
Gold appears to have been repelled by weekly Intermediate-Term resistance at 1215.38. This completes nearly a 50% retracement of the most recent decline and the right shoulder of the Head and Shoulders formation. Today was a major turn date for gold. A failure beneath 141.60 triggers the formation with a minimum target of 975.20.
(MineWeb) Analysts at the French Bank SocieteGenerale (SocGen) in their latest research report have forecast that the gold price, having given away all its early year gains, was headed sharply lower, as it saw the dollar continue its gain in strength. They thus expected the bear market in gold to continue further and saw the price as falling to average only $925 an ounce between 2016 and 2019. The timing of this report was perhaps unfortunate in that the forecast for a virtually immediate downturn in gold, together with dollar strength, predated the events of the past few days, which has seen the reverse occur. Gold bulls will be fervently hoping that the bank’s analysts are equally incorrect in their forecast of gold’s longer-term prospects.
Crude completes an irregular correction...
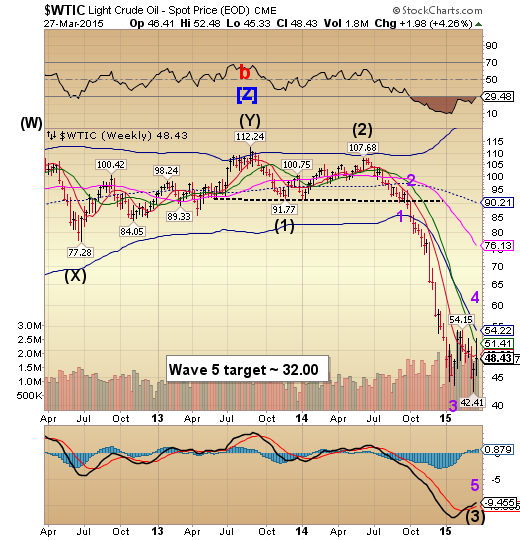
Crude appears to have been repelled by its Intermediate-Term resistance at 51.41 and closed beneath Short-term support/resistance at 49.20. This was a bit of a surprise, since the reversal was not expected until Monday. Crude has a new potential Wave 5 target at 32.00.
(Bloomberg) -- The slowdown that North American railroad companies had been bracing for in crude oil shipments has turned into a rout, with volumes falling faster than executives had predicted.
With energy companies scaling back drilling after prices for the commodity fell about 50 percent since July, industry executives and analysts anticipated that demand for hauling crude and extraction materials such as frac sand and pipes would slow after a four-year surge. They didn’t expect it to slow this much this fast.
“The impact is occurring more quickly than the rails originally projected to investors,” said Matt Troy, an analyst with Nomura Securities International Inc. in New York. “The consensus view was that very high double-digit growth would moderate to low double digits, and as we have seen in recent weeks we’ve broken that floor and in some cases gone negative.”
Shanghai Index nearing the end of its rally?
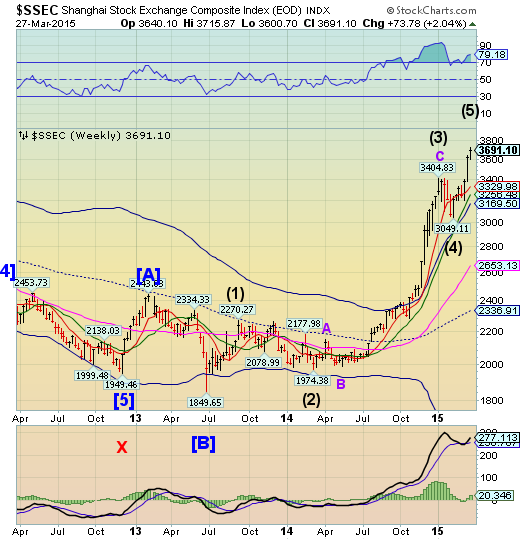
The Shanghai Index appears to be approaching the end of its year-long bull run. The Cycles Model suggests a probable turn at the end of March. Retail investors are piling onto this index, which is an good indication of an overbought market. In addition, with nowhere to lend money, China’s shadow banking complex is turning to stocks.
(WSJ) China’s economic growth is slowing, corporate earnings are under pressure, bank loans are souring and the property market is in a funk.
The surprise financial bright spot: China’s long-maligned stock market.
Seven years after a 72% crash from the market’s 2007 peak destroyed over $3.5 trillion worth of investor wealth, Chinese stocks are on track to be among the strongest in the world for a second year. The Shanghai Composite Index has about doubled since its 2008 lows, with the index up nearly 14% this year.
Unfortunately,what’s flowing into stocks is dumb money.
The Banking Index loses all supports.
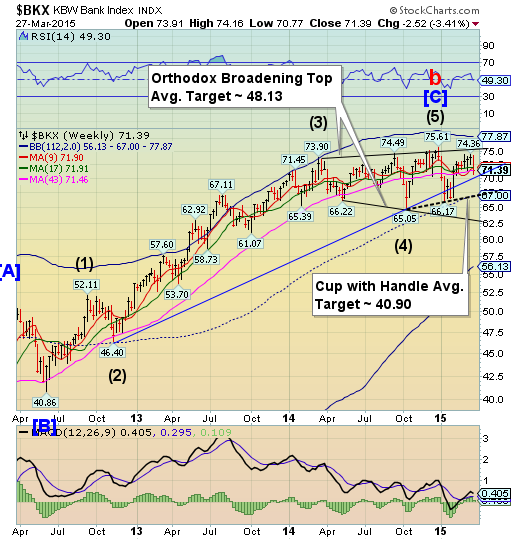
--BKX declined beneath its final line of defense, its Long-term support at 71.46. This virtually assures a decline to its cycle Bottom, currently at 56.13. This would likely trigger the Orthodox Broadening Top formation. The Cycles Model now implies that the next decline may last through mid-April. Could this be a waterfall event?
(TheGuardian) Big Wall Street banks are so upset with Elizabeth Warren’s call for them to be broken up that some have discussed withholding campaign donations to Senate Democrats in symbolic protest, sources familiar with the discussions said.
Representatives from Citigroup, JP Morgan, Goldman Sachs and Bank of America have met to discuss ways to urge Democrats, including Warren and Ohio senator Sherrod Brown, to soften their party’s tone toward Wall Street, sources familiar with the discussions said this week.
Bank officials said the idea of withholding donations was not discussed at a meeting of the four banks in Washington but it has been raised in one-on-one conversations between representatives of some of them. However, there was no agreement on coordinating any action, and each bank is making its own decision, they said.
(ZeroHedge) As we’ve discussed twice this month, the world has now officially given up any pretensions that Japan’s elephantine QE program isn’t underwriting the rally in Japanese stocks. Not only is the Bank of Japan buying ETFs, they’re targeting their purchases to (literally) ensure that stocks can’t fall by stepping in when things look weak at the open. Unfortunately, Kuroda looks set to run up against the extremely inconvenient fact that while, in his lunacy, he can print a theoretically unlimited amount of money, the universe of purchasable ETFs is limited and so eventually, the BoJ will own the entire market.
(ZeroHedge) Nearly a month after the Hype Alpe Adria bad bank Heta Asset Resolution "unexpectedly" imploded under a house of non-GAAP and misreported cards, and which led to only the second European creditor bail-in after Cyprus in what until then was considered the safest European nation, unleashing a herd of black swans which will result in not only the insolvency of one of Austria's provinces, Carinthia, but a week ago led to its first foreign casualty, German Duesseldorfer Hypothekenbank AG which had to be bailed out by the German FDIC-equivalent, the ECB has finally realized it may have a major problem at hand.
(ZeroHedge) When it comes to the sweeping of (trillions of) toxic assets until such time as the ECB starts purchasing not only government bonds but equities, bank loans and really anything else that in a normal world would have some "mark to market" value, Europe had a ready answer: bad banks. A tradition which started with Switzerland and the semi-bailout of UBS during the great financial crisis, "bad banks" have been proposed every time there are a few hundred billion in bad assets that need to be swept away or otherwise removed from the public eye.
In fact, it was just a few hours ago that Spain's economy minister praised the usefulness of bad banks, which have certainly seen their fair share of use in Spain over the past 5 years.
Which stock should you buy in your very next trade?
With valuations skyrocketing in 2024, many investors are uneasy putting more money into stocks. Unsure where to invest next? Get access to our proven portfolios and discover high-potential opportunities.
In 2024 alone, ProPicks AI identified 2 stocks that surged over 150%, 4 additional stocks that leaped over 30%, and 3 more that climbed over 25%. That's an impressive track record.
With portfolios tailored for Dow stocks, S&P stocks, Tech stocks, and Mid Cap stocks, you can explore various wealth-building strategies.
