Weekend Update June 28, 2019
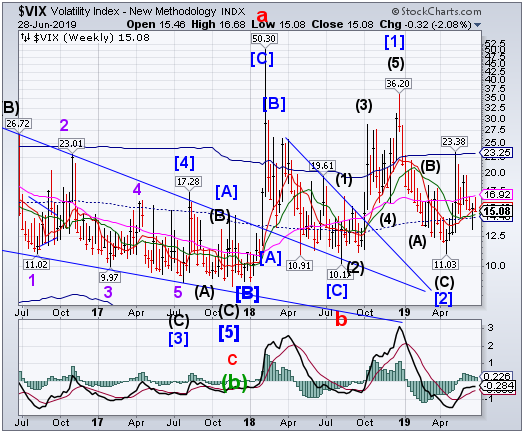
VIX rallied to test Long-term resistance at 16.92 before retreating under Short-term support/resistance at 15.42 at the end of the week.A rally above Short-term support/resistance may provide an initial buy signal.
SPX pulls back
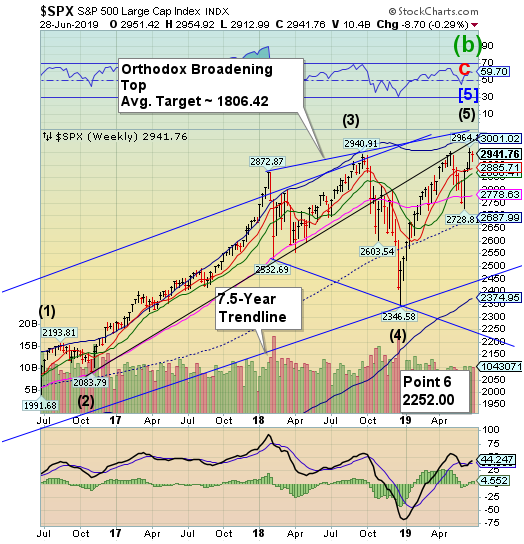
SPX made a new all-time high on June 21, then declined through Wednesday. Interestingly, this week's close is very near the September 21, 2018 peak, prompting some to ask whether the SPX may already be in a bear market. A new sell signal may be had at a decline beneath Short-term support at 2885.71.“Point 6” remains beneath the December 26 low.
(CBSNews) Wall Street's partying like it's 1997, with Friday's session marking the best first half of the year for U.S. stocks since the dawn of the dotcom boom 22 years ago.
The S&P 500 stock index finished Friday up 17% year-to-date, while the technology-heavy Nasdaq composite gained 20.4%. The Dow was up 14%, around 3,250 points, to reach nearly 26,600 since Jan. 2, the start of the 2019 trading year.
NDX rally falls short of a new high
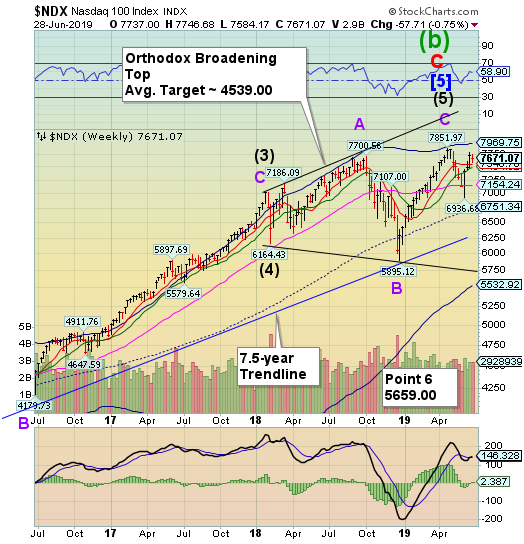
NDX was unable to make a new high, leaving it in a vulnerable spot.This weakened position suggests the NDX may be a leader to the downside.The Cycles Model suggests the decline may resume through mid-July with Point 6 as a probable target.
(CNBC) So far, 2019 has been a year of growth for the nation’s largest tech companies while U.S. lawmakers and regulators question how big is too big.
Four of the five FAANG stocks — Facebook (NASDAQ:FB), Amazon (NASDAQ:AMZN), Apple (NASDAQ:AAPL) and Netflix (NASDAQ:NFLX)— have grown their market value at least 25% over the past six months. Microsoft (NASDAQ:MSFT), currently the largest public tech company in the U.S. with a market cap topping $1 trillion, has also grown its shares more than 31% since the beginning of 2019.
Only Google parent company Alphabet (NASDAQ:GOOGL) saw more modest growth of 3.6% since the beginning of the year.
High Yield Bond Index declines
The High Yield Bond Index made a lower high last week, then reversed. A decline beneath Intermediate-term support at 209.75 may give a sell signal. The Cycles Model warns the next step down may be a large one.
(Bloomberg) High-yield bond sales surged this month to the highest since September 2017 as borrowers rushed to lock in lower borrowing costs. Fund inflows chasing record returns and central bank easing make for an attractive funding environment.
Issuance jumped to almost $28 billion this month, with another $525 million deal that may price today, according to data compiled by Bloomberg. It’s the second straight month that new issue volume has topped $26 billion.
Treasuries make a 33-month high
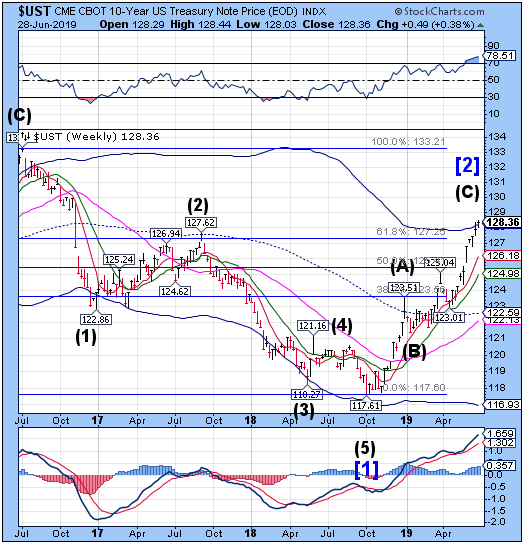
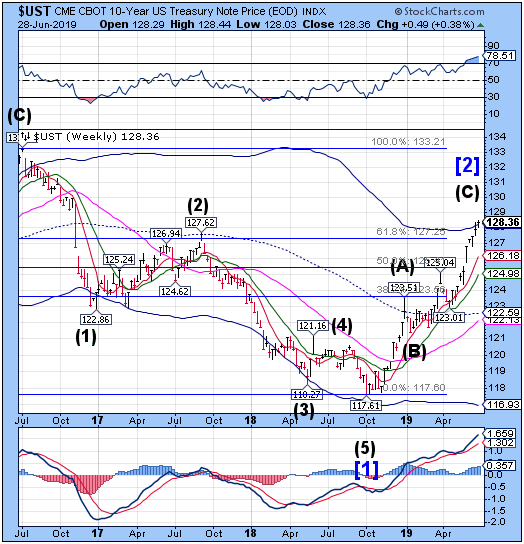
The 10-year Treasury Note Index made its intended target on Wednesday, surpassing the Cycle Top resistance at 128.24. The Cycle high had extended an extra week, as is often the case in a runaway top. However, a decline beneath the Cycle Top support may cause a sell signal for UST.
(ZeroHedge) A quick blurb from this morning's Early Morning Reid (from DB's Jim Reid), which confirms that the vast majority of investors expect deflation to pick up from here, and yields to drop further before (if) they rebound.
I’m at a big 2-day macro DB hosted conference at the moment with investors representing over 25 trillion of investable capital attending.
There were a few shows of hands through day one to gauge the mood and a couple of the interesting takeaways from me was that about 90% expected 10yr US yields to go to 1.70% next versus 2.30%, and around a similar percentage expected the Euro construct to look similar in 10 years time than it does today (in terms of countries in it) - so relatively sanguine about Italy. On the second question I was one of the 10%!
The euro consolidates above long-term support
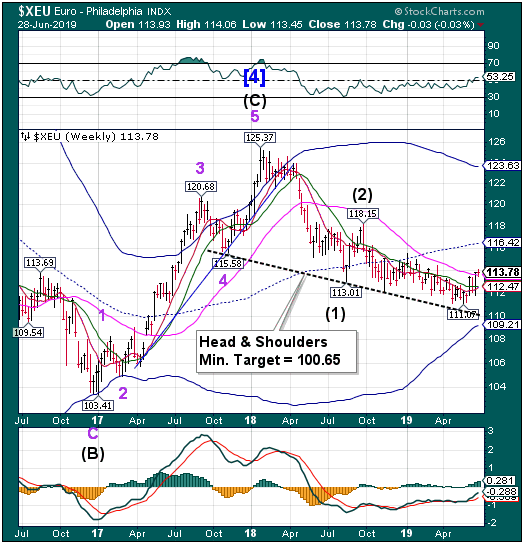
The euro consolidated after rallying above Long-term support at 113.54. The Cycle extension occurred as suggested. However, the Cycle is at a pivot point that may produce a sell signal beneath Short-term support at 112.47.
(Reuters) - The dollar dipped on Friday after U.S. economic data confirmed the likelihood of a July interest rate cut, although foreign exchange markets seemed on hold as investors awaited the meeting between the United States and China at the G20 summit in Japan.
The core U.S. personal consumption expenditure price index rose 0.2% in May, as expected, reinforcing investor expectations that the Federal Reserve will cut rates by 25 basis points to 2.25% at the next meeting.
As result, the dollar reaction to the data was limited and it last traded 0.1% lower at $1.1381, though it has fallen by around 1.7% in the past couple of weeks.
Euro Stoxx makes a new retracement high
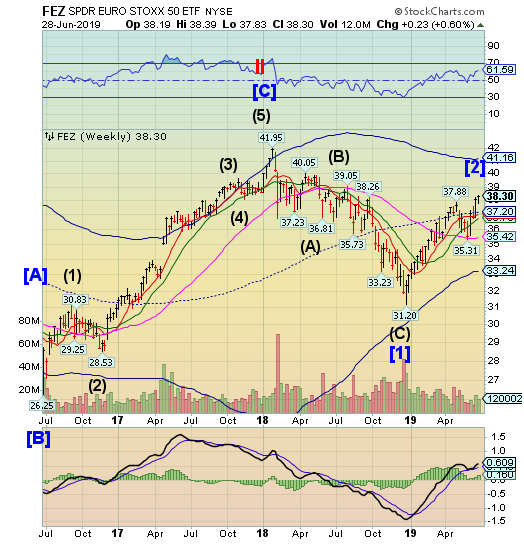
Note: StockCharts.com is not displaying the Euro Stoxx 50 Index at this time.
The Euro Stoxx50 SPDR made a new retracement high on Friday, closing just beneath it. While making an impressive 22.75% gain from the December low, it still hasn’t surpassed its top in early 2018. The sell signal may be triggered beneath the mid-Cycle support at 37.20. The Cycles Model suggests a probable 2weeks of decline may lie ahead.
(CNBC) European markets closed higher Friday as investors track developments at the G-20 summit in Osaka, Japan, where President Donald Trump and Chinese President Xi Jinping are expected to meet amid the ongoing trade war.
The pan-European Stoxx 600 closed provisionally 0.7% higher. Autos and basic resources, two sectors particularly sensitive to trade-related news, rose around 0.8% and 1.5% respectively.
The world’s two largest economies have maintained firm stances going into the weekend, with the Chinese Ministry of Commerce calling on Washington to cancel its pressure and sanction measures on Huawei and other Chinese companies, while Trump reiterated a threat to impose tariffs on all Chinese imports if talks fail.
The yen consolidates
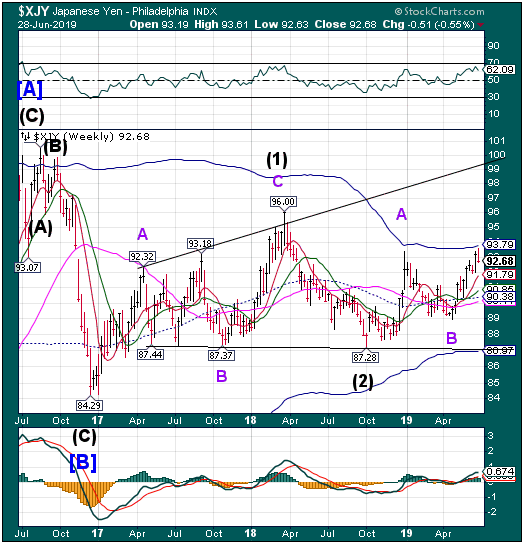
The yen approached the weekly Cycle Top resistance at 93.79 on Tuesday, then eased back at the end of the week. The Cycles Model calls for a pullback that may last another week or more.It may retest Short-term support at 91.79, or lower.
(Bloomberg) The barriers preventing the yen from reaching 100 per dollar, a target that has proved elusive for the past two years, are dropping one by one.
An escalation of the U.S.-China trade war took the haven asset through 110 in mid May. Next to go was resistance at 108.50, which crumbled late last month when President Donald Trump threatened to put a 5% duty on Mexican imports. The threshold of 105 now looks vulnerable as U.S.-Iran tensions worsen and investors await a planned meeting between Trump and Chinese counterpart Xi Jinping at this week’s Group-of-20 summit.
“What’s come out fresh over the past week as a catalyst to push dollar-yen toward 100 is the geopolitical risk over Iran,” said Daisuke Karakama, chief market economist at Mizuho Bank Ltd. in Tokyo. “If war breaks out in the worst case, that would typically push the dollar lower.”
Nikkei remains stalled under triple resistance
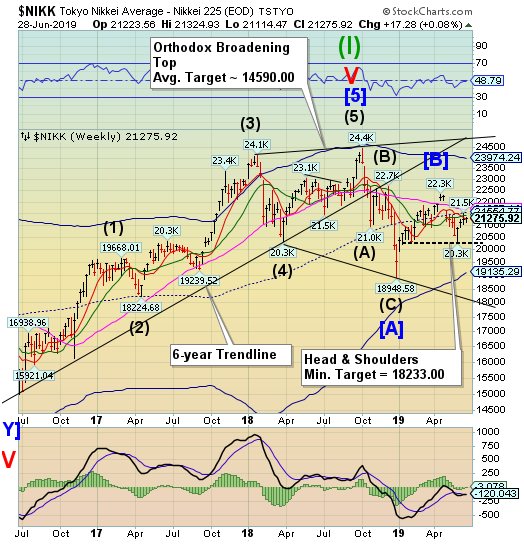
The Nikkei Index remains stalled under triple resistance at 21405.83-21667.14. There may be a sell signal beneath 21000.00. Weakness may prevail throughout the month of August.
(Investing.com) – Japan stocks were higher after the close on Thursday, as gains in the Paper & Pulp, Railway & Bus and Real Estate sectors led shares higher.
At the close in Tokyo, the Nikkei 225 added 1.19%.
The best performers of the session on the Nikkei 225 were Dainippon Screen Mfg. Co., Ltd. (T:7735), which rose 6.53% or 277.5 points to trade at 4527.5 at the close. Meanwhile, SUMCO Corp. (T:3436) added 5.34% or 65.0 points to end at 1282.0 andDaikin Industries, Ltd. (T:6367) was up 5.26% or 720.0 points to 14415.0 in late trade.
U.S. dollar continues its decline
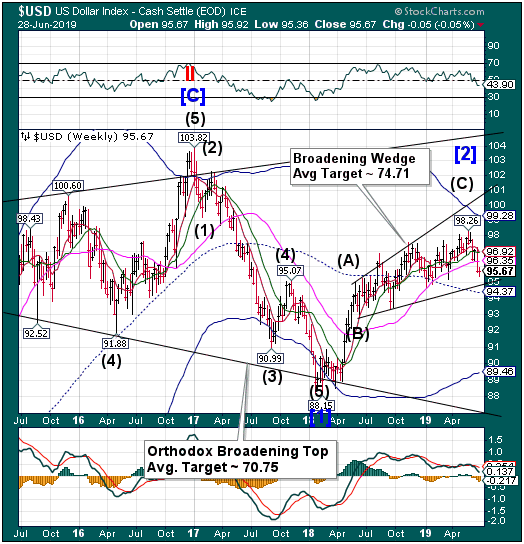
USD failed at critical resistance after making its Master Cycle low on June 13. Aside from a bounce or two, the trend appears to be down for the next month.
(Xinhua) -- The U.S. dollar declined in late trading on Friday, as U.S. consumer spending and personal income increased in May, pointing to tepid inflation level.
U.S. personal consumption expenditures (PCE), a key metric of household spending, ticked up 0.4 percent on a seasonally adjusted basis in May from the previous month, said the Commerce Department on Friday.
The growth came along with an increase of 88.6 billion U.S. dollars in personal income in the month, up 0.5 percent from the previous month.
The PCE price index rallied 0.2 percent in May. Excluding the volatile food and energy prices, the core PCE price index increased 0.2 percent.
Year over year, the core PCE price index, a preferred inflation gauge by the U.S. Federal Reserve, rose 1.6 percent in May, below the central bank's target inflation rate of 2 percent.
Gold makes a new 2019 high
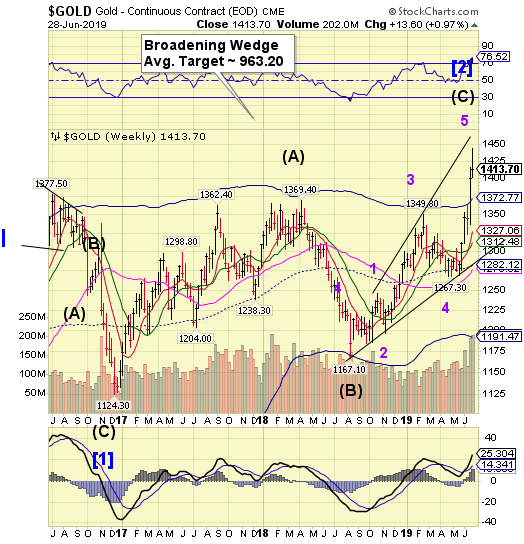
Gold made an extended Master Cycle high on Tuesday at 1442.90. However, on Wednesday it made a Key Reversal, although still closing the week at a gain. The indications are that Gold may join the SPX in its next decline.
(Kitco News) - Gold prices are moderately higher in early U.S. trading Friday, on some new safe-haven demand heading into a weekend that could produce a U.S.-China trade deal, or find both countries digging in their heels for a very long trade war. And traders know the U.S.-Iran tensions in the Persian Gulf are still high. August gold futures were last up $5.10 an ounce at 1,417.00. July Comex silver prices were last up $0.02 at $15.225 an ounce.
Asian stock markets were mostly weaker overnight, while European stock indexes were mostly firmer. U.S. stock indexes are pointed toward modestly higher openings when the New York day session begins.
Crude stalls at critical resistance
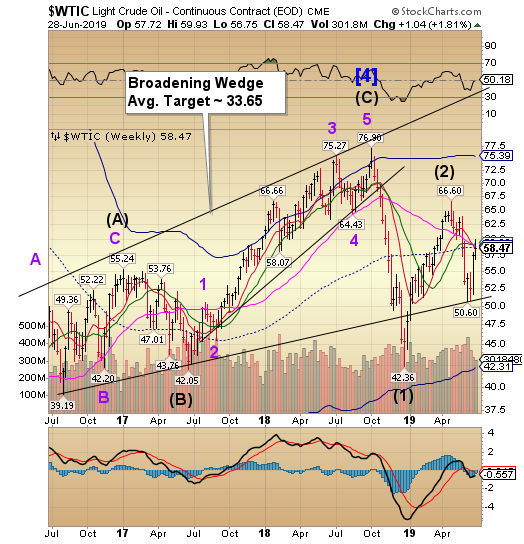
The Crude rally stalled at triple resistance at 58.43-59.46 a week later than expected, but all indications are the rally may be over.From here, a decline may emerge, lasting up to two months.
(OilPrice) Now that there are no sanction waivers for Iranian oil buyers, the United States will sanction any imports of crude oil from Iran, the U.S. Special Representative for Iran, Brian Hook, said on Friday, reiterating comments he made last month amid reports that China has already imported its first crude oil cargo from Iran that breaches the U.S. sanctions.
“We will sanction any imports of Iranian crude oil,” Hook said in London, as carried by Reuters.
Last month, Hook said that the United States would sanction any country that tries to buy Iranian oil after the sanction waivers expired on May 2, regardless of whether said country had reached its negotiated cap under the exemptions, clarifying earlier comments that resulted in speculation that the U.S. would allow countries that hadn’t reached their cap of Iranian imports to continue buying oil from Iran until they reach that cap.
Agriculture Prices may be due for a Cycle low
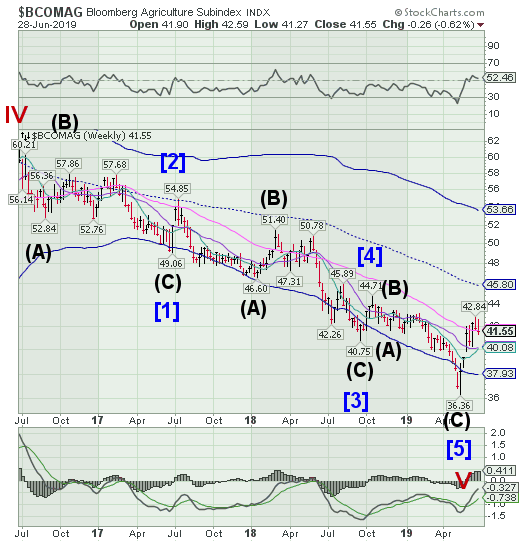
The Bloomberg Agricultural Subindexdeclined beneath Long-term support at 41.63. The Index is due for a Master Cycle low, although a shallow one. A probable target may be Intermediate-term support at 40.08, but the Index is due for a bounce higher in just a few days.
(ZeroHedge) It has gotten to the point where maybe we should just expect violent storms to hammer the Midwest every single day of the week. Highly destructive storms ripped through the Midwest on Tuesday, it happened again on Wednesday, and the forecast calls for more powerful storms on Thursday. This growing season has been a complete and utter nightmare for U.S. farmers, and each day it just gets even worse. Millions of acres will not be planted at all this year, but an even bigger problem is that fact that crops are dramatically failing on tens of millions of acres that were actually planted in time. Every major storm does even more damage, and that is why what we have witnessed so far this week has been so alarming.
For example, on Tuesday the middle of the country was absolutely pummeled by “more than 120 damaging storms”…
Shanghai Index consolidates, may go higher
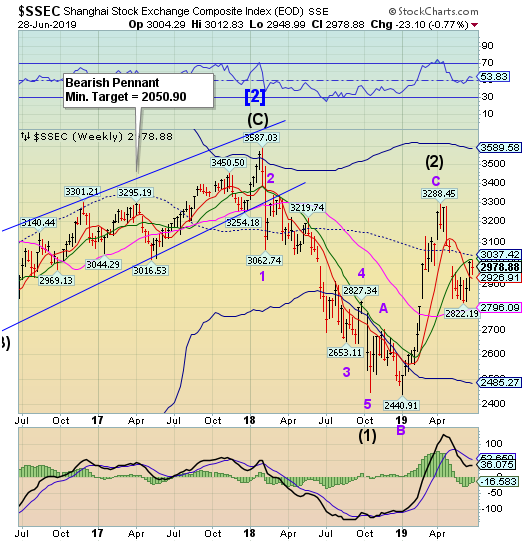
The Shanghai Index consolidated beneath Intermediate-term resistance at 3018.89, closing lower for the week.The Cycles Model identifies a potential Master Cycle high by the end of this week. The potential target for this final probe may be mid-Cycle resistance at 3037.42, or modestly higher. Once filled, the decline may resume through late September.
(ZeroHedge) It is commonly accepted now that China is using its trade with the United States and other OECD countries to increase the size of its economy, which in turn will allow it to build its military to the point where it can attack the United States and other countries and hope to win. At its simplest, every Chinese container landed at the Port of Los Angeles contributes to a U.S. combat death at some point in time of China’s choosing. Every item of injection-moulded plastic from China picked off the toy shelves at Walmart (NYSE:WMT) contributes to a future U.S. combat death.
Some of our leaders seem to comprehend this but speak in a kind of code. Thus,Vice President Mike Pence told the West Point graduating class last month, “You will lead soldiers in combat. It will happen.” General James Mattis has made similar remarks. How can they be so certain that the size of the U.S. military won’t be enough to discourage a belligerent from disturbing the peace of the world?
The Banking Index probes higher
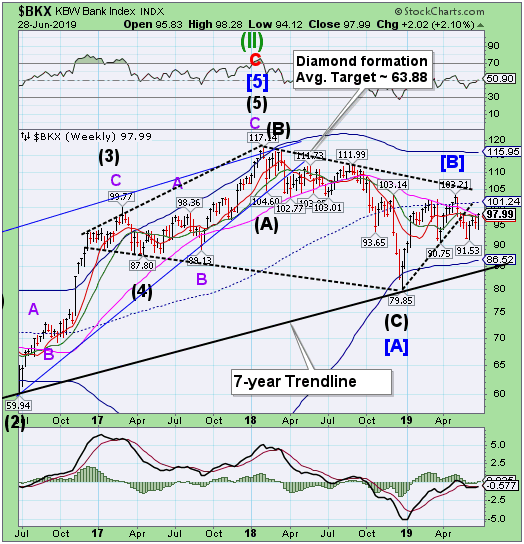
--BKX rose above Long-term resistance at 97.30, leaving the door open for another probe to mid-cycle resistance at 101.24.It appears that the Master Cycle Pivot due in the next two weeks may be an inversion (high).This may be the end of the summer rally which usually comes at this time.
(ZeroHedge) With the world waiting for the first headlines from the Trump-Xi meeting, the most important and unexpected news of the day hit moments ago, when Europe announced that the special trade channel, Instex, that will allow European firms to avoid SWIFT and bypass American sanctions on Iran, is now operational.
Following a meeting between the countries who singed the Iran nuclear deal, also known as the Joint Comprehensive Plan of Action (JCPOA), which was ditched by US, French, British and German officials said the trade mechanism which was proposed last summer and called Instex, is now operational.
As a reminder, last September, in order to maintain a financial relationship with Iran that can not be vetoed by the US, Europe unveiled a "Special Purpose Vehicle" to bypass SWIFT. The mechanism would facilitate transactions between European and Iranian companies, while preventing the US from vetoing the transactions and pursuing punitive measures on those companies and states that defied Trump. The payment balancing system will allow companies in Europe to buy Iranian goods, and vice-versa, without actual money-transfers between European and Iranian banks.
(CNBC) Chinese authorities’ takeover of the distressed Baoshang Bank — the first such case in nearly 20 years — has spooked the banking sector in the country, with banks finding it more difficult to borrow money from large lenders in the past month.
