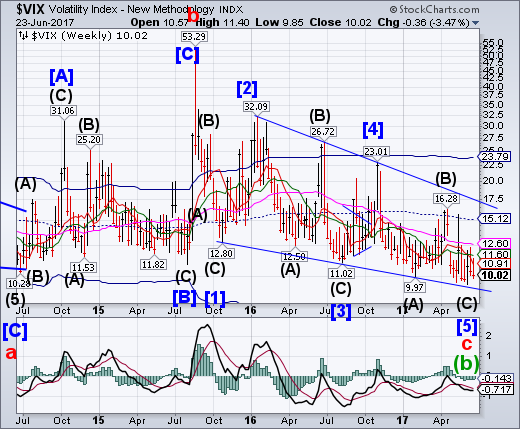
VIX continues to challenge both Short-term and Intermediate-term resistance before closing beneath them. A rally above Long-term resistance at 12.60 implies that VIX may challenge its Ending Diagonal trendline at 17.50 in the following move.
Despite calls from investment banks that market tumult is on the horizon, Wall Street traders seemed to be taking it easy this Friday. A measure of expected volatility hit a two-week low, while major stock-market indices meandered modestly higher.
The Vix index, which tracks expected S&P 500 volatility over the next month, slipped as much as 0.5 point to 9.98 per cent, the lowest level in two weeks, and well below the long-term average of about 20.
SPX caught between support and resistance.
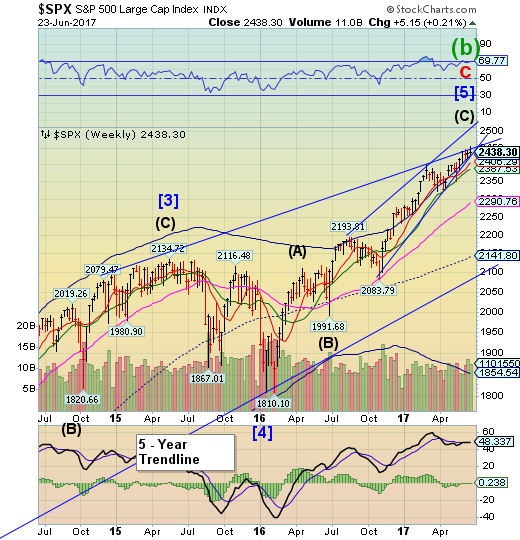
SPX appears to be caught between the upper trendline of its larger Ending Diagonal and the lower trendline of the smaller Ending diagonal. A break of the lower Diagonal trendline and Short-term support at 2406.29 may be the star of a decline that completely retraces the rally from the February 2016 low.
U.S. stocks were mostly lower on Friday, dragged lower by healthcare and consumer staples shares.
Health stocks had rallied on Thursday after Senate Republicans unveiled legislation that would replace Obamacare.
However, the bill faced skepticism from the Democrats, who attacked the legislation as a callous giveaway to the rich that would leave millions without coverage.
UnitedHealth was down about 1 percent and was the biggest drag on the Dow. Other major health stocks, including Regeneron and Amgen (NASDAQ:AMGN), were down between 1 percent and 3 percent.
NDX retraces two-thirds of its loss.
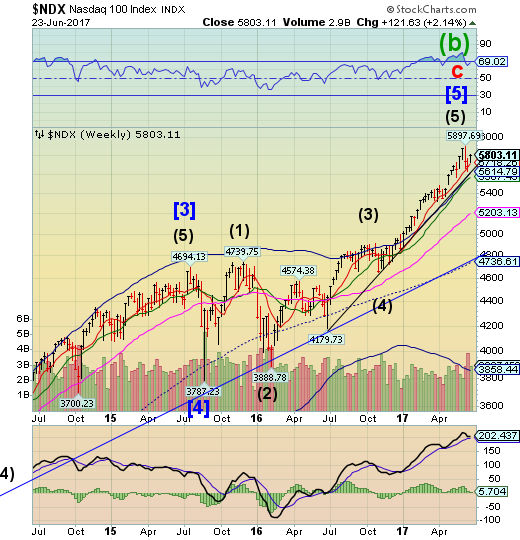
NDX retraced 67% of its loss from the June 9 decline.The next move to look for is a challenge of the trendline and supports beneath it. A decline beneath the rally trendline and Cycle Top support at 5614.79 may suggest a deeper correction is in order.
(BusinessInsider) Technology stocks suffered from a little anxiety attack in the markets last week.
It didn’t last long and really wasn’t all that serious. (Yet.) It was nothing worse than what everyone called “normal volatility” 10 years ago.
But the lack of concern it generated this time is not bullish. More than a few investors seem to think that “nowhere but up” is somehow normal.
High Yield Bond Index puts in a secondary high.
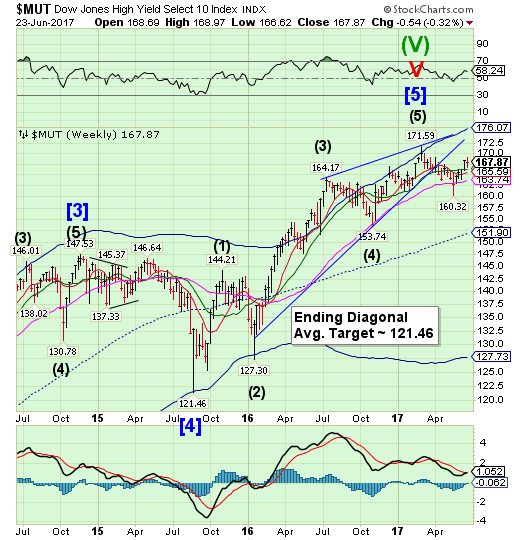
The High Yield Bond Index rallied until Tuesday, then tested Intermediate-term support at 166.29 before a small bounce into the weekly close. The sell signal may be reinstated beneath that support level. The Cycles Model suggests weakness may continue.
High-yield corporate bonds have been a remarkably resilient asset class throughout the post-crisis period. This included emerging from the rising default wave that spread across the asset class in 2015 and 2016. And, while high-yield bonds continue to hover near all-time highs, a renewed threat that first emerged for the category back in the spring is continuing to pick up steam. It remains to be seen how much longer high-yield bonds can resist the pressure.
USB continues higher.
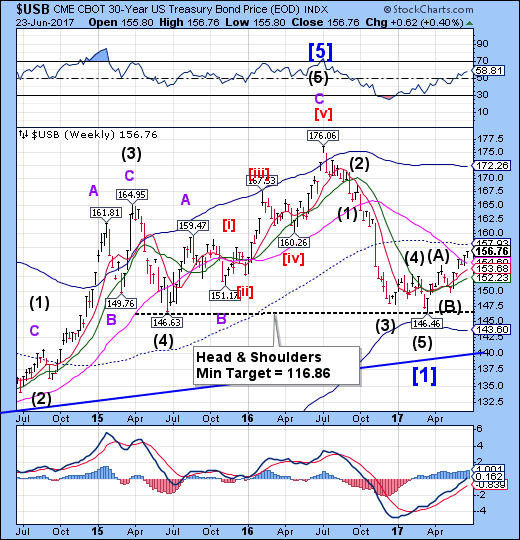
The Long Bond continues to rally aboveLong-term support at 154.60, signaling more strength ahead. The operative formation is the Head & Shoulders which may require the completion of the right shoulder near 165.00 before plunging through the neckline.
Lots of hand wringing these days about the flattening yield curve. We still maintain our position that the signal from the bond market is significantly distorted due to the global central bank intervention (QE) into the bond markets. See here.
Most of what is happening with the U.S. yield curve is technical. Sure, traders can get a wild hair up their arse, believing the economy is slowing and try and game duration by punting in the cash or futures markets. Given the small relative float of the U.S. Treasury bond market, however, it doesn’t take much buying to move yields. In the words of economists, the supply curve of outstanding Treasuries is very inelastic.
The euro testing support.
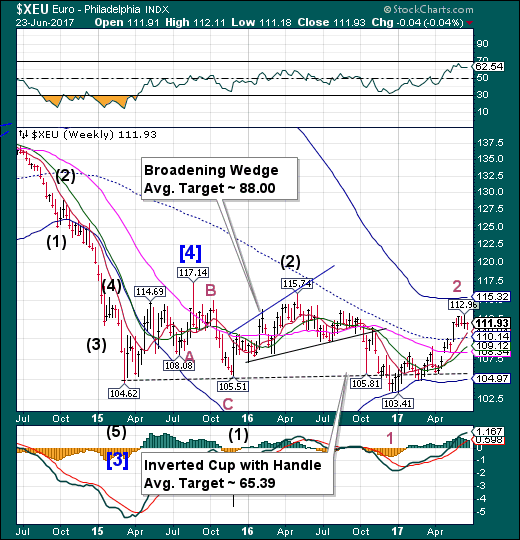
The euro attempted a test of Short-term support at 110.81, making a probable Master Cycle low. The follow-up appears to be a potential probe to the weekly Cycle Top resistance at 115.32 over the next three weeks.
You may think the reflation trade is dead. Actually, it’s simply traveled across the Atlantic.
Instead of betting on the dollar and better economic growth in the U.S., currency investors are coming to terms with the possibility that the dollar’s best days are behind it after three years of record-breaking strength. More and more, traders are starting to count on the euro to take the dollar’s place as the overarching trade of the $5.1 trillion market.
Euro Stoxx bounces at Intermediate-term support.
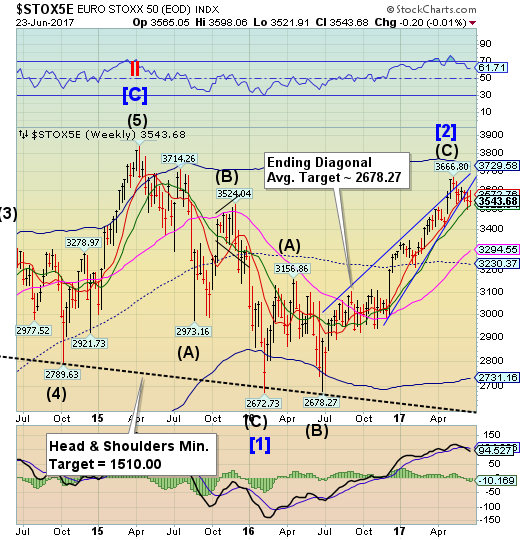
The Euro Stoxx 50 Index probed Intermediate-term support at 3522.64 before a bounce. There may be a brief period of strength lasting up to a week before Euro Stoxx plunges through that support.
European stocks closed lower on Friday as investors monitored oil prices and business activity in Germany dipped to a four-year low.
The pan-European Stoxx 600 slipped 0.23 percent with most sectors and major bourses in negative territory. For the week, bourses were little changed.
Europe's food and beverages sector was among the worst performers on Friday, down about 0.7 percent. Britain's pizza delivery business Domino's slipped towards the bottom of the benchmark after Berenberg bank lowered its outlook for the stock to "hold" from "buy". Its shares fell more than 2 percent on the news.
The yen tests Intermediate-term support.
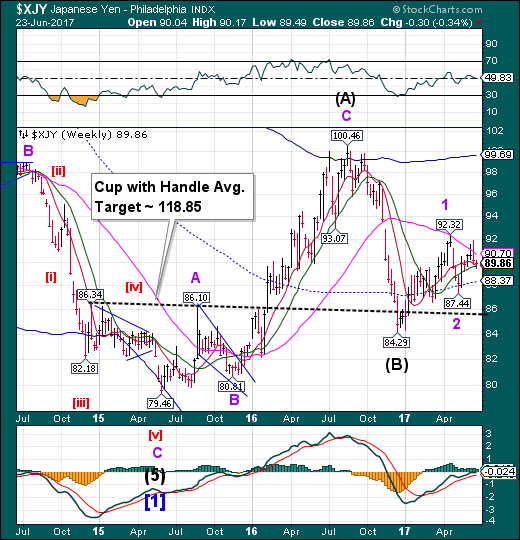
The yen challenged Intermediate-term support at 89.64 closing above it. This week’s pullback appears to be an important test of support prior to launching higher. It is probable that the rally may resume in the next week. A breakout above Long-term resistance at 90.70 may alter the pace of the rally.
The Nikkei probes higher.
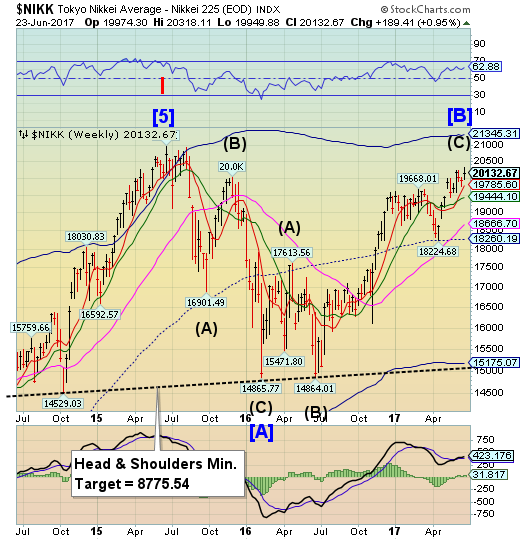
The Nikkei may have made the final probe of its rally from mid-Cycle support, although another week of strength cannot be ruled out. The Cycles Model suggests areversal may be developing, but a sell signal may not be generated until the NIKK declines beneath Short-term support at 19785.60.Further confirmation of the decline lies at Intermediate-term support at 19444.10.
US dollar uppressed at mid-Cycle resistance.
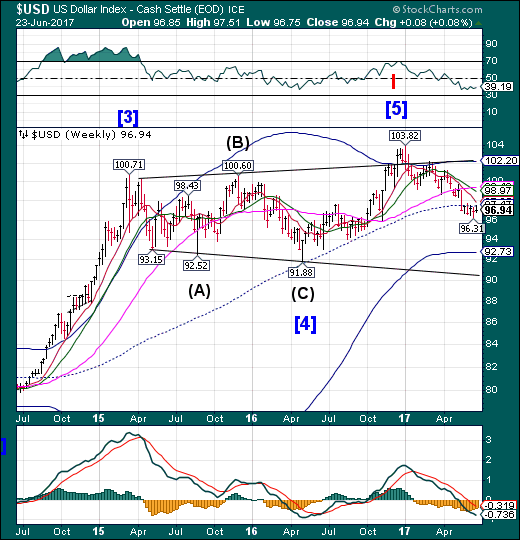
USD continues to be suppressed at mid-cycle resistance at 97.47 for the past five weeks. The Cycles Model does allow for a potential false breakout to challenge Short-term resistance at 97.85 in the next week or so before a plunge lower.
Speculators boosted net long positions on the U.S. dollar, after slashing them the previous week to their lowest level since last August, according to calculations by Reuters and data from Commodity Futures Trading Commission released on Friday.
The value of the dollar's net long position rose to $7.82 billion in the week ended June 20, from $6.48 billion the previous week. The previous week's net long dollar position was the lowest since the third week of August last year.
Last week's interest rate hike by the Federal Reserve along with its hawkish statement have spurred speculators buy back dollars again.
Gold bounces at Long-term support.
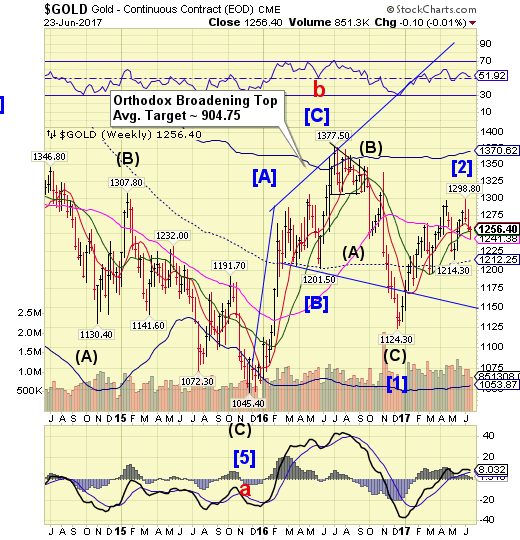
Gold declined to Long-term support at 1241.38 before bouncing to Short-term resistance at 1256.57. The Cycles Model suggests that the expected Master Cycle low may not have occurred yet. This next week may see a decline beneath Long-term support to challenge mid-Cycle support at 1212.25 with a minimum target of 1220.00-1224.00.
Crude slips beneath the Head & Shoulders neckline.
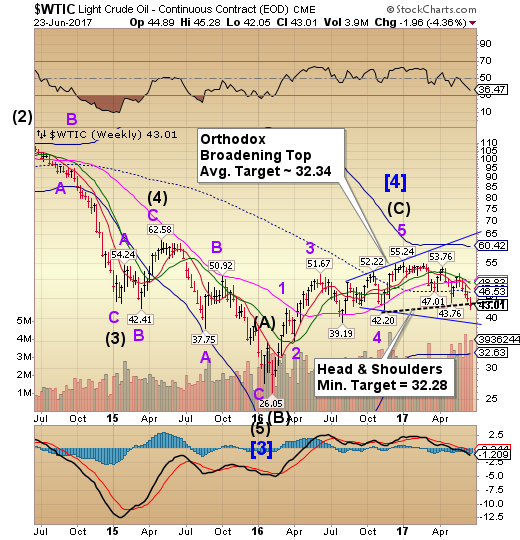
Crude slipped beneath the Head & Shoulders neckline at 44.00 this week and may be ready for the next leg of its decline. There are now three formations indicating the probable target for the coming decline this Summer.
Crude oil has officially entered a bear market, and Commodities king Dennis Gartman told CNBC the pain is far from over.
In a recent interview, the editor and founder of The Gartman Letter said oil conglomerate OPEC was losing the war on oil, especially in light of the ascension of Saudi Arabia's new crown prince, Mohammed bin Salman. Crude oil is down nearly 20 percent in 2017, and is tracking for its biggest six-month drop since the late 1990s.
Gartman said:
He understands that crude oil, over the course of the next 20 to 40 years, is going to be a worthless commodity. It will be supplanted by something else.
Shanghai Index challenges Intermediate-term resistance.
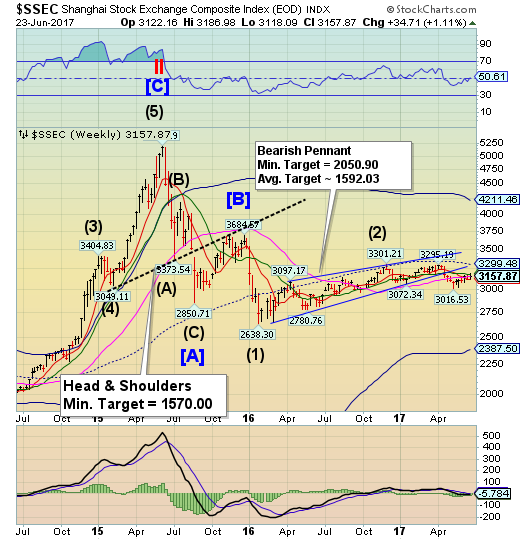
The Shanghai Index attempted a challenge of Intermediate-term resistance at 3175.48, but closed beneath it. The Shanghai Index appears to have completed a rather flat correction. The potential for a sharp sell-off is rising.
For the 10th day in a row, China's bond yield curve remains inverted (the longest in history).
With yields at 3-year highs, corporate bond issuance is evaporating, and has now emerged as the latest major, and most imminent, threat facing China's financial sector and $10 trillion corporate debt market.
However, it appears Chinese authorities have reached their max pain point.
In a very symbolic move overnight, China's Ministry of Finance bought 1.26 billion yuan of 1-year bonds for the first time in history via the secondary market.
The Banking Index completes its correction.
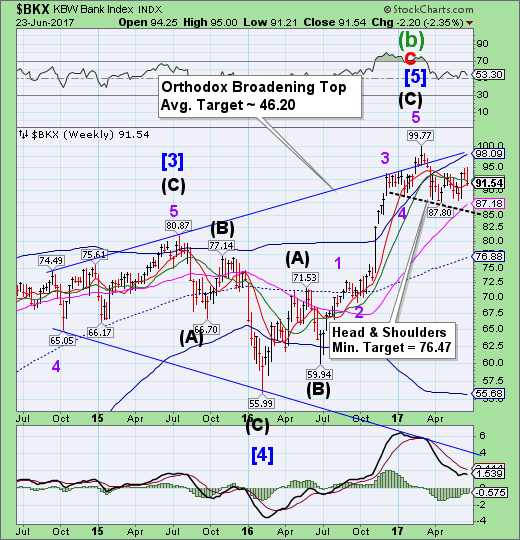
BKX appears to have made its final rally high on Monday before declining beneath Intermediate-term support at 92.11. The sell signal has been activated again. The expected weakness may develop as BKX declines beneath its Short-term support at 91.43.
Vermont Senator Bernie Sanders and his wife Jane have lawyer'd up amid an FBI investigation into a loan obtained to expand Burlington College while she was its president.
As we noted just over a year ago, Burlington College, a small Vermont private school once led by the wife of Democratic presidential candidate Bernie Sanders, said Monday it will close later this month, citing "the crushing weight" of debt incurred during the presidency of Jane Sanders who was in charge of the college until 2011.
ECB shuts down Veneto Banca and Banca Popolare di Vicenza.
When banks fail and regulators decide to liquidate them, it happens on Friday evening so that there is a weekend to clean up the mess. And this is what happened in Italy – with two banks!
It’s over for the two banks that have been prominent zombies in the Italian banking crisis: Veneto Banca and Banca Popolare di Vicenza, in northeastern Italy.
The banks have combined assets of €60 billion, a good part of which are toxic and no one wanted to touch them. They already received a bailout but more would have been required, and given the uncertainty and the messiness of their books, nothing was forthcoming, and the ECB which regulates them lost its patience.
Australian bankers are furious after the country’s smallest state levied a “surprise” tax on the country’s five biggest banks that could siphon off $280 million in profits during its first four years on the books, according to Reuters. The tax was imposed by South Australia, which is struggling with the country’s highest unemployment rate and thanks the banks should be doing more to pitch in.
Major central banks should press ahead with interest rate increases, the Bank for International Settlements said on Sunday, while recognizing that some turbulence in financial markets will have to be negotiated along the way.
The BIS, an umbrella body for leading central banks, said in one of its most upbeat annual reports for years that global growth could soon be back at long-term average levels after a sharp improvement in sentiment over the past year.
Though pockets of risk remain because of high debt levels, low productivity growth and dwindling policy firepower, the BIS said policymakers should take advantage of the improving economic outlook and its surprisingly negligible effect on inflation to accelerate the "great unwinding" of quantitative easing programs and record low interest rates.
