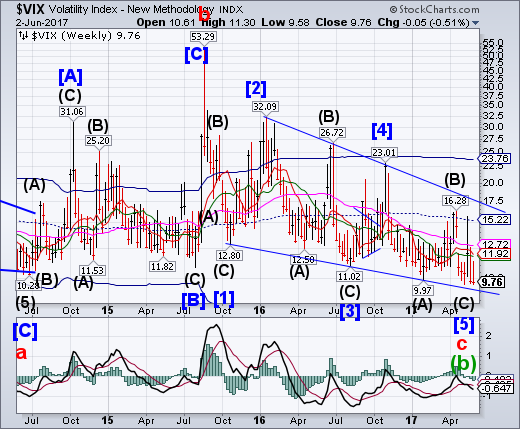
VIX declined to challenge the May 9 low, but did not exceed it. Today’s low qualifies as a retracement low and potentially opens the door for new highs.A rally above mid-Cycle resistance at 15.22 implies that VIX may challenge its Ending Diagonal at 17.50 in the next move.
The CBOE Volatility Index (VIX) is often called the "fear gauge," because market watchers use it to measure expected volatility over the coming 30 days. According to a recent paper by John Griffin and Amin Shams of the University of Texas at Austin, however, the VIX may reflect something besides fear: the authors' findings suggest that traders have their finger on the scale.
SPX throws over its trendline.
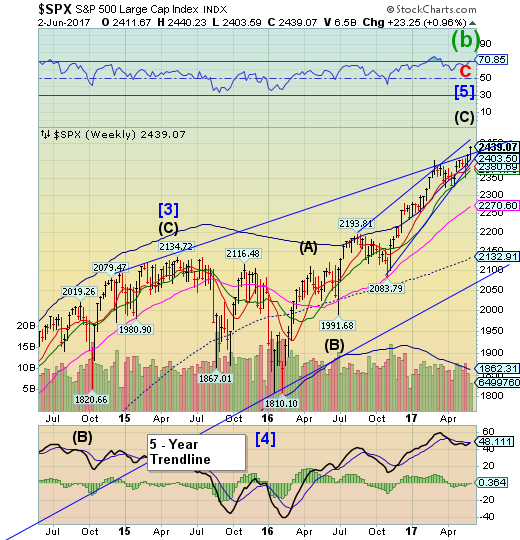
SPX made a throw-over above the upper trendline of its 5-year Ending Diagonal formation.The throw-over may be the final phase of the rally. SPX is fast approaching an important 8.6-year Cyclical interval that suggests a potential Super Cycle turn may be at hand.
The bulls are back in charge after a second weekly advance pushed the S&P 500 Index to a fresh record. But look a little more closely and the signs of unease in the stock market are hard to ignore.
It’s visible in fund flows, where investors are rotating from U.S. stocks to the rest of the world at the fastest pace in two years. And short sellers are getting aggressive, raising bearish bets in three of the past four months.
NDX rallies to another all-time high.
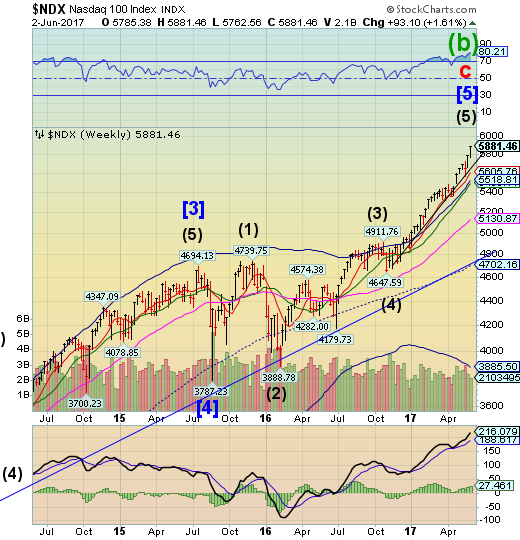
NDX posted another new all-time high today. The extension continues in hyperdrive, seemingly unabated. A decline beneath Short-term support and the trendline at 5605.76 may suggest acorrection is in order.
At this point, the so-called FANG stocks that have led the market to new highs look unstoppable.
They have even won over Wall Street's biggest equity bear.
And he's not holding back his optimism. The collective group of Facebook (NASDAQ:FB), Apple (NASDAQ:AAPL), Netflix (NASDAQ:NFLX), and Google (NASDAQ:GOOGL) could gain up to 40% over the second half of 2017, says Tom Lee, the managing partner and head of research at Fundstrat.
Unconvinced by forecasts for market-wide earnings growth, Lee sees the group of tech titans continuing to deliver profit expansion, which should allow them to keep outperforming. The companies are also mostly immune to wage inflation, improving their future prospects, he says.
High Yield Bond Index test Intermediate-term support.
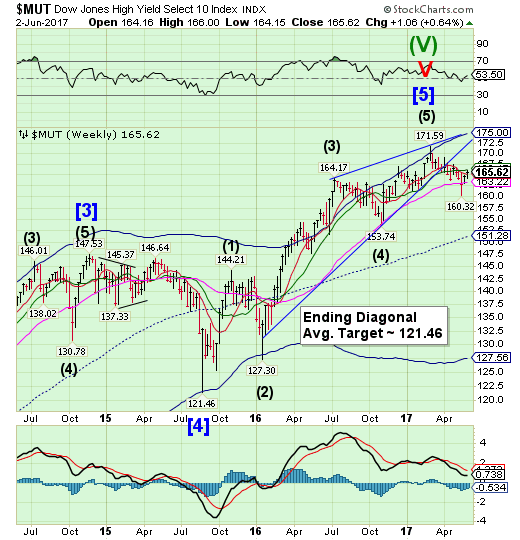
The High Yield Bond Index continued its bounce above Long-term support at 163.22 while testing Intermediate-term resistance at 166.17.It remains on a sell signal, but must decline back beneath Long-term support to confirm it.The Cycles Model suggests weakness may resume next week.
There is a significant difference in the perception of ‘junk’ and something called ‘high yield’. However, in the world of fixed income they are the exact same thing.
High yield debt refers to anything that is below investment grade, otherwise known as ‘junk status’, typically including a range of corporations that do not have the strength to their balance sheet to be considered above the threshold by the rating agencies – for S&P, ‘junk’ is BB or lower.
USB gaps up to Long-term resistance.
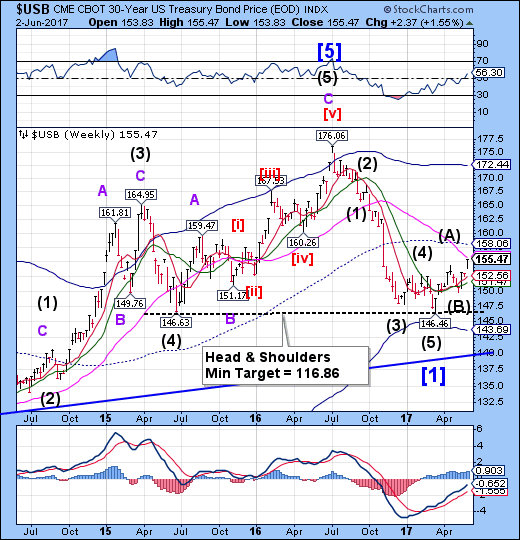
The Long Bond broke out, gapping above its April high to challenge Long-term resistance at 155.71. It is now due for a pullback or consolidation that may be over as early as next week.
Treasury yields slumped on Friday as a weaker-than-expected nonfarm-payrolls number triggered a rally in prices of U.S. government paper, casting doubts on growth expectations for the U.S. economy.
The yield on the 10-Year Treasury note plummeted 5.8 basis points to 2.159%, the lowest since Nov. 10, erasing nearly all the gains seen since Donald Trump's presidential election victory. Bond prices move in the opposite direction of yields; one basis point is one hundredth of a percentage point.
Yields for long-dated U.S. government paper plummeted after the Bureau of Labor Statistics said the economy added 138,000 new jobs in May, falling short of the 185,000 expected by economists polled by MarketWatch. Investors said the weak reading was a reflection of the low unemployment rate, which fell from 4.4% to 4.3%, leaving the labor market at its tightest since 2001. Hourly earnings also gained 0.2%.
The euro setting up for a fall?
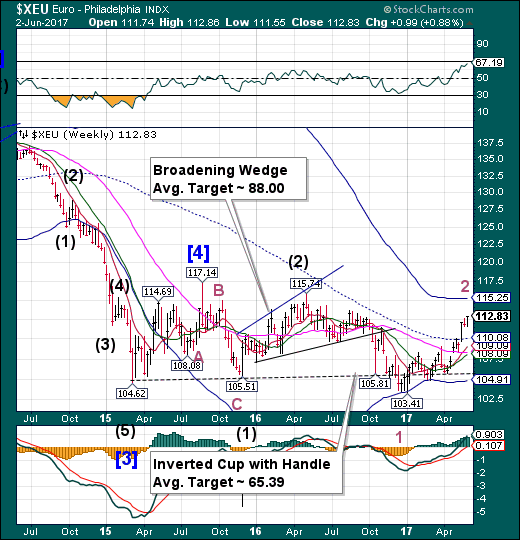
The euro appears to have overstayed a period of Cyclical strength, but still could not challenge its Cycle Top resistance at 115.25. The reversal from the high may be unusually strong and fast, since it must make a Master Cycle low in the next two weeks.
The Financial Times tells us that hedge funds are turning positive on the euro for the first time since 2014.
Euro Stoxx bounces from Short-term support and trendline.
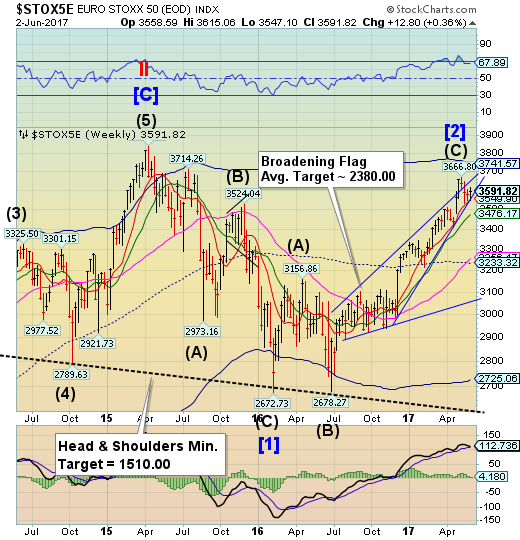
The Euro Stoxx 50 Index bounced off its Short-term support and Diagonal trendline at 3549.90 again this week. The bounce may not last, as a breakdown may occurin the next week.
European stocks rose for a second day as a rally in carmakers and chemical companies outweighed decline in raw-material producers.
The Stoxx Europe 600 Index gained 0.2 percent at the close of trading. The gauge jumped as much as 0.8 percent earlier, paring gains after the release of data showing U.S. monthly payrolls increased less than projected. The benchmark added 0.3 percent in the five days through Friday, ending a two-week streak of declines.
The yen resumes its rally.
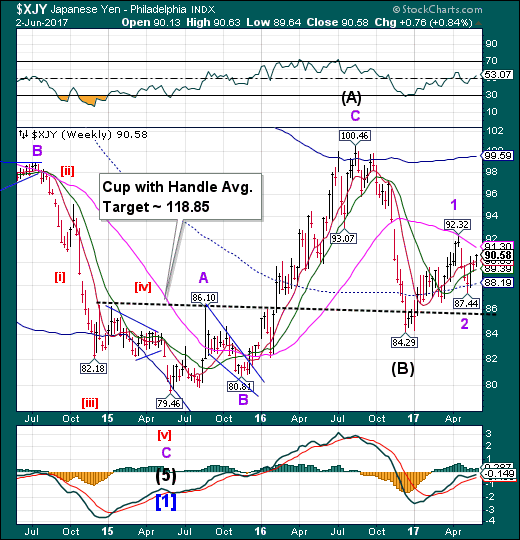
The yen broke through weekly Short-term resistance to break above its May 18 high. The Cycles Model suggests that Cyclical strength may continue into the month of June before a significant pullback. A test of Long-term resistance at 91.30 may be next on the agenda.
The media still sees the yen as weak as noted in today’s Financial Times.
The Nikkei finally breaks above 20000.
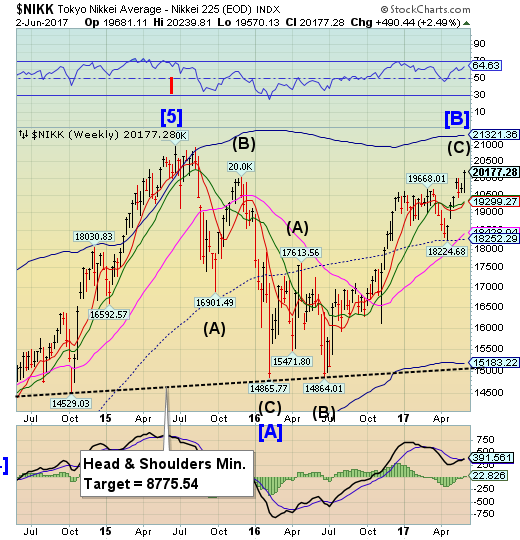
The Nikkei broke above 20000.00in what may be a short-lived spike as its period of strength may have just ended. The Cycles Model suggests a probable two weeks of decline ahead. A sell signal may be generated beneath 19450.00. Further loss of Short-term support at 19299.27 may confirm the decline.
The Nikkei 225 Stock Average breached 20,000 for the first time since December 2015, as a weaker yen and positive economic data fueled a rally that’s lured foreign investors back to the world’s third-largest market.
The Nikkei 225 rose 1.6 percent to close at 20,177.28, bringing its gain since an April low to 11 percent. The rally came as the nation’s corporate profits climbed to a record and attracted foreign investors, who snapped up more than $13 billion in Japanese stocks in eight straight weeks through May 26 after being net sellers earlier in the year. Data released this week showed Japan’s unemployment rate heldat a two-decade low, and capital spending for the first quarter of the year topped estimates.
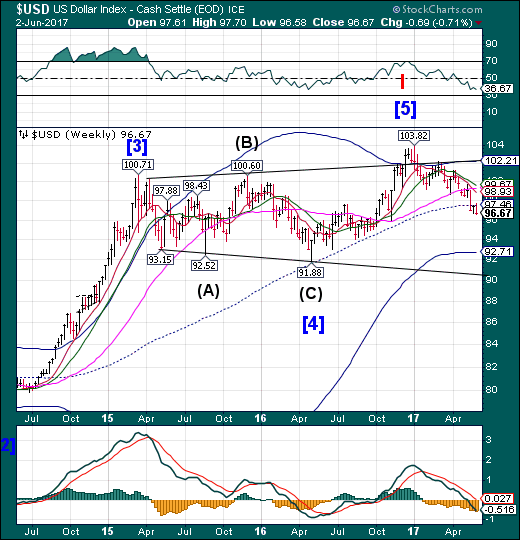
USD appears to have failed the test at mid-Cycle resistance, thereafter making a new low. However, there may be a reprieve as a short-term bottom may be at hand. If so, the anticipated bounce may again retest mid-Cycle resistance. Thereafter, the Cycles Model suggests a possible 7-week decline in USD.
The US dollar dropped to seven-month lows on Friday after data showed the US economy created fewer jobs than expected last month, which could derail a possible interest rate hike by the Federal Reserve in the second half of this year.
The greenback fell to seven-month troughs against the euro and Swiss franc, while sliding to a two-week bottom versus the yen.
Data showed that US nonfarm payrolls increased just 138,000 last month as the manufacturing, government and retail sectors lost jobs. The consensus forecast had been 185,000 new jobs.
Gold retests Broadening Wedge trendline.
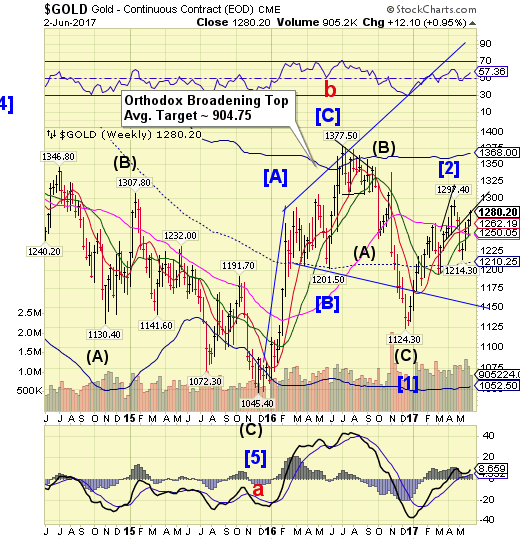
Gold extended its rally to the lower trendline of the Broadening Wedge formation, making an82% retracement. All of the extension occurred on Friday. The Cycles Model suggests 2-3 weeks of probable decline ahead.
Gold prices rose to a nearsix-week high on Friday in response to disappointing U.S. non-farm payrolls data that lowered expectations for moreaggressive U.S. interest rate increases.
Data showed that U.S. job growth slowed in May and employment gains in the prior two months were not as strong aspreviously reported, suggesting the labour market was losing.
A slow recovery in the world's biggest economy dents the likelihood for higher interest rates which benefits non-interest yielding and safe-haven gold.
Spot gold rose 0.7 percent to $1,274.39 an ounceat 1440 GMT, its highest since April 25, headed for its fourthweek of gains
Crude testing mid-Cycle support.
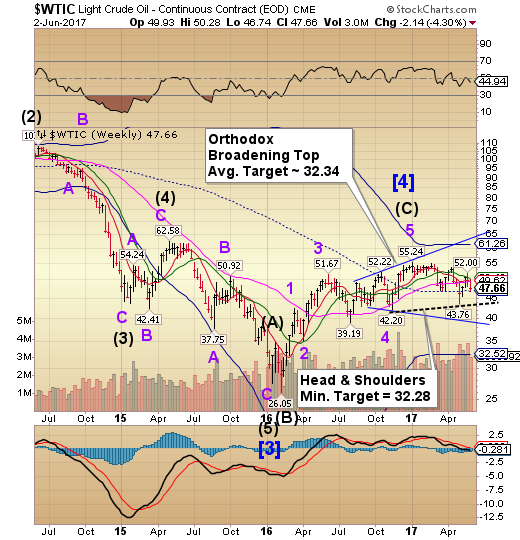
Crude declined to mid-Cycle support at 46.89 on Friday. It may bounce to Long-term resistance at 49.65 before resuming its decline. There are now three formations indicating the probable target for the coming declinelater this Summer.
Oil prices fell more than 1 percent on Friday, posting a second straight week of losses, on worries that U.S. President Donald Trump's decision to abandon a climate pact could spark more crude drilling in the United States, worsening a global glut.
- futures settled 77 cents, or 1.5 percent, lower at $47.66 per barrel. Benchmark Brent crude futures were trading at $50.10 a barrel by 3:39 p.m. ET (1939 GMT), down 53 cents, or 1.1 percent.
Both contracts were down about 4 percent on the week.
Shanghai Index remains stubbornly beneath Long-term resistance.
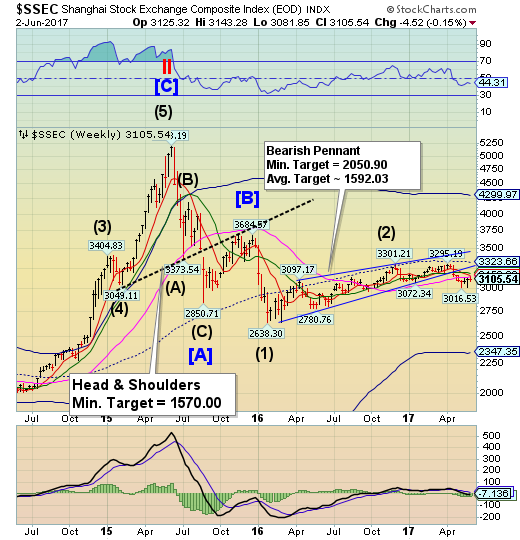
The Shanghai Index again challenged Long-term support/resistance at 3142.50, but closed beneath it. This action leaves the Shanghai Index weak and “accident prone” over the next two weeks. Attempts to limit the decline may be set up for failure.
Back in 2014, a scandal erupted when media reports confirmed what many had previously speculated about China's banking system: namely that much of China's staggering loan issuance had been built (literally) upon air and that billions (or trillions) in loan collateral had been "rehypothecated" between two, three or many more debtors - or never even existed - forcing banks to accept that they would never recover much if any of the pledged collateral - in most cases various commodities - if the economy were to suffer a hard-landing resulting in mass defaults. The most famous example involved collateral fraud at China's 3rd largest port, Qingdao, where numerous borrowers were found to have "pledged" the same collateral of steel and copper to obtain funding from various banks.
The Banking Index declines toward the neckline.
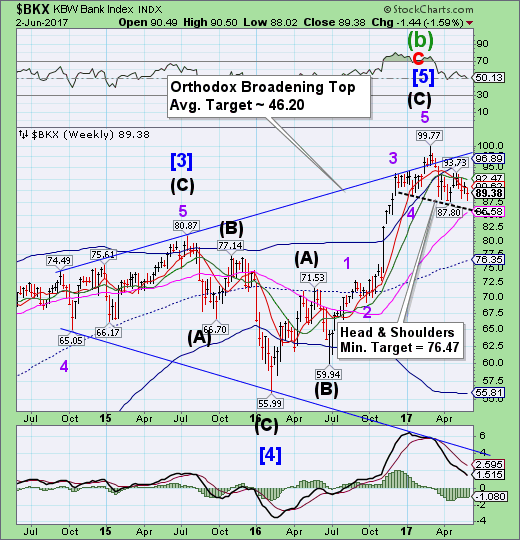
BKX weakened this week as it declined toward the Head & Shoulders neckline and Long-term support at 86.58. The sell signal remains in place with a probable new target near mid-Cycle support at 76.35. Serious investors may be well served to sell any rally rather than buy the dip, as the decline may intensify imminently.
Italy may have no time to rest on its laurels after brokering a deal to keep Banca Monte deiPaschi di Siena SpA in business.
While an “in principle” agreement between Finance Minister Pier Carlo Padoan and European Union Competition Commissioner Margrethe Vestager will help save the world’s oldest bank through paving the way for a precautionary recapitalization, the fate of two regional lenders in one of the country’s wealthiest regions and a third smaller bank has yet to be decided.
The government -- seeking to save Banca Popolare di Vicenza SpA and Veneto Banca SpA -- plans to contact businessmen in the Veneto region where they’re based to help fund a rescue, appealing to local loyalties to avert winding them down. That came after the EU rejected the banks’ request to reduce the 1 billion euros ($1.1 billion) of private capital it’s requiring them to raise to get approval for a bailout, people with knowledge of the matter have said.
After months of "smoking guns" and conspiracy theory dismissals, a Singapore-based Deutsche Bank (DE:DBKGn) trader (at the center of fraud allegations) finally confirmed (by admitting guilt) what many have suspected - the biggest banks in the world have conspired to rig precious metals markets.
The Deutsche Bank trader, David Liew, pleaded guilty in federal court in Chicago to conspiring to spoof gold, silver, platinum and palladium futures, according to court papers. Bloomberg notes that spoofing involves traders placing orders that they never intend to fill, in an attempt to manipulate the price.
Even as attention has turned once again to Italy as the next possible source of European financial contagion, Spain's sixth largest bank has found itself in freefall over the past few days as concerns grow that the bank may be liquidated unless a last-minute buyer, or source of capital, emerges. In addition to the shares of Banco Popular crashing as much as 27%, the biggest intraday drop since 1989, its perpetual bonds have likewise been in freefall mode as investors liquidate securities which "they do not want to hold going into the weekend", according to Ignacio Cantos, of ATL Capital in Madrid, quoted by Bloomberg.
Despite The Fed's hype and the market's hope, data released this morning is flashing a big red warning sign that economic growth may soften ahead - borrowing by small U.S. firms dropped to a six-month low in April.
Reuters reports that the Thomson Reuters/PayNet Small Business Lending Index dropped a third straight month in April to 123.1, down 5 percent from last April and the lowest level since October.
Movements in the index typically correspond with changes in gross domestic product growth a quarter or two ahead, which suggest the spike in small business optimism may fade fast just like the rest of the soft data since the election.
