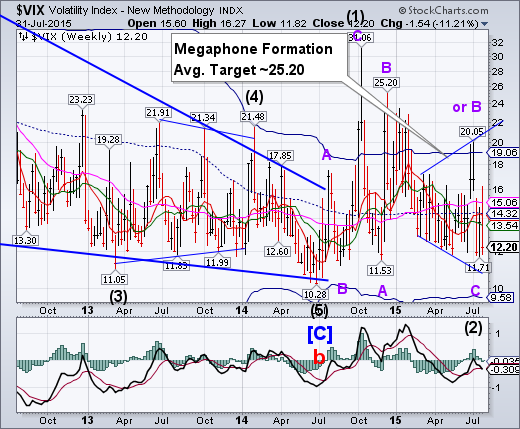
VIX made a reversal pattern this week, but closed near its weekly low.The next move out of a Broadening Bottom or Megaphone formation is to break out above the upper trendline. Its average target matches that of the Wave A top in mid-December
SPX bounces from Long-term support again.
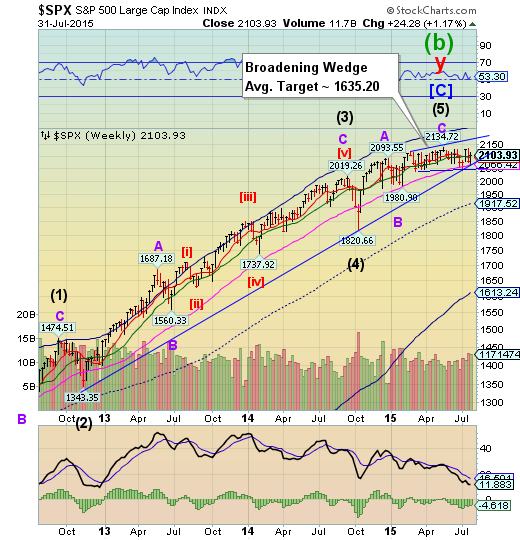
The SPX rallied off its Long-term support at 2066.42. The May 20 high at 2134.72 remains the top of this Cycle. The inability to make a new high appears to be extremely bearish. A break of Long-term support and the 3-year trendline just 2% below the close may be a game changer.
(StreetTalkLive) I had a very interesting conversation with one my colleagues yesterday about the markets and the economy. Essentially, the discussion centered around the markets remaining near their all-time highs as economic data remained soft. Much like the"300" that defended Greece against the massive invading force of Persia, it is only a question of time before the battle is lost.
As I discussed on Monday in "When Will We Ever Learn..."
"The capacity for optimism is seemingly limitless, but the "sting" of failure is quite transient.
While it is in those failures that valuable lessons are taught, studies have shown that humans tend to suppress or substitute new memories over time.
George Santayana once said:"Those who cannot remember the past are condemned to repeat it."
NDX bounces off support.
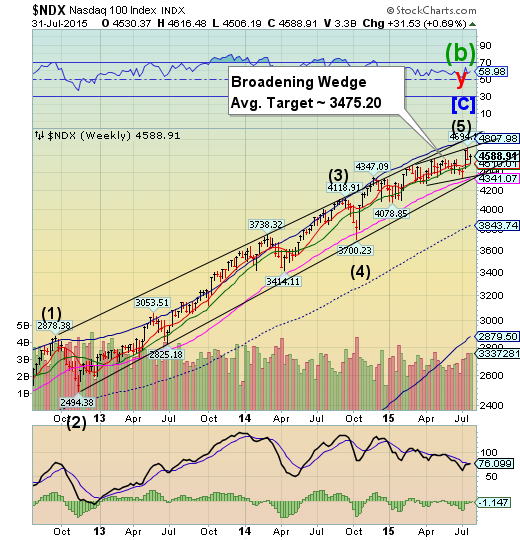
NDX challenged weekly Intermediate-term support at 4510.01 before making a partial retracement. A decline beneath near-term supports puts the Broadening Wedge formation and the three-year trendline in jeopardy. NDX is the investment of choice for retail investors and hedge funds. This week’s move tells us that the bulk of retail investors are still very sanguine about risk.
(ZeroHedge) After a slow first quarter of 2015, the private equity industry experienced a revitalization in Q2-2015. Investment dipped by less than 1 percent to $112 billion, holding strong at the second highest Q2 level since 2007, fundraising fell to $30 billion. Meanwhile, as ValueWalk details, exit volume exploded last quarter to $125 billion - the highest level on record - raising the question: "if everything is so awesome, why are the smartest people in the room selling to the public at the heaviest pace ever?"
High Yield Bonds bounce at the Broadening Wedge.
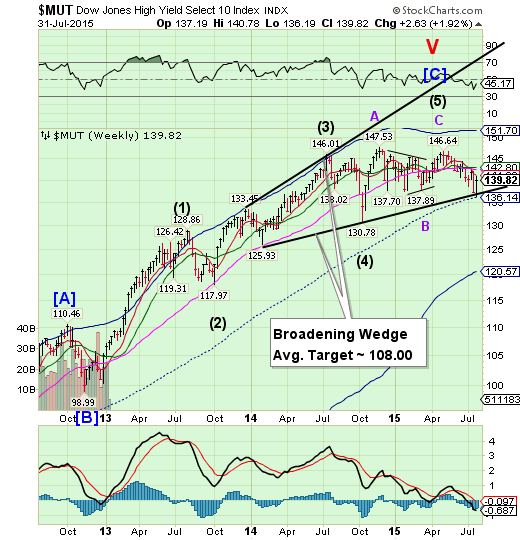
The High Yield Index bounced from the lower trendline of its Broadening Wedge formation and mid-Cycle support at 136.14. It appears that the Master Cycle low was made on July 7, so a bounce was expected. However, it appears that MUT failed to overcome overhead resistance, which may indicate a very serious decline straight ahead. The financing of stock buybacks is being seriously threatened.
(WSJ) Some financial advisers have been trimming their clients’ exposure to high-yield bond exchange-traded funds or cutting it altogether in recent months. They are worried that an interest-rate rise could trigger a rush for the exits that might exacerbate current liquidity issues in the market for below-investment-grade debt.
After seven years of low rates, “we are in uncharted water” as to how quickly the Federal Reserve will raise rates and how quickly that will affect the value of current income holdings, says Michael Johnson, a broker with Raymond James Financial Services Inc., in Elm Grove, Wis. He says he wants to proceed carefully “and have a life vest nearby.”
The euro bounces, testing overhead resistance.
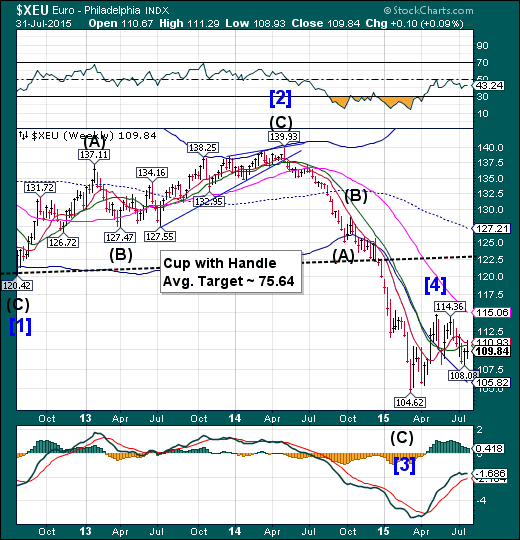
Every once in a while, an index will bounce where there seems to be no support only to challenge overhead resistance. The euro did just that, this week. Last week, the euro made a Trading Cycle low. This week, Short-term resistance was challenged without success, and it appears that the decline may have already resumed.
(Reuters) Prime Minister Alexis Tsipras acknowledged on Friday that his government had made covert contingency plans in case Greece was forced out of the euro, but rejected accusations that he had plotted a return to the drachma.
Tsipras was forced to respond to the issue in parliament after former finance minister Yanis Varoufakis this week revealed efforts to hack into citizens' tax codes to create a parallel payment system, prompting shock and outrage in Greece.
The disclosure heaped new pressure on Tsipras, who is also battling a rebellion within his Syriza party and starting tough talks with the European Union and International Monetary Fund to seal a third bailout program in less than three weeks.
EuroStoxx is stopped by Intermediate-term resistance.
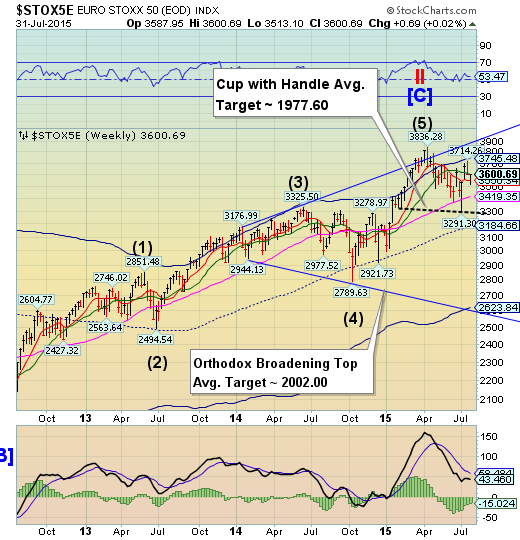
Euro Stoxx 50 fell beneath weekly Intermediate-term support/resistance at 3602.70, closing beneath it at the end of the week. The Cycles Model suggests weakness through the end of August. Should Long-term support at 3419.35 be broken, a panic decline may result.
(MarketWatch) European stock indexes notched gains Friday, while the euro rose after the release of inflation figures for the eurozone that may help the European Central Bank chart its next move.
After spending much of the session switching between small gains and losses, the Stoxx Europe 600 SXXP, +0.03% finished up less than 1 point at 396.37.
The pan-European index closed with a weekly gain of 0.4%. It also rose 4% in July, the best monthly performance since February. The monthly gain came during a frenetic pace of developments surrounding Greece’s debt crisis that eventually led to a restart in negotiations aimed at Greece receiving a third bailout package.
The yen may be due for another low.
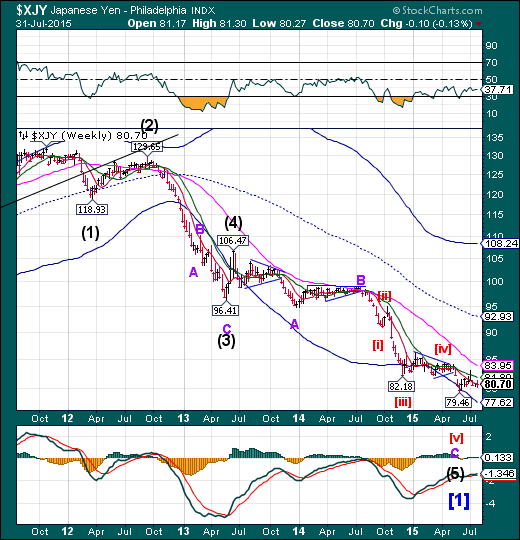
The yen may be due for a Master Cycle low as early as next week. If so, it may emerge to challenge its Cycle Top at 108.24 through the month of August.
The Nikkei slips under Cycle Top resistance.
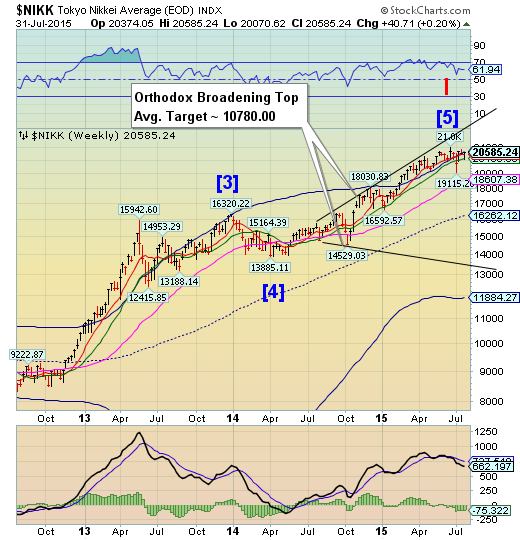
The Nikkei slipped under its Cycle Top at 20639.98, as the rally ran out of steam last week. The period of strength appears to have ended. A break of Intermediate-term support at 20384.60 puts the Nikkei in a potential downtrend for the entire month of August.
(Reuters) - Japan's Nikkei share average was little changed on Friday, as investors awaited more earnings from blue-chip companies and looked for signs of whether China's volatile stock markets were starting to take a toll on its economy.
The Nikkei share average was flat at 20,526.84 points by mid-morning, after traversing positive and negative territory. For the week, the index has been flat while it looks set for a gain of 1.5 percent for the month.
U.S. dollar tests Model supports.
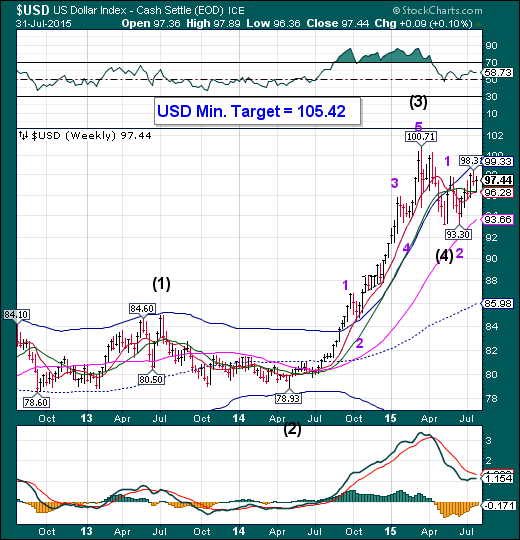
The US dollar tested Short-and-Intermediate-term supports at 96.28 in a minor retracement before closing marginally higher for the week. This is a natural pullback that “locks in” the progress made thus far. The Cycles suggest the rally continues for at least another week in a very strong push higher.
(Reuters) The dollar touched one-week highs and shorter-term U.S. Treasury yields rose on Thursday as accelerating U.S. gross domestic product data encouraged bets policymakers will start hiking U.S. interest rates as soon as September.
Wall Street ended mostly higher but gains were muted by soft corporate earnings. Oil prices surrendered early increases and declined under the weight of the rising dollar.
USB rallies through resistance.
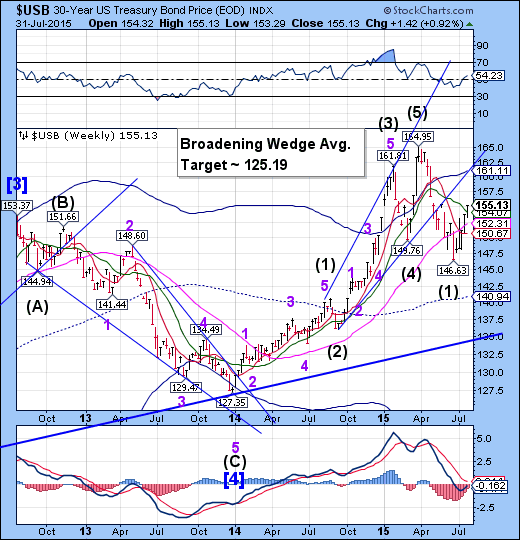
The Long Bond continued its rally through Intermediate-term resistance at 154.07 this week. This is an indication of liquidity flowing from stocks and overseas investors to Treasuries. It appears that the strength in treasuries may last another week before the next consolidation takes hold.
(NASDAQ) U.S. Treasury bonds rallied broadly Friday as a lackluster wage inflation gauge clouded investors' perception of the likeliness of an interest-rate increase by the Federal Reserve in September.
Friday's price gain capped the biggest monthly rally for the benchmark 10-year note since January. July was the first month the note strengthened since March.
The yield on the benchmark 10-year Treasury note fell to 2.207% on Friday from 2.268% on Thursday and 2.335% at the end of June. It marks the yield's lowest closing level since July 8. Yields fall as prices rise.
Gold tests trendline resistance.
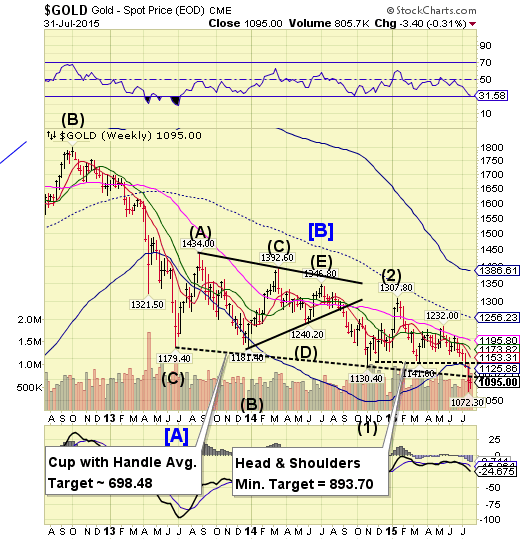
Gold retested the trendline known as the Lip of a Cup with Handle formation, closing beneath it. The Cycles Model now suggests a further decline that may last up to a week. This decline may be one for the records.
(WSJ) Gold futures posted their steepest monthly decline since June 2013 after investors slashed gold holdings in anticipation of higher interest rates in the U.S.
On Friday, prices rose as the dollar lost ground to foreign currencies, burnishing the metal’s allure to foreign buyers.
The most actively traded contract, for December delivery, settled up $6.40, or 0.6%, at $1,095.10 a troy ounce on the Comex division of the New York Mercantile Exchange.
The contract fell 6.7% this month and rose 0.7% this week.
Crude decline continues.
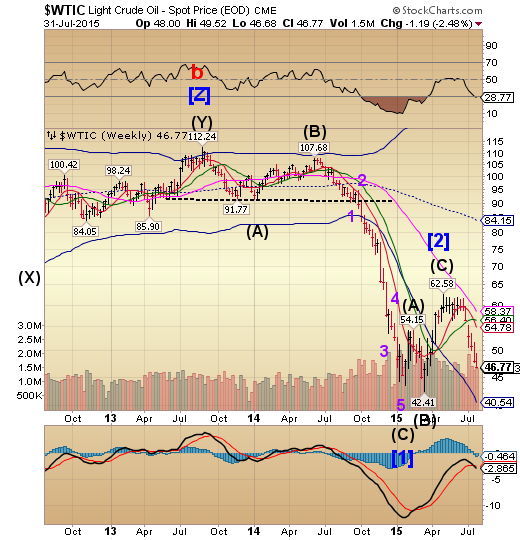
Crude made a brief consolidation last week, but closed near its lows, suggesting more downside is due. The decline appears to be capable of lasting another week or longer, according to the Cycles Model.
(CNBC) Oil saw its worst monthly drop since the 2008 financial crisis after signs that top producers in the Middle East were continuing to pump at record levels despite a growing global gut.
A higher U.S. oil rig count for a second week in a row added to the market's downside. Uncertainty ahead of key U.S. oil production and rig count data due later in the day also weighed on prices, despite a weaker dollar, which would normally support commodities.
U.S. crude closed down $1.40, or 2.89 percent, at $47.12 a barrel. The contract fell nearly 21 percent for the month of July, marking its largest monthly decline since October 2008, when oil had an epic collapse at the outbreak of the financial crisis. Brent fell 18 percent on the month.
Shanghai Index loses its grip.
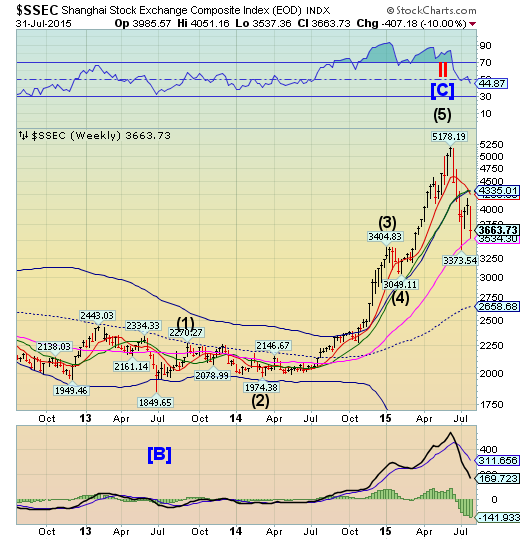
The Shanghai Index completed a 45% retracement of its decline in June, but gave most of it up this week. Should Long-term support at 3534.30 be broken, a panic decline may ensue. A potential long-term target may be as low as 1570.00.
(ZeroHedge) Having claimed 'foreign interests' were "waging an economic war" against China, it was ironic that the most outspoken of Chinese SOEs is now under investigation for 'selling' shares when it was told not to. As Reuters reports, China is extending its dragnet for "malicious sellers" to Hong Kong and Singapore as the witch hunt blame-mongery continues. Rather ominously, the China Securities Regulatory Commission (CSRC) has demanded trading records to try to identify those with net short positions who would profit in case of further falls in China-listed shares, three sources at Chinese brokerages and two at foreign financial institutions said. Even more incredibly, as Bloomberg reports, despite total ignorance by US regulators, China is 'daring' to crackdown on market manipulation via 'spoofing'.
The Banking Index retreats from a new high.
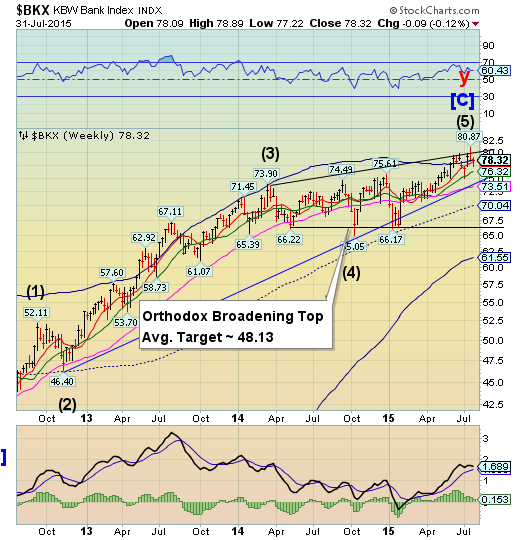
BKX rallied above the upper trendline of its Orthodox Broadening Top last week, but gave up its gains, closing beneath its Cycle Top resistance at 78.53. This usually signals areversal. A loss of Long-term support at 73.51 may confirm the potential change in trend.
(Reuters) - Greece will make it a priority to recapitalise the nation's banks by the end of this year, probably using a bail-out fund to plug capital shortfalls, a Greek central bank official told Reuters on Friday.
"Our number one priority is to avoid a bail-in on Greek banks. If the recapitalisation occurs by the end of this year - this way we will avoid a bail-in," the official said on condition of anonymity.
Greek banks may need as much as 25 billion euros to recapitalise, a shortfall exacerbated by an outflow of deposits. The flood of money leaving the country culminated in authorities imposing capital controls on June 29 to prevent a financial meltdown.
(Mises) You’ve probably read that there is a “war on cash” being waged on various fronts around the world. What exactly does a “war on cash” mean?
It means governments are limiting the use of cash and a variety of official-mouthpiece economists are calling for the outright abolition of cash. Authorities are both restricting the amount of cash that can be withdrawn from banks, and limiting what can be purchased with cash.
These limits are broadly called “capital controls.”
(ZeroHedge) Earlier today, the SNB, which is perhaps the most transparent hedge fund of all central banks and actually lays out its financial statements in a respectable manner every quarter, released its results for the second quarter (and first half) of 2015. The result: another absolutely epic loss, amounting to €50.1 billion ($51.8 billion) of which €47.2 billion on currency positions - a whopping 7% of Swiss GDP - meaning that in Q2 the SNB lost another €20 billion, even though the CHF crosses barely registered any of the mammoth moves experienced in the first quarter, suggesting that the SNB was hit by the double whammy of its own currency devaluation in Q1, followed by the launch of ECB's QE which crushed the EUR in Q2, and which happens to be the currency in which the bulk of SNB FX holdings are denominated.
