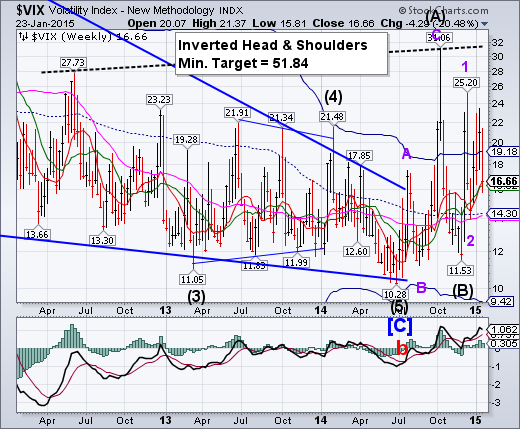
-- VIX continued to challenge its Cycle Top resistance at 19.18but closed above it. Fortunately, it closed above both Intermediate-term support at 16.32 and Short-term support at 16.62. The Cycles Model suggests a probable rally top by the end of January or early February. It may get very exciting.
SPX continues its sideways consolidation.
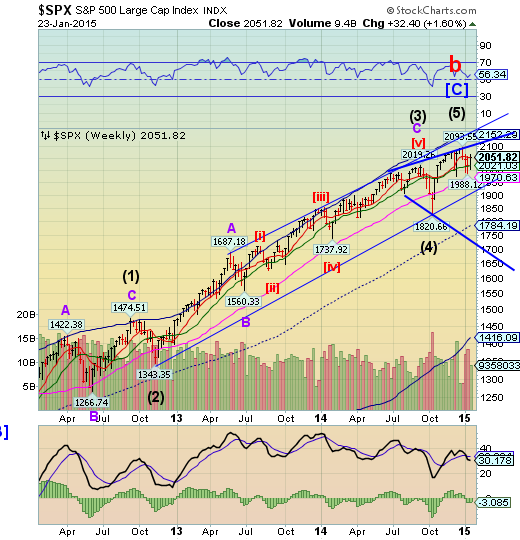
SPX continued its sideways consolidation between Intermediate-term support at 2021.03 and Short-term resistance at 2053.21, closing beneath it. It appears to be progressing within the Orthodox Broadening Top pattern with Point 6 in its sights, beneath its lower trendline near 1700.00.The unpegging of the Swiss franc sent investors scurrying into stocks, but met with overhead resistance without making new highs. The depth of the probable decline that follows may give us some indication of what to expect during the rest of 2015.
(ZeroHedge) On the surface, despite concerns about the adverse impact from the strong dollar and crashing energy earnings, so far the fourth quarter is shaping up quite strong. Indeed, as CNBC won't stop repeating, with 7% of the companies in the S&P 500 reporting actual results for Q4 to date, more companies are reporting both actual EPS above estimates (84%) and actual sales above estimates (60%) compared to recent historical averages. Of course, this only works courtesy of the endless guide-down game that analysts and corporate CFOs play year after year, in their appeal to gullible investors that companies are actually doing better than expected…
NDX had a strong week, but no new high.
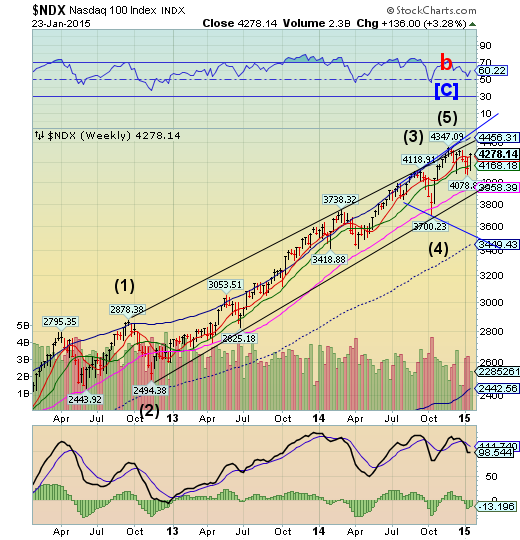
NDX had a strong week, closing above weekly Short-term support/resistance at 4256.48. It appears to be taking a detour within the Orthodox Broadening Top pattern that signals a major change in trend may be underway.
(ZeroHedge) Who could have seen that coming? It appears that for all the bluster that the US economy could somehow decouple from the rest of the world's demise (when as always it is simply and timing issue - lagged response), America's manufacturing renaissance is dying. Markit's US Manufacturing PMI printed 53.7 in January, missed expectations of 54.0 falling for the 5th month in a row to the lowest in 12 months.
High Yield trapped between Long-term support and Short-term resistance.
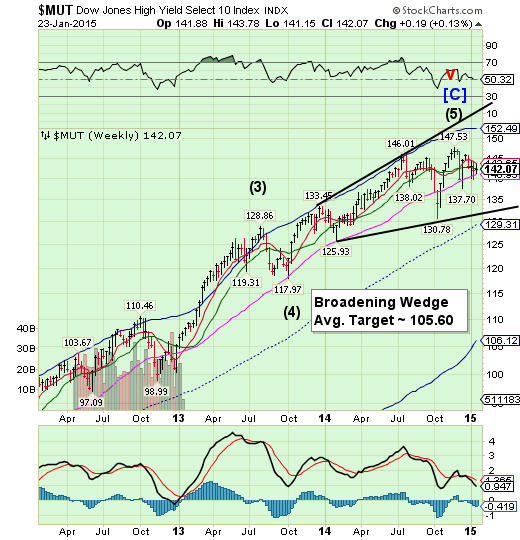
The High Yield Index had an inside week, closing beneath its weekly Short-term resistance at 143.65 and above weekly Long-term support at 140.93. A breakout or breakdown will give the index its directionality.The Broadening Wedge formation also plays a significant role in future expectations.A decline beneath the lower trendline puts MUT in motion toward its first target near its Cycle Bottom at 106.12.
(Investment News) The promise of yet another trillion-dollar cash infusion from a central bank isn't enough to bring individual investors back into the market for risky corporate debt. In fact, they keep bailing.
Investors pulled $523 million from global high-yield bond mutual and exchange-traded funds in the week ended Jan. 21, according to data compiled by EPFR Global. They withdrew $868 million from funds that buy U.S. speculative-grade loans, bringing their total assets below $100 billion for the first time since September 2013, Wells Fargo & Company (NYSE:WFC) data show.
The euro continues its free-fall.
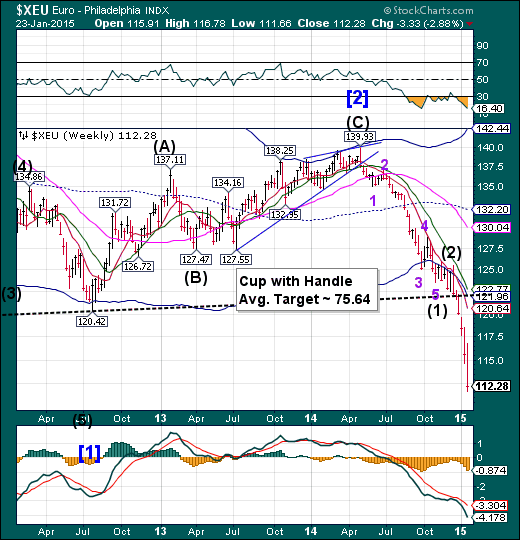
The euro progression toward parity with the US dollar gained intensity this week. The euro may not expect its next Master Cycle low until early February, so it may fall quite a distance in the interim. With no supports, the euro is now in a panic decline.We may see parity between the euro and the dollar before this is over.
(ZeroHedge) A crashing yen failed to help Japan or fix its economy, but while Japan may now be a lost cause, the Keynesian masterminds of the world will give it another try, and following today's Draghi's announcement, the EUR/USD has crashed to the lowest level since 2003, tumbling over 200 pips, and printing below 1.14 moments ago.
And since it is a zero-trade sum world, now that the exports of Europe - the single largest economic block in the world - are cheap enough to compete with Japan's just as cheap, thanks to currency debasement, goods and services in the global arena, it means that the biggest loser is obvious: the United States, whose currency has soared to nosebleed levels on expectations that the Fed will hike and that the US will somehow decouple from a world that is drowning in economic malaise.
The unpegged Swissie sends EuroStoxx 50 to new highs.
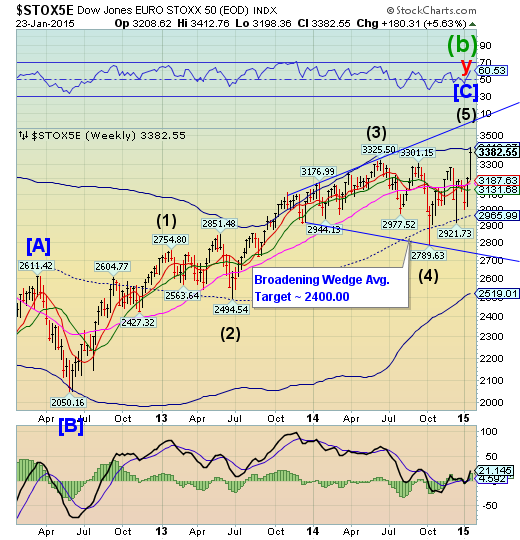
The EuroStoxx 50 Index got a boost from investors caught wrong-sided shorting the Swiss franc. Taking the Swiss franc off its peg with the euro drove many currency traders back into stocks. Last week’s question, “How high will it go?”is being answered. It appears that the rally may have been turned back at the weekly Cycle Top resistance at 3412.97. It is still uncertain whether it may go higher. Bt the Cycle Model suggests, “not.”
(ZeroHedge) For the most succinct, and most cynical, take on yesterday's ECB QE announcement we go to Deutsche Bank which 7 years after the grand money printing experiment started, has thrown in the towel on spinning the now annual CTRL-P ritual, and - in a nutshell - says: QE will fail to do anything but boost stocks, so may as well buy stocks.
(Ed.) The question is, are they talking their book?
The yen finds support at its Cycle Bottom.
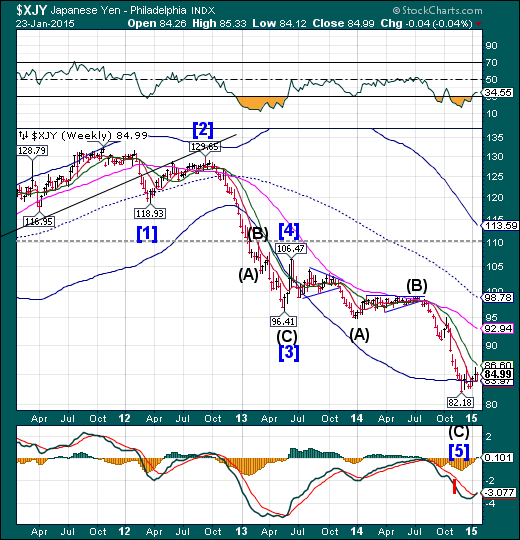
The yen finally achieved weekly support at its Cycle Bottom at 83.97. It has yet to overcome its December 16 high at 86.34. Once the breakout occurs, the yen may gain momentum in its rally, since most traders have not recognized a change of trend…yet.
(Bloomberg) Margin traders in Japan raised bets the yen would fall against the dollar to a record amid their currency’s best start to a year since 2010.
Wagers from individuals for the Japanese currency to decline outnumbered bets it would gain by 522,856 contracts on Jan. 15, the biggest net shorts since Tokyo Financial Exchange Inc.’s Click 365 began collecting the data in 2006. The figure more than doubled since Sept. 30 as the Bank of Japan’s unexpected Oct. 31 decision to expand bond purchases, known as quantitative easing, drove the yen to an 8 1/2-year low in 2014.
The Nikkei bounced off its lower trendline.
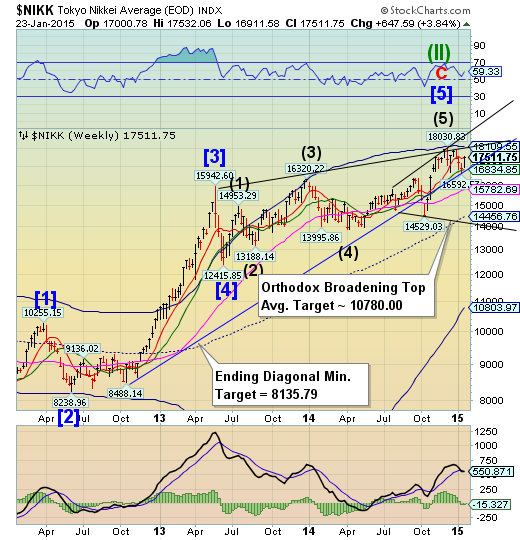
The Nikkei bounced above its Ending Diagonal trendline and weekly Intermediate-term support at 16834.85, closing just beneath its Short-term resistance at 17648.52. The Orthodox Broadening Top also plays a role in this reversal, representing a market that is out of control and has a highly emotional public participation. A loss of support of the Ending diagonal and Intermediate-term support trendline at 16834.85 may be the start of a dramatic decline that is imminently due.
(ZeroHedge) The Ministry of Finance just reported that Japan bought JPY 657 billion (over $5.6 billion) of foreign stocks last week. That is the biggest weekly purchase of foreign equities since records began in 2001. The huge size of the purchases- more than double the average size of recent weekly purchases - appears to have been 'spent' on European stocks (and perhaps some Chinese). It is unclear whether this is direct buying by the banks as a proxy for The BoJ's quid pro quo or merely front-running this week's exuberance from Draghi by Mrs.Watanabe now that her Swissy trade exploded...
U.S. dollar rally in high gear.
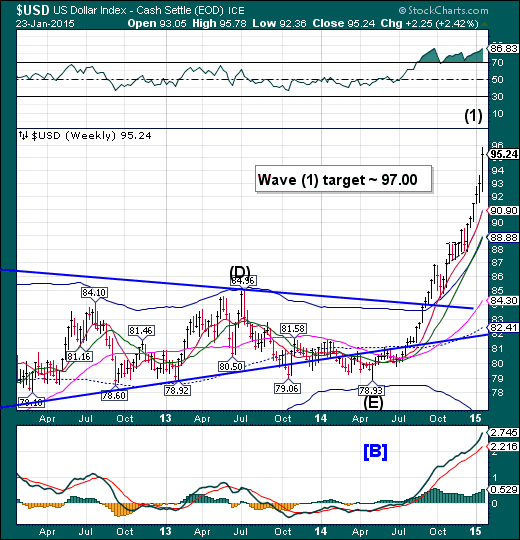
The US dollar notched up the intensity of its rally. It now appears to have a near-term target near 97.00. The Cycles Model suggests that there may be a Primary Cycle high due at the end of January or the first week of February.A sharp retracement may follow, lasting approximately 3-4 weeks.
(Reuters) - Speculators slightly trimmed bets in favor of the U.S. dollar in the latest week, and bolstered net shorts on the euro to their largest level in 2 -1/2 years, according to data from the Commodity Futures Trading Commission released on Friday.
The value of the dollar's net long position inched lower to $46.22 billion in the week ended Jan. 20, from $46.96 billion the previous week. Despite the slight decline, net long dollars have hit at least $40 billion for a fourth straight week.
To be long a currency is to take a view it will rise, while being short is a bet its value will decline.
USB consolidates.
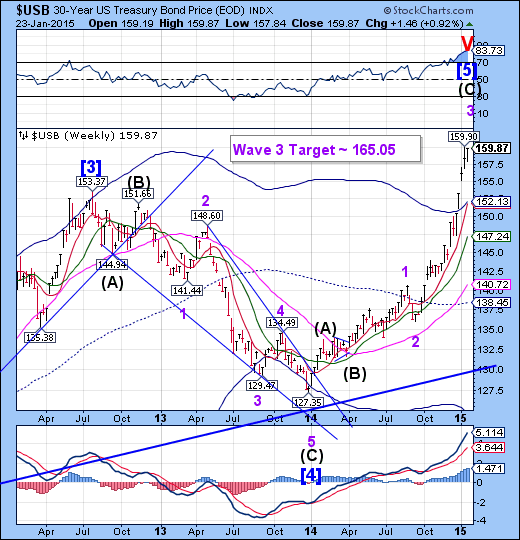
The Long Bond consolidated during an “inside” week.The final thrust higher of Minor Wave 3 may continue through early February.
(WSJ) Government bond yields on both sides of the Atlantic tumbled to historic lows on Friday, the latest ripple from Thursday’s decision by the European Central Bank to support economic growth with a monetary stimulus plan.
The 10-year yields in Germany, France, Belgium, Finland, Austria, the Netherlands, Spain, Italy, Ireland and Portugal all fell to record lows, extending the declines of the past months.
In the U.S., the yield on the benchmark 10-year note fell toward a 20-month low. The yield on the 30-year Treasury bond settled at a record low. Bond yields fall when their prices rise.
Gold reaches the apex of its retracement.
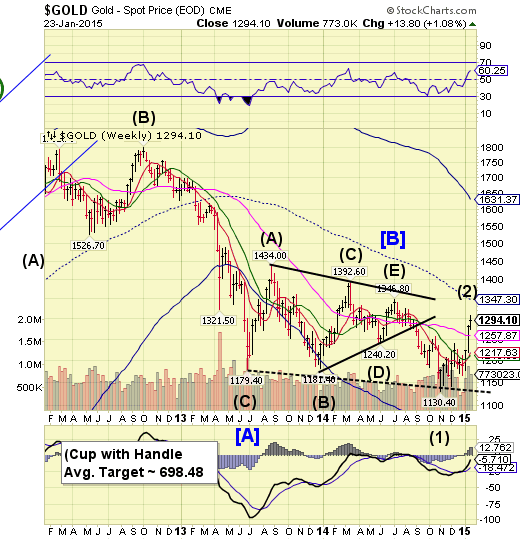
Gold appears to have completed its retracement this week.The Primary Cycle Pivot high due last week was overshot due to the unpegging of the Swiss franc. Gold is now due for a 3 week decline that may challenge the Lip of the Cup with Handle formation.
(WSJ) Gold and Silver are getting another turn in the spotlight, luring investors worried about slowing global growth and surprises by central banks.
On Thursday, the European Central Bank offered the latest reason to pile into precious metals by unleashing a bigger-than-expected bond-buying program amid continued worries about Europe’s economy. Gold futures ended above $1,300 a troy ounce for the first time since August, while silver neared bull-market territory, defined as a 20% increase from a recent low.
Gold and silver are drawing buyers of all stripes, a sign fears about a worsening economic outlook run deep in financial markets. The metals are popular havens for nervous investors but had fallen out of favor after setting price records in 2011 as the U.S. recovery gained speed. Now these metals are luring back some money managers, as collapsing oil prices, fears of a recession in Europe and volatility in currency markets shake their faith in stocks and other investments.
Crude may need further consolidation.
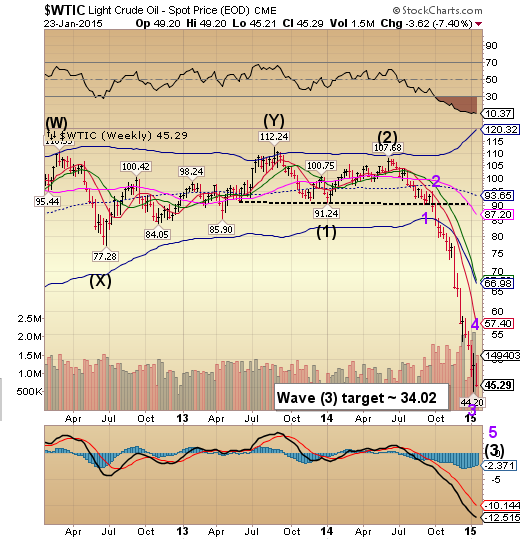
After only a week of consolidation, Crude may not be ready for another serious decline yet. Instead, it may rally for another week before the next phase of its decline. Crude may need a retest of its Short-term resistance, currently at 57.40 before resuming its decline. Keep your options flexible, since this one may go either way.
(ZeroHedge) Keeping the narrative dream alive, Treasury Secretary Lew told Bloomberg TV this morning that "lower energy prices are good for the US economy" - seemingly missing the huge surge in jobless claims, the lack of clear gains by firms on lower fuel costs, rig count collapsing, and homebuilder concerns in Shale states. But it was his follow up idiocy that sparked weakness:
(STLToday) Add tank-car makers to the list of U.S. industries bracing for the effects from the plunge in crude prices.
While 2014’s record orders, including an all-time high of 42,900 in the third quarter, will drive deliveries this year, manufacturers from Carl Icahn’s American Railcar Industries to Warren Buffett’s Union Tank Car face a decline. New bookings in 2015 may plunge 70 percent, Macquarie Capital USA said, putting earnings at risk when scheduled deliveries drop in 2016.
China may have hit its final high today.
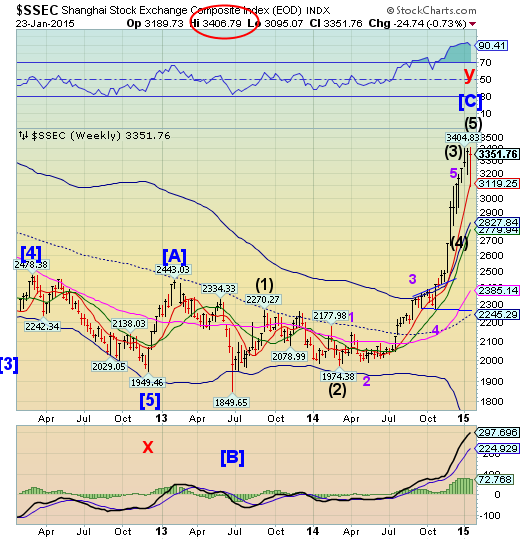
Last week I had suggested that, “The Shanghai Index appears to be in need of a final high next week.”The reason I could say that is that there were two Panic cycle pivots due, with the second one due today.The Shanghai Index is the only Chinese stock index that can be traded by foreigners. The ruckus in Europe sent investor money where it appeared to be the most welcome. Unfortunately, appearances can be deceiving. Volatility is on the rise in China.
(Business Insider) Shanghai stocks collapsed by 7.7% on Monday, as the government cracked down on major brokers offering leverage to their clients. It was the biggest one-day drop in Chinese equities since 2008, and for any other stock index, that might take some time to recover from.
But not in Shanghai. During trading Friday, the stock index erased those losses, after just four days.
The index closed up 0.30% on Friday, slightly below its open this week, but it pushed above 3,338, breaking to a fresh five-year high during the day.
The Banking Index bounces from mid-Cycle support.
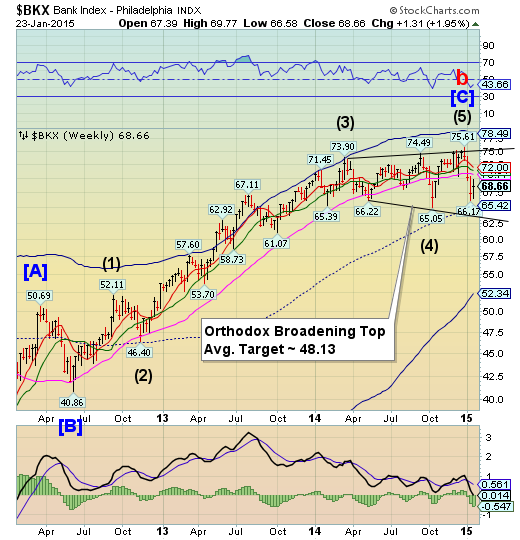
--BKX bounced from weekly mid-Cycle support at 65.42, as it makes ready for the next phase of its decline.It now must decline at least 3-5% beneath the lower trendline of its Orthodox Broadening Top at 63.00 to complete point 6 of the formation. The Cycles Model now implies that a significant low may be due in late January to early February that may fulfill those requirements.
(Reuters) - U.S. banks, after spending much of the last year bracing themselves for higher bond yields, are now resigning themselves to at least another few quarters of low rates, executives and analysts said.
Banks includingWells Fargo & Company (NYSE:WFC) and PNC Financial Services Group Inc (NYSE:PNC) are contemplating steps like investing their extra cash at current low yields or using derivatives that pay off if rates stay low.
(Reuters) - Russian banks with at least 25 billion roubles in capital and willing to increase lending to key sectors of the economy will be able to participate in a 1 trillion rouble ($15.65 billion) recapitalization plan, Russia announced on Friday.
The banks would also need to raise capital from other sources equivalent to 50 percent of the amount they receive, Finance Minister Anton Siluanov said in an emailed statement giving details of the scheme announced in December.
Banks are facing growing financial strain as sinking oil prices and Western sanctions linked to the Ukraine crisis push Russia into recession, with analysts warning even larger funds may be needed to stave off a banking crisis.
(ZeroHedge) Minutes after last week's Swiss National Bank shocker, jokingly we mused: “Will be ironic if Soros was long EUR/CHF”... because there would be nothing more ironic if the man who "broke the Bank of England" ended up being FXCMed himself by another central bank, over two decades later and just as he was set to finally retire, at the age of 84, formally, something he supposedly announced in Davos yesterday.
(ZeroHedge) “No stock-market crash announced bad times. The depression rather made its presence felt with the serial crashes of dozens of commodity markets. To the affected producers and consumers, the declines were immediate and newsworthy, but they failed to seize the national attention. Certainly, they made no deep impression at the Federal Reserve.”
