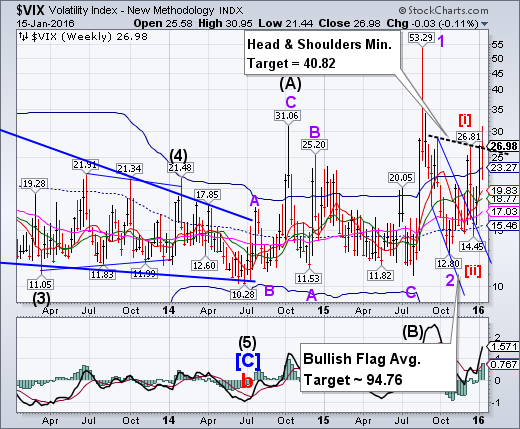
VIX pulled back from its Head & Shoulders neckline at 26.00 in a retracement, then broke through in the follow-through rally this week. This is at the same level that VIX closed on August 21. It remains on a buy signal (NYSE sell signal). The close above the neckline suggests a very robust follow-through rally next week. Although SPX closed beneath a critical level, investors are no less complacent as a week ago.
(ZeroHedge) At the start of September last year, as stocks began to ramp aggressively off the Black Monday crash lows, we unveiled a rather discomforting "decoupling" that suggested strongly "don't believe the hype."
Specifically, on August 30 we said that of all trades out there, the O:XIV-S&P convergence trade is as close to a "no brainer" as it gets:
SPX broke through the Neckline.
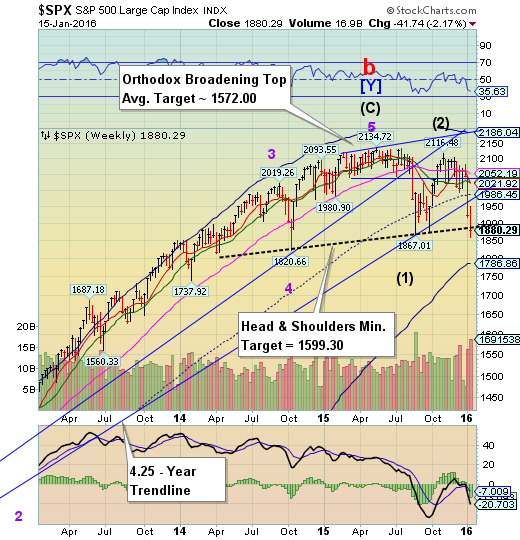
The SPX declined through its massive Head & Shoulders neckline at 1887.00 and closed beneath it. Should it remain beneath the neckline, it may result in a very quick panic decline. However, should it rally above it, the bounce may last through the end of the month before declining through the neckline again. Either way, the ensuing decline may go further than many expect.
(ZeroHedge) In a time when the S&P fluctuates with unprecedented velocity and investors need HFT-like reflexes to catch any momentum move, this may be the most practical advice to traders we have heard today.
In an email to Bloomberg, the former (and currently in contention for the title with Jeff Gundlach) bond king Bill Gross says to "stay out of the bathroom"as stock markets enter bear territory.
NDX declines to mid-cycle support.
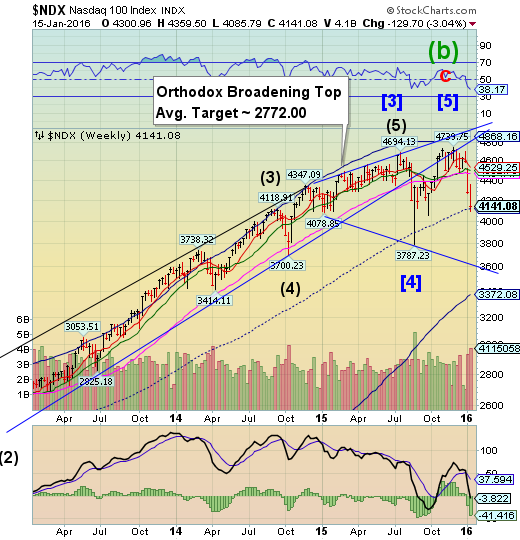
NDX challenged weekly mid-Cycle support at 4120.12, closing above it for the week. Once mid-Cycle support is crossed, the potential Orthodox Broadening Top formation may imply a possible follow-through move to the Cycle Bottom support at 3372.08, or lower.
(USAToday) Typically high-flying tech stocks fell Friday, intensifying speculation that 2016 could be a vastly different year for Silicon Valley giants and startups alike.
In midday trading, so-called FANG stocks (Facebook (O:FB), Amazon (O:AMZN), Netflix (O:NFLX) and the company formerly known as Google (O:GOOGL), now Alphabet) were all down: Facebook, 2.3%, Amazon 3.5%, Netflix 3.6% and Alphabet 2.8%. Apple (O:AAPL) was down 2.3%.
High Yield Bonds extend their decline.
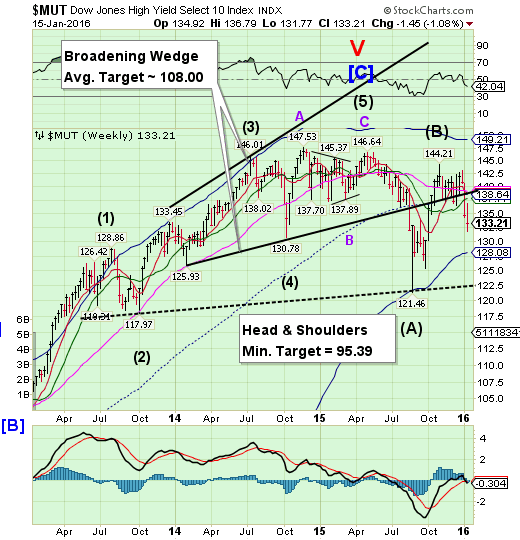
The High Yield Index declined beneath the trendline of its Broadening Wedge and mid-Cycle support at 138.64. The next level of support is the weekly Cycle Bottom support at 128.08. Once broken, the last level of support may be the neckline of the Head & Shoulders formation near 122.50. MUT is on a sell signal.
(NYTimes) The tide has definitely turned against investors in high-yield debt, better known as junk bonds.
Market indexes are down approximately 9 percent from their highs of last year. Plummeting prices for oil and other commodities have done most of the damage, but the decision last month by a well-known mutual fund, Third Avenue Focused Credit, to halt redemptions, has also spooked the market.
Is the worst over in this $1.5 trillion arena? Not yet. And some strategists say that investors may be focusing too much on the role energy has played in the decline while underestimating other risks.
The euro hesitates just under resistance.
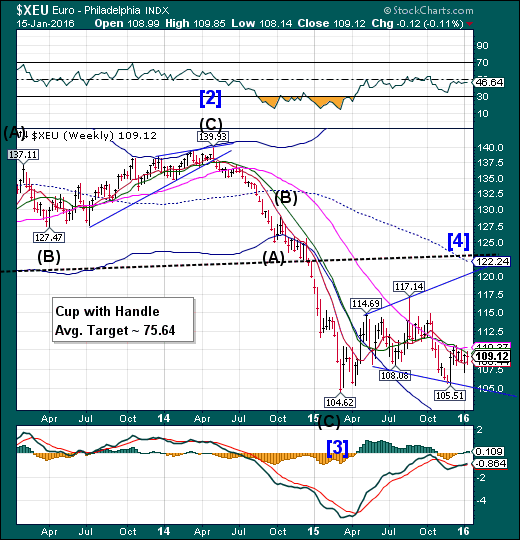
The euro seems to be hesitating beneath Long-term resistance at 110.37. Once above the resistance zone, it is likely to target the 117.00 – 120.00 range before reversing down. It is these kinds of retracements that shake out the weaker short sellers.
(WSJ) The reintroduction of borders in Europe would destroy the euro and the bloc’s single market, European Commission President Jean-Claude Juncker said in the starkest warning yet about the collapse of border-free travel due to the migration crisis.
Speaking in a news conference Friday, Mr. Juncker said the bloc hasn't “really found any lasting solutions to the refugee crisis.” Over 1 million migrants made their way into Europe last year and in the past few months, several countries, including Germany, have reintroduced border checks in an effort to better control the influx of migration.
EuroStoxx declined beneath the neckline.
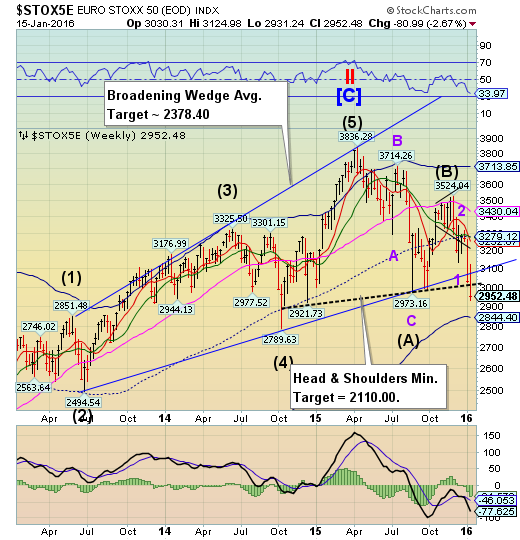
EuroStoxx declined through the Head & Shoulders neckline near 3025.00. EuroStoxx may remain in a decline through the third week of January. It is likely that one or both of the targets listed in the chart may be achieved.
(WSJ) A major index of European equities just entered a bear market, erasing a year of quantitative-easing-driven gains.
The Stoxx Europe 600 includes hundreds of Europe’s largest and most liquid listed firms, including some from non-eurozone countries in the region.
A fall of 2.84% today left the index down by more than 20% from April 2015, when it hit its highest level on record. It’s now touching lows last seen at the end of 2014, before the European Central Bank’s quantitative-easing scheme was announced in January 2015.
The yen continues its rally.
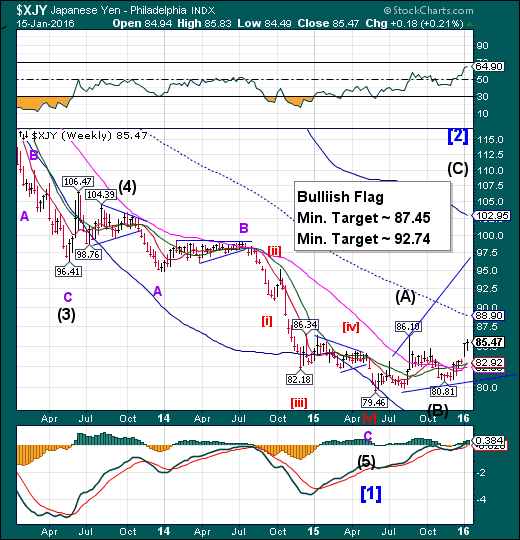
The yen continued higher this week, breaking through a lesser resistance not shown in the weekly chart. It has a minimum target of 87.45, which may take it to mid-Cycle resistance at 88.90. Should the yen resume its uptrend, it may continue its rally through the month of January.
(CNBC) As global stocks sell off, one overseas currency has been picking up steam.
The Japanese yen has risen 3 percent against the U.S. dollar this year, and it's one of the best-performing currencies of the year. According to Kathy Lien of BK Asset Management, the yen tends to outperform in times of trouble because of its widespread use as a funding currency.
Because the Japanese government has kept interest rates near zero for years, the yen has been a cheap source of borrowed money to put toward more speculative trades, Lien said. But as economic uncertainty has rocked markets around the world, investors are now unwinding big bets and covering shorts on the Japanese yen on a massive scale.
The Nikkei closes at neckline support.
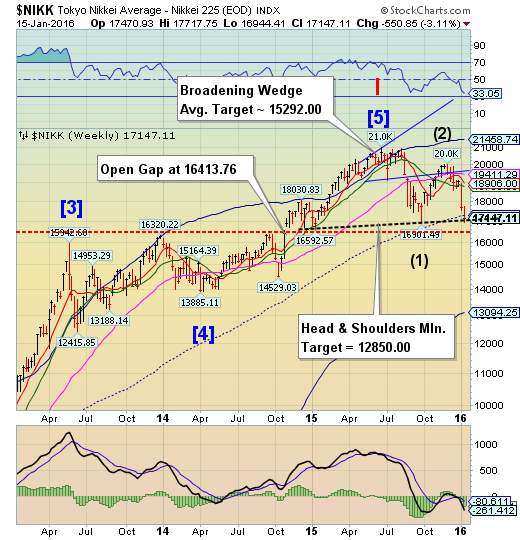
The Nikkei appears to have impulsively declined to its Head & Shoulders neckline at 16945.00. There may be a two week bounce here before it resumes its decline, but we may need to watch how the Nikkei opens next week. If the neckline is broken, it may trigger panic selling, since the neckline represents support that held the lows for the past 15 months. A point of interest is the open gap at 16413.76 which was made on November 4, 2014. It has not been fully closed since inception and a reversal gap though that zone may leave an Island formation, which may be a very strong trend reversal signal.
(Reuters) Japanese stocks turned negative on Friday afternoon, giving up earlier gains as oil prices fell and after the Bank of Japan's chief said he had no immediate plan to further ease policy.
The Nikkei share average fell 0.5 percent to 17,160.32 in midafternoon trade. The benchmark index rose as much as 2.1 percent in early trading but gave up all of those gains in the afternoon.
Market sentiment was hit by falling crude prices, with U.S. crude oil futures turning lower after posting the first significant gains for 2016 in the previous session.
Separately, BOJ Governor Haruhiko Kuroda on Friday reiterated that the country's price trend was improving steadily reflecting a moderate economic recovery, and said that he had no plan to expand monetary stimulus now.
U.S. Dollar continues to consolidate.
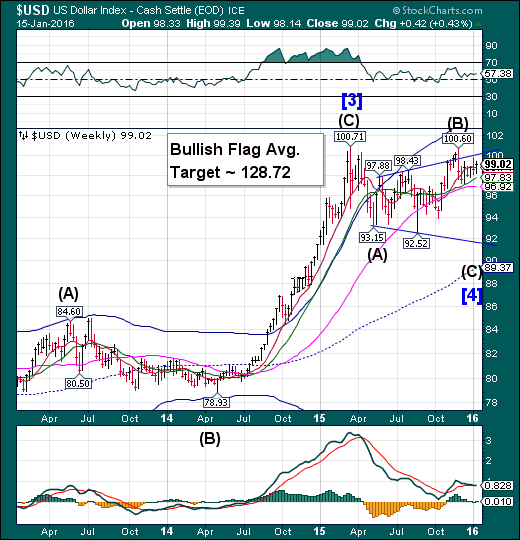
The US dollar continued to consolidate beneath the upper trendline of its Broadening Flag formation. The Cycles Model calls for a pullback that may decline to trendline support near 92.00, once Long-term support at 96.92 is broken. A new Master Cycle low targeted for the end of January may bring USD down substantially lower, but the total move may not be complete until late March. Bullish speculators may be caught the wrong way in their positions, causing a panic among the longs as this decline has the potential of wiping out all 2015 gains in the dollar long position. There is a lot of potential fuel to make this happen.
(Reuters) Speculators pared bullish bets on the U.S. dollar in the latest week, with net longs falling to their lowest in 2-1/2 months, according to Reuters calculations and data from the Commodity Futures Trading Commission released on Friday.
The value of the dollar's net long position slid to $25.29 billion in the week ended Jan. 12, from $28.78 billion in the previous week. This was the third straight week that investors reduced net long dollar positions.
USB rallies from its trendline.
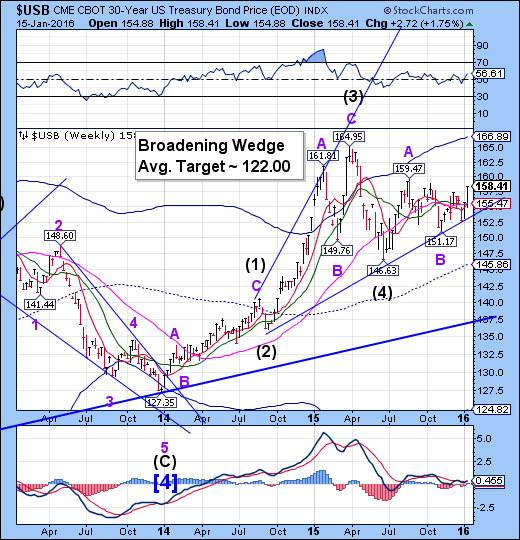
The Long Bond broke out above its December high, confirming its cyclical uptrend. We may see the rally continue only briefly before a pullback may be forthcoming. The retracement may touch the trendline again before resuming its bullish run.
(WSJ) Investors piled into U.S. government bonds to preserve capital on Friday, briefly driving the yield on the benchmark 10-year note below 2%, as a new round of selling in stocks and commodities heightened concerns over global growth and its impact on the U.S.
Falling oil prices and worries about China’s economy have jolted global markets, leading to a volatile start to the year. These fears came to the forefront again on Friday, with U.S. crude-oil prices sliding 5.7% to below $29.42 a barrel and China’s main stock index falling 3.6% to enter bear-market territory. European stocks followed the plunge, with the Stoxx 600 index down 2.8%.
Gold consolidated above Cycle Bottom support.
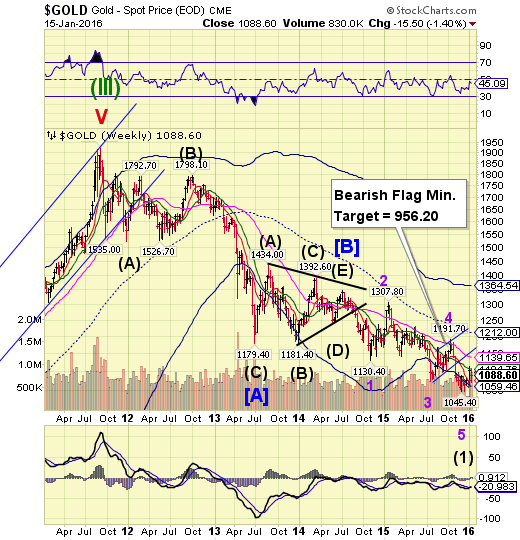
Gold consolidated above Cycle Bottom support at 1059.46 during a brief period of weakness. If so, this suggests the rally may resume above Intermediate-term resistance at 1104.76. If it extends higher early next week, the bounce may extend to or beyond Long-term resistance at 1139.65 before resuming its decline.
(WSJ) Gold futures posted their biggest gain in six weeks Friday as a global rout in stock markets and other risk assets—and comments by a Federal Reserve board member—stoked views that the U.S. central bank could pause plans to raise interest rates.
Gold futures settled 1.6% higher at $1,090.70 a troy ounce on the New York Mercantile Exchange, their largest daily gain since December 4. Gold, which has historically functioned as a safe-haven investment asset in turbulent times, has risen nearly 3% since the start of the new year amid evidence of weakening global economic growth and stock market turbulence around the world.
Crude continues its decline beneath the neckline.
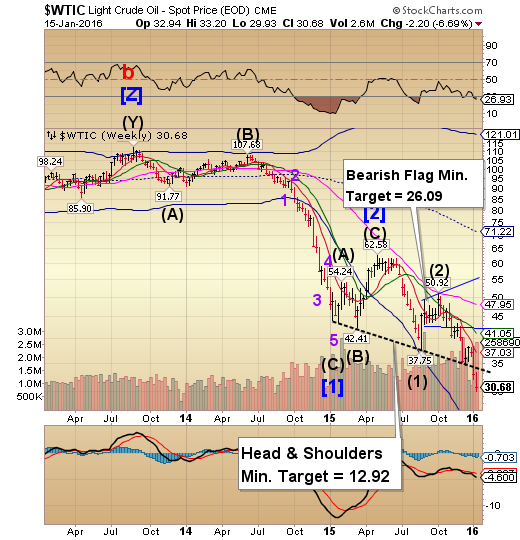
Crude continued its decline beneath the Head & Shoulders neckline at 34.00 after a brief retest. This is a very left-oriented Cycle pattern, implying extreme bearishness. The probability of a decline to the Flag target is running high. The Cycle Bottom Support continues its decline at 21.43, supporting this view. Note the new Head & Shoulders neckline that is down-sloping and bearish as well.
(IBT) From the windswept prairies of western North Dakota to the picket-fence lined suburbs of Houston, America’s oil patch is coming down from an unexpected, frenzied and ridiculously lucrative high: The boom is over. For many people, cheap oil translates into much-needed savings at the pump. But for pockets of the country whose fortunes are closely tied to extraction, the effects of the ongoing price plunge are more painful than anything else.
Benchmark oil prices fell below $30 a barrel Friday, down from above $100 just two years ago. So far, that decline has wrought thousands of layoffs and foreclosures — and threatens to do even more damage over the next year.
Shanghai Index closed beneath mid-cycle support.
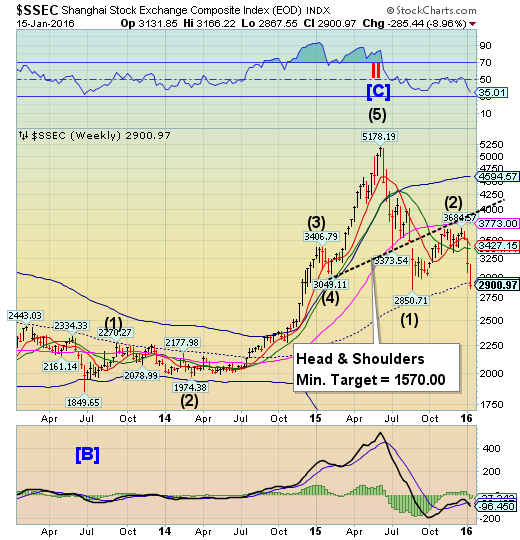
The Shanghai Index closed beneath weekly mid-cycle support at 2933.88. The Cycles Model suggests approximately another week of decline. Are frustrated Chinese investors ready to throw in the towel?
(StraitsTimes) Chinese stocks fell into a bear market for the second time in seven months, wiping out gains from an unprecedented state rescue campaign as investors lose confidence in government efforts to manage the country's markets and economy.
The Shanghai Composite Index sank 3.5 per cent to 2,900.97 at the close, falling 21 per cent from its December high and sinking below its nadir during a US$5 trillion (S$7.2 trillion) rout in August.
Yesterday's decline was attributed to persistent investor concerns over volatility in the yuan and a report that some banks in Shanghai have halted accepting shares of smaller listed companies as collateral for loans.
The Banking Index declines beneath the neckline.
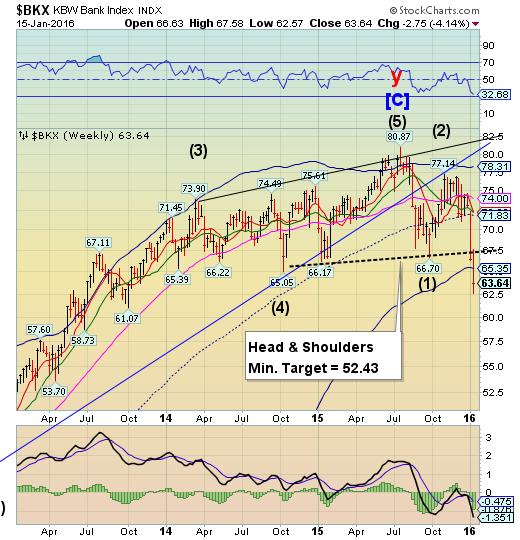
BKX continued its decline from its Head & Shoulders neckline beneath its Cycle Bottom. There may be a bounce back to the Cycle Bottom at 65.35, but the Cycles Model does not show a probable significant low until the second week of February. Remember, BKX is a leading index.
(WSJ) The biggest financial firms aren’t supposed to trade like penny stocks. Yet in a year barely over two weeks old, shares of the biggest banks are all down by double digits.
The KBW Nasdaq Bank index has sunk 13% from the start of the year. The biggest insurance companies have been pummeled as well, with MetLife (N:MET) down 13% and Prudential (L:PRU) down 15% in January.
Citigroup (N:C) reported fourth-quarter results on Friday that beat expectations—only to see its stock sink by nearly 7% at one point. Year to date, Citi’s shares are down around 19%. It is now trading at a nearly 40% discount to book value.
(ZeroHedge) With the feds probing Deutsche Bank (DE:DBKGn)'s exaggerating Auto ABS demand, car dealerships suing automakers for being forced to channel-stuff, direct evidence of massive channel-stuffing with near-record inventories-to-sales, and sales now beginning to tumble after last month's weak credit growth, it is perhaps no wonder that Fitch has raised the warning flag about automotive vehicle and parts makers...
(ZeroHedge) In the latest Chinese domestic financing report released by the PBOC last night, there were two divergent themes: on one hand bank loans grew far less than the expected 700Bn yuan, and at 598Bn this was the second lowest monthly increase in the past year, only higher than October's 514bn; on the other hand total social financing soared to 1.82 trillion yuan, smashing forecasts of a 1.15 trillion increase, and the highest since June.
As noted last night, this may have been the catalyst that spooked the markets, because asBloomberg confirms, "the data shows companies are turning to alternative sources for credit given banks’ reluctance to lend."
(ZeroHedge) Yesterday we reported something disturbing: a small regional bank, BOK Financial (O:BOKF), announced that it had underestimated its exposure to energy loans, or rather loan, issued by just one company, and as a result its previously forecasted provision for credit losses of $3.5 million to $8.5 million would be insufficient, and due to the unexpected loan impairment it would have to take a dramatic $22.5 million in credit losses." As a result BOKF stock crashed and is now trading at levels not seen since 2010.
Which stock should you buy in your very next trade?
With valuations skyrocketing in 2024, many investors are uneasy putting more money into stocks. Unsure where to invest next? Get access to our proven portfolios and discover high-potential opportunities.
In 2024 alone, ProPicks AI identified 2 stocks that surged over 150%, 4 additional stocks that leaped over 30%, and 3 more that climbed over 25%. That's an impressive track record.
With portfolios tailored for Dow stocks, S&P stocks, Tech stocks, and Mid Cap stocks, you can explore various wealth-building strategies.
