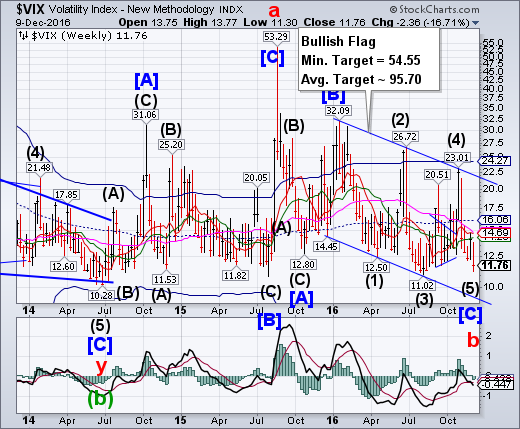
VIX declined this week, but failed to go beneath its Wave (3) low at 11.02.Should it reverse from this week’s low, it may qualify as a truncated wave.The implications are enormous, since it implies that the declining energy may have been dissipated.The ensuing reversal may be strong.
(WSJ) Two major stock and options market indicators were on the same page this week, an unusual alignment that some strategists view as warning that stock indexes could be headed for a fall.
The S&P 500 closed at fresh highs the last two days, signaling investor enthusiasm for stocks. The CBOE Volatility Index, which measures expectations for swings in the S&P 500, also climbed those two days, a sign of increased hedging activity. That is unusual at a time when the market is rising.
SPX hits a double Broadening trendline.
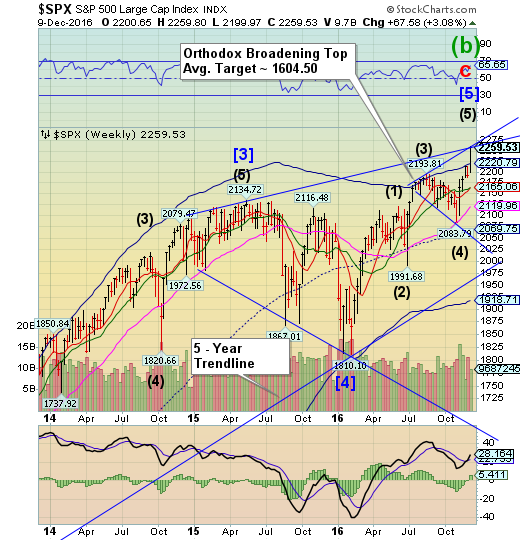
SPX surged beyond its Cycle Top Resistance at 2220.79, intersecting with the upper trendlines of two Orthodox Broadening Tops. The smaller Broadening Top has a possible average target of 1604.50. It appears that point 5 of the Orthodox Broadening Top may be complete.
(ZeroHedge) In his latest letter to clients, Art Cashin's tries his best to explain yesterday's unprecedented market melt up, or as he puts it, how "Technical Levels, Algorithms And Even Dow Theory Help Rout Shorts"
Wednesday's opening gave no hint of the day that would lie ahead. Stocks opened mixed and indecisive in moderate volume.
The bulls managed to put together a rather half-hearted, meek rally and they spent much of the morning in a very narrow range.
Separately, and unnoticed by most, the Dow Transports embarked on a more intense rally, aided by the airlines.
The NDX challenges its Cycle Top.
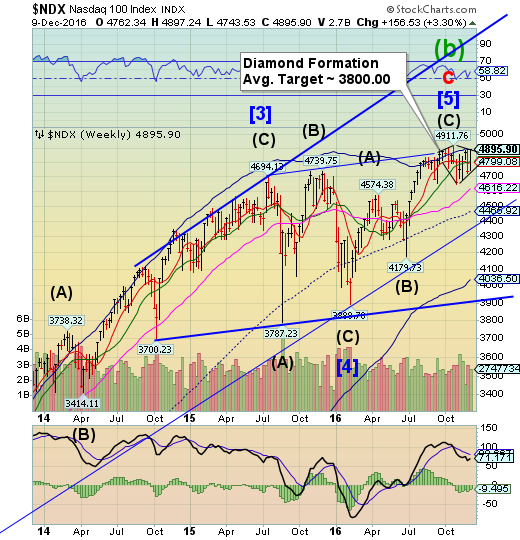
NDX challenged its Cycle Top at 4895.33, also completing a potential Diamond formation. Should the NDX decline beneath the lower trendline of the Diamond, it may produce a sell signal with a bear market target near 3800.00.
(Bloomberg) U.S. equities set records as phone companies rallied for a second day and were joined by tech companies as well as stocks that pay high dividends. The S&P 500 Index jumped 1.3 percent to 2,241.35 at 4 p.m. in New York, surpassing its previous high reached on Nov. 25.
The Dow Jones Industrial Average added 1.2 percent as all but three of its 30 stocks advanced. While the S&P 500 is up 3.7 percent since the U.S. election, the groups leading the market Wednesday -- phone, utility and tech stocks -- were those that have lagged behind big moves in financial and energy stocks the past month.
High Yield Bond Index lags behind stocks.
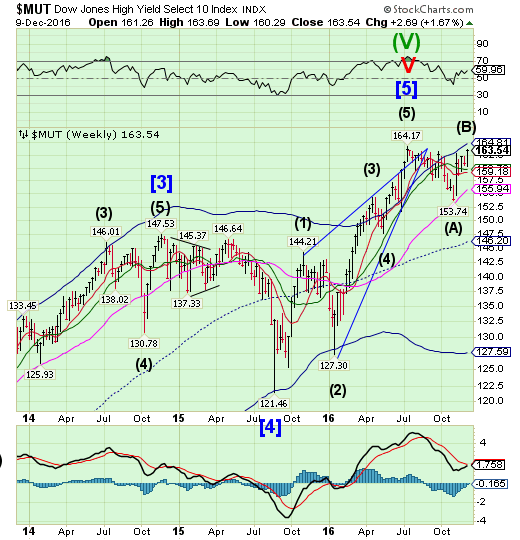
The High Yield Bond Index rallied, but could not close above its July 14 high at 164.17. Time for a continued rally may have run out, putting MUT in danger of a reversal.It will give a sell signal by declining beneath its Short-term support at 159.18. A failure at Long-term support at 155.94 may produce a sharp decline to mid-Cycle support at 145.93.
(FT) There was no shortage of buyers when Microsoft (NASDAQ:MSFT) sold $20bn in bonds this summer to fund its acquisition of LinkedIn (NYSE:LNKD). After years of low interest rates — and with rates in some countries heading into negative territory — debt issued by US companies such as Microsoft looked very
But after Donald Trump’s pledge to push for an aggressive fiscal stimulus of the US economy, these blockbuster corporate debt sales suddenly look like hallmarks of a very different market environment. As investors and markets try to anticipate what a Trump presidency will mean, one early conclusion is that a dose of fiscal shock treatment will result in much higher interest rates and accelerating inflation.attractive compared with the meagre returns offered by government bonds.
USB resumes its decline.
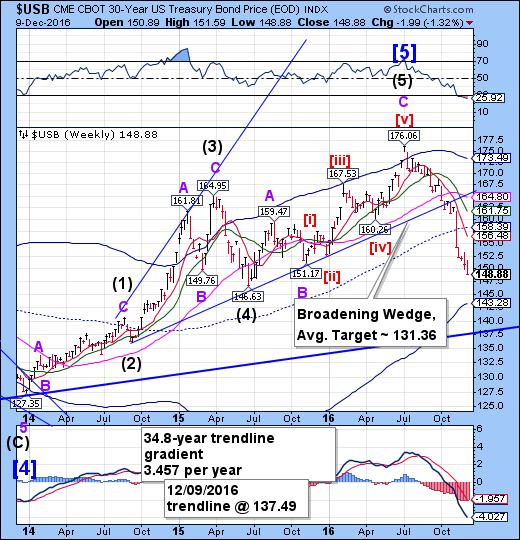
The Long (U.S. 30-Year) bounced through Wednesday, then resumed its decline. It appears to have made a significant low today. There is a high probability that a bounce may begin for another one to two weeks that may challenge weekly Short-term resistance at 156.48.There is room for more downside but a brief consolidation appears imminent.
(Bloomberg) A closer look at the current breakdown of interest payments on U.S. debt should cause President-elect Donald Trump’s Treasury Secretary pick Steven Mnuchin to pause before endorsing the sale of ultra-long bonds as a cushion against rising rates.
At least that’s what Cullen Roche, founder of San Diego, California-based brokerage Orcam Financial Group LLC, says after pointing out that despite the surge in total U.S. debt over the past decade, the government’s annual interest costs have been relatively flat.
The euro challenges the trendline again.
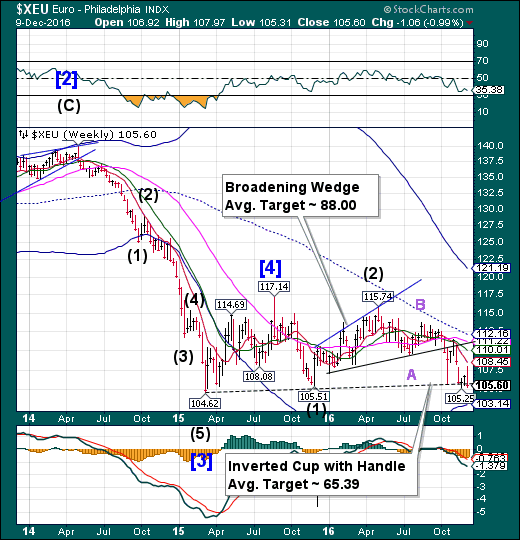
The euro challenged the Lip of its inverted Cup with Handle formation again this week after finishing a brief retracement to Short-term resistance at 108.45. Since the Broadening Wedge trendline has already been broken we should expect to see its target coming into view early next year. In the meantime, its next target may be parity with the USD.
(Reuters) The euro dropped on Friday for a second consecutive day in a continued reaction to the European Central Bank's extending its bond-buying program longer than many had anticipated, even as the bank cut the size of the monthly purchases.
The ECB said on Thursday it would reduce its monthly asset buys to 60 billion euros starting in April from 80 billion euros currently and extend purchases to December 2017 from March 2017. It reserved the right to increase the size of purchases again.
Underlying its promise for extensive stimulus, the ECB predicted inflation at 1.7 percent in 2019, arguing that more-costly energy could boost consumer prices even without lifting the underlying trend.
Euro Stoxx 50 tests mid-Cycle resistance.
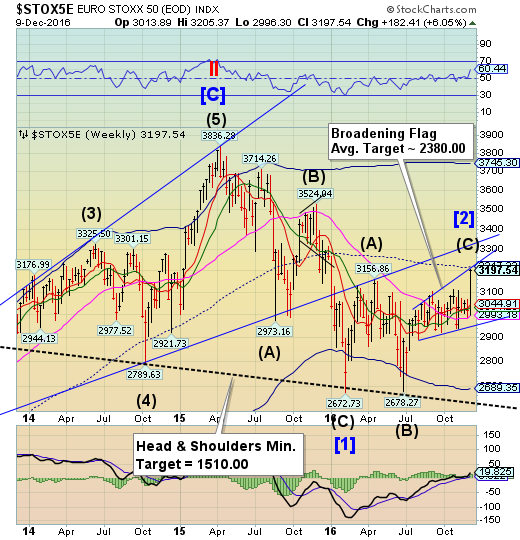
The Euro Stoxx 50 Index attempted a challenge of its Broadening Flag trendline and mid-Cycle resistance, both at 3217.33. The Cycles Model suggests the period of relative strength has ended and a decline may ensue over the next two weeks. The Index must complete a reversal pattern before a sell signal may be issued.
(ZeroHedge) Last night we reported that according to Reuters, with a private bailout off the table now that Italy is in political limbo, a nationalization in the form of a government debt-to-equity bailout of Monte Paschi was imminent, however there was a snag: political opposition from Brussels - which has insisted on a bail-in resolution mechanism instead of a bail out - could scuttle the transaction which is meant to make whole junior bondholders - mostly retail investors - courtesy of other taxpayers. The alternative was to request more time from the ECB, which has previously given Monte Paschi a year end deadline.
Now, according to the FT, we learn that Rome is demanding the ECB give it more time to rescue the third largest Italian bank. That was to be expected, what is surprising, however, is that as the FT adds, Italy is "preparing to blame the bank for losses imposed on bondholders if Rome is forced into an urgent state bailout", a negotiating tactic some could call blackmail.
The yen extends its retracement.
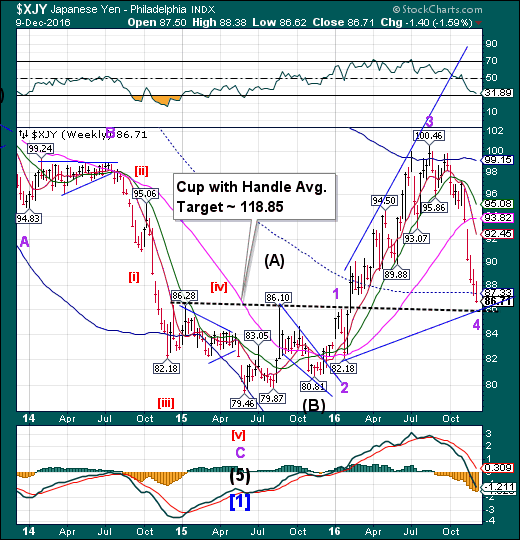
The yen extended its decline yet another week, making the extension more than three weeks beyond its normal time. The key is that the yen cannot fall beneath the Lip of its Cup with Handle without negating it. We may see up to two weeks of cyclical strength ahead. The decline sets up a probable “slingshot” move, launching the yen toward its Cup with Handle target.
(Bloomberg) The yen’s swift decline in the wake of Donald Trump’s election victory last month could go too far, according to Hakubun Shimomura, a senior member of Japan’s ruling Liberal Democratic Party.
A weaker currency is generally welcome in Japan because it helps exporters and fuels desired inflationary pressures. But Shimomura, a former education minister and close ally of Prime Minister Shinzo Abe, said he worries that the currency could drive up the nation’s import bill.
"If the yen weakens too much, import prices go up," Shimomura said in an interview in Tokyo on Monday. With most of the nation’s nuclear reactors offline and Japan importing more energy, he said this was "even more the case."
The Nikkei rallies to new retracement highs.
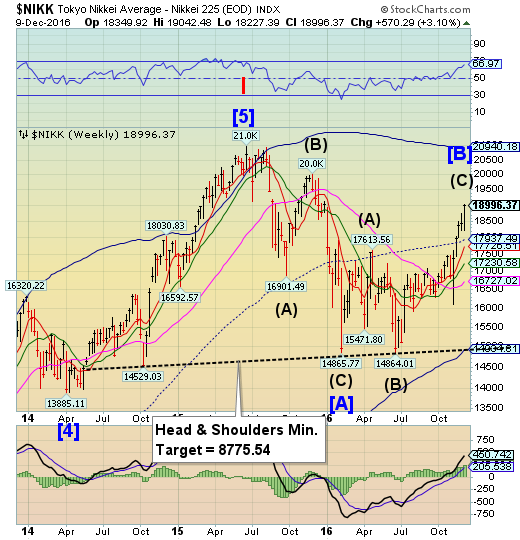
The Nikkei rallied to a new retracement high above the mid-Cycle resistance this week, briefly topping its 19000 marker. The period of cyclical strength may have ended and may lead to a two-week decline to its Cycle Bottom at 114934.81. Should the Head & Shoulders neckline be broken, a panic may ensue.
(Investing) Japan stocks were higher after the close on Thursday, as gains in the Power, Finance and Investment and Shipbuilding sectors led shares higher.
At the close in Tokyo, the Nikkei 225 gained 1.45% to hit a new 6-months high.
The best performers of the session on the Nikkei 225 were Tokyo Electric Power Co., Inc.(T:9501), which rose 17.78% or 81.0 points to trade at 536.5 at the close. Meanwhile, Mitsubishi Motors Corp. (T:7211) added 6.38% or 37.0 points to end at 616.5 and Fujitsu Ltd. (T:6702) was up 6.18% or 41.6 points to 714.8 in late trade.
U.S. dollar rose above the trendline.
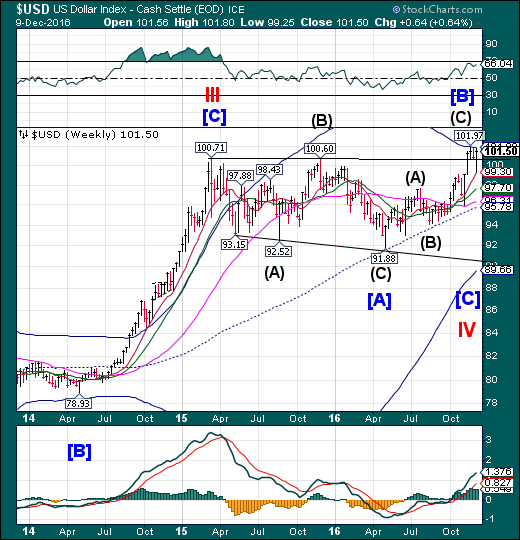
USD tested Sort-term support at 99.30, then rose above the upper trendline to test the Cycle Top at 101.89. This was the first big break of support at 100.60. A further decline beneath that levelmay cause a rapid move from bullish to bearish as traders find themselves wrong-footed.
(Reuters) Speculators increased positive bets on the U.S. dollar for a third straight week, pushing net longs to their highest since early January.
The value of the dollar's net long position rose to $28.14 billion in the week ended Dec. 6, from $24.82 billion in the previous week, according to Reuters calculations and data from the Commodity Futures Trading Commission released on Friday.
The continued rise in long dollar positioning is not a surprise given expectations of higher inflation with increased infrastructure spending under a Trump administration.
Gold is challenging its Broadening Top trendline.
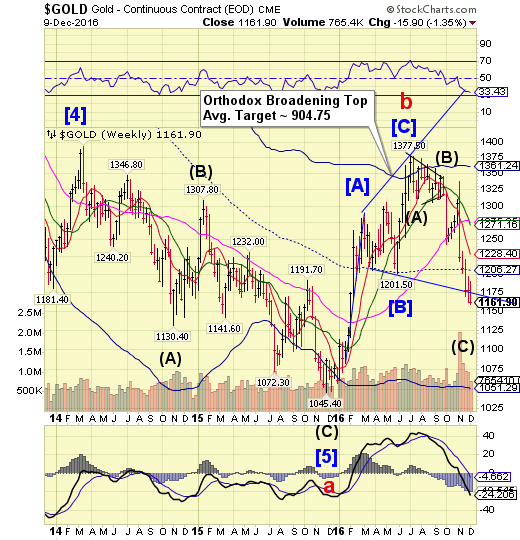
Gold broke through the lower trendline of its Orthodox Broadening Top formation, but did not make a new low. The Cycles Model suggests a probable low early next week, which agrees with the Broadening Top pattern which calls for a continued decline to the vicinity of 1150.00. Nonetheless, it may be time to be on guard for a reversal back above the trendline.
(Bloomberg) Everything’s against gold at the moment.
Gold futures closed at the lowest level since February as the Federal Reserve gears up to raise rates, while U.S. equities at record levels lure money out of havens and fund holdings wither. Assets in bullion-backed exchange-traded funds contracted for a 20th straight day as of Thursday, the longest stretch since May 2013.
The precious metal is ending 2016 on the ropes as investors price in the Fed’s probable move next week, pushing bond yields higher amid the likelihood of further hikes in 2017. A gauge of the dollar has climbed since the U.S. election, while the S&P 500 and the Dow Jones Industrial Average are at all-time highs amid speculation President-elect Donald Trump’s policies will spur growth. Investors are also assessing the European Central Bank’s decision on Thursday to tweak its bond buying.
Crude makes a new terminal high.
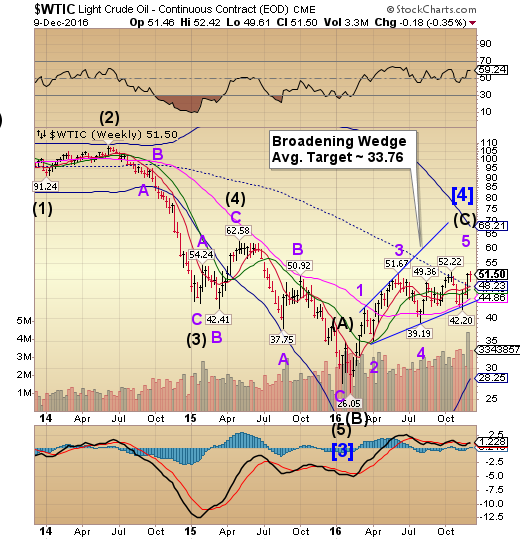
Crude broke aboveits prior high on Monday to make a new retracement high at 52.42. Since then it completed a reversal pattern and may decline to challenge the lower trendline of its Broadening Wedge. The Cycles are compressed here, making sudden moves highly probable.
(CNBC) OPEC's agreement last week to cut oil production is creating an opportunity for U.S. oil producers to get crude into the hands of very valuable customers: Asian crude buyers.
The members of the Organization of the Petroleum Exporting Countries have vowed to cut a collective 1.2 million barrels a day and are asking other oil producers to reduce output by 600,000 barrels a day.
The long-awaited output limits are expected to make it possible for U.S. producers to ply the expensive, complicated route to Asia from the United States. The stage was set when the United States lifted a 40-year-old ban on exporting American crude last December. Since then, much of the oil has gone to Europe, but now industry heavyweights are attempting to extend those exports to Asia, a region whose oil consumption is growing.
Shanghai Index easing away from its high.
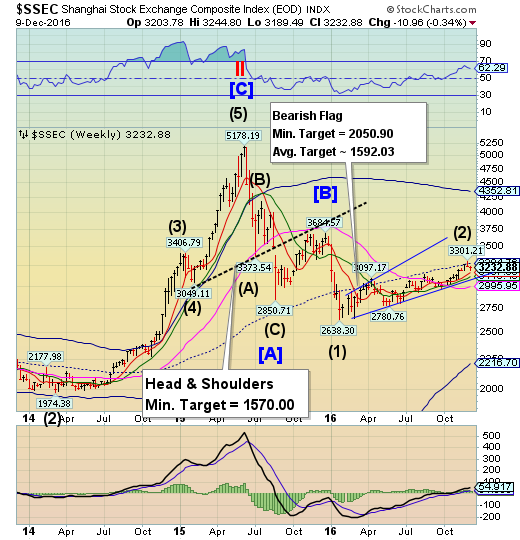
The Shanghai Index appears to be easing away from its November 29 high. A continued decline may lead to an inevitable breakdown beneath the Broadening Wedge trendline. The fractal Model suggests the Shanghai is due for another 1,000 point drop, possibly starting next week. The next significant low may be due in about two more weeks.
(ZeroHedge) While in recent months, the PBOC had tried to mask the real pace of reserve outflows, covering up the accelerated selling of US-denominated assets to defend its rapidly devaluing currency, we noted in October that using more accurate calculations, China's capital outflows are once again surging, having hit $78 billion in September. Overnight, China, unable to continue "covering up" its reserve state, disclosed that, as we warned, FX reserve liquidation had soared with total reserves falling by nearly $70 billion last month as the country’s central bank burned through more of its reserves in the fight to defend the renminbi from greater depreciation on the back of accelerating capital outflows. This was the largest decline since January.
The Banking Index throws over the trendline of its Broadening Top.
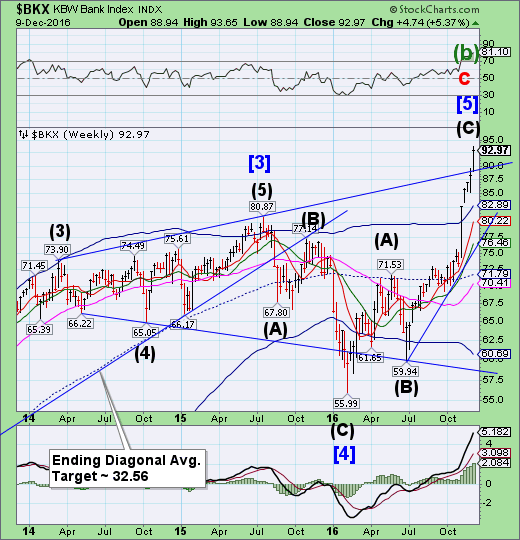
--BKX surged above the upper trendline of its Orthodox Broadening Top at 90.00 this week. This may well be the terminal push which may result in a reversal to the bottom of the formation. Once broken, we may expect this three-year pattern to unwind very quickly.
(ZeroHedge) With global bank stocks soaring on expectations - and hope - that financial sector regulation will be broadly swept away under Trump, today Europe did its best to show that, at least for now, the banks are not in the clear when the European Commission has fined JPMorgan (NYSE:JPM), Credit Agricole (PA:CAGR) and HSBC a total of €485 million ($521 million) for rigging the Euribor benchmark as European Union antitrust regulators wrapped up a five-year investigation into the scandal.
The three banks colluded on euro interest rate derivative pricing elements, and exchanged sensitive information, in breach of EU antitrust rules, the European Commission said on Wednesday in an e-mailed statement. JPMorgan was fined 337.2 million euros, HSBC got a 33.6 million-euro penalty and Credit Agricole must pay 114.7 million euros. Margrethe Vestager, the EU’s competition policy chief, said banks “have to respect EU competition rules just like any other company operating in the single market.”
(ZeroHedge) The wait is almost over.
After two previous taxpayer funded bailouts, and nearly five months of foreplay since the third largest Italian bank failed the latest European stress test at the end of July, in which the Italian government in September vow that "bailout for Italian banks has been 'absolutely' ruled out", a third bailout, as we previewed earlier today, is now imminent.
According to Reuters, which cites two sources, Italy is preparing to take a €2 billion controlling stake in Monte Paschi as the bank's hopes of a private funding rescue have faded after a fruitless five month search to secure an anchor investor, following Prime Minister Matteo Renzi's decision to quit.
(ZeroHedge) Having soared ridiculously (25% off Tuesday lows) following its dip after the Italy referendum 'no' vote, ailing Italian lender Monte deiPaschi di Siena has seen its stocks and bonds eviscerated in today's trading as reality dawns that the fecal matter in Italy is about to strike the rotating object. ECB's rejection of Paschi's request for more time has sparked wholesale selling across the Italian banking system.
(Forbes) he end is nigh for Italy’s most troubled bank. Trading in the shares of Monte Dei Paschi Di Siena (MPS) was suspended today when the share price tumbled on news that the ECB had refused to give the bank an additional five weeks to raise 5bn euros in new capital. Government bailout is almost certain now.
MPS, the oldest bank in Europe, has been in trouble for years. It has twice been bailed out by the Italian government. Its balance sheet is stuffed with toxic assets: non-performing exposures make up 38% of its assets, of which the largest proportion are the deeply distressed sofferenze (bad debts). MPS’s results for the third quarter of 2016 show a loss of 1.15bn euros, caused entirely by increased loan loss provisions. Even more worryingly, the results also show that lending and deposit-taking activity is falling, as confidence in the bank is eroded. This is a bank in terminal decline. Unless its balance sheet can be repaired, it will eventually die.
