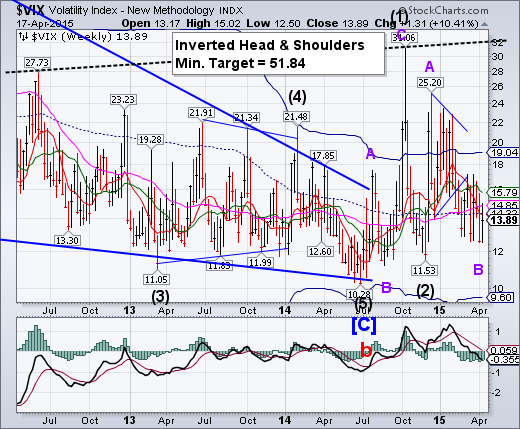
-- VIX made a new Master Cycle on Thursday, 50 days after the initial Cycle low on February 25. It occurred in the form of a rare triple zigzag formation. On Friday, it challenged Short-term resistance at 14.85, warning of a potential breakout above that level.
SPX declines beneath short-term support.
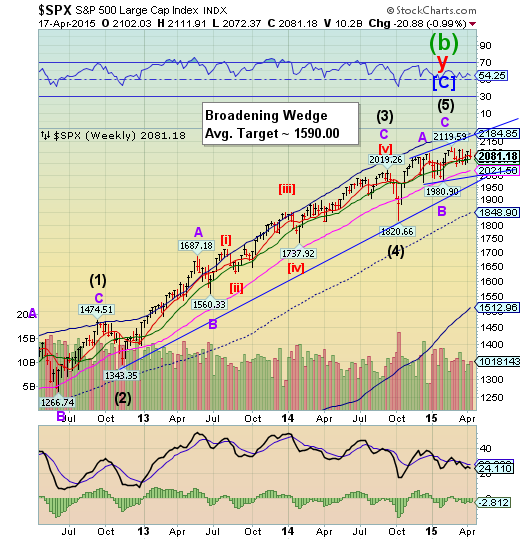
SPX closed the week beneath weekly Short-term support/resistance at 2084.31.The problem with this sideways market is it allows the support levels to become dangerously shallow, making it easier to break down.Weekly Intermediate-term support is at 2068.31, while weekly Long-term support is at 2021.60. The uptrend may be broken at the long-term trendline at 1980.00. The next decline may not be saved at Long-term support as the last one did on October 15.
(CNBC) Bullish short-term traders might do well to take their foot off the gas Friday, with two technical analysts telling CNBC that major global benchmarks were set for a short correction over the next month.
Delving deep into the technicals, Yacine Kanoun, managing director at PivotHunters, a portfolio management firm based in the U.K., highlighted that Germany's blue chip index, the DAX has already dipped by 3 or 4 percent since last week.
He now expects further falls in the short term on both the DAX and the U.S. benchmark S&P 500.
NDX also loses Short-term support.
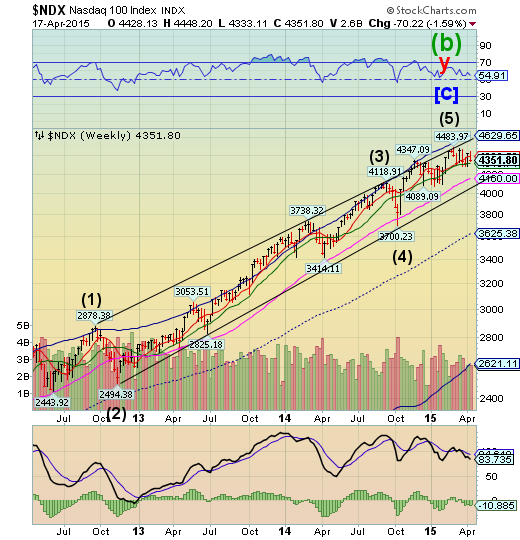
NDX closed beneath its weekly Short-term support at 4386.56. A decline beneath weekly Intermediate-term support at 4318.71 may allow NDX to activate multiple bearish formations not shown in the weekly chart. Furthermore, an important Cyclical low may be due by the end of the week. .
(StreetTalkLive) Speaking of seeming backward, the economic data has continued to disappoint on virtually all fronts, earnings are weak and markets are grossly extended. Yet, investors are more bullish than ever as noted yesterday:
"While investors may be looking for returns, they are 'extraordinarily optimistic about their investment prospects in both the short and long term,' says Natixis. Respondents say they need 10.1 percent return on their investments, and 81 percent of them feel their expectations are realistic.
Fifty-four percent expect their returns this year to be better than 2014.
Stocks will be the best-performing asset class this year, according to 45 percent of the respondents, followed by 17 percent who say cash will be the top performer."
High Yield Bonds challenge important support.
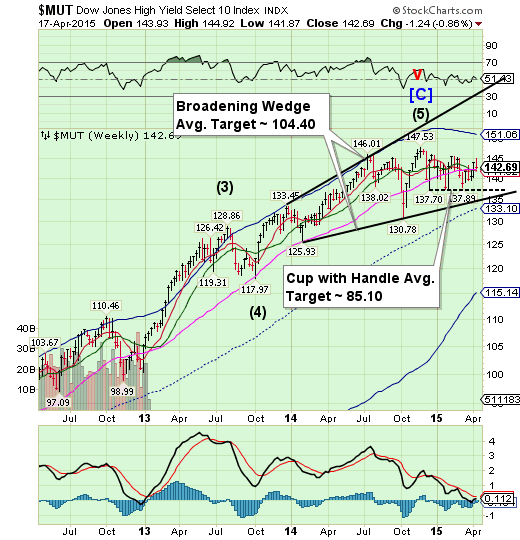
The High Yield Index severely challenged its weekly Long-term support at 142.31, but did not close beneath it.It is capable of breaking all supports in one swoop while heading for the trendlines beneath.The Cup with Handle formation has a very high probability of success once it is triggered.A failure at this point may cause difficulties in new high yield financing that has helped finance stock buybacks, especially in the NASDAQ.
(ZeroHedge) We’ve talked a lot lately about HY in general and about the HY energy space more specifically. Recapping, periods of QE in the US saw US HY supply surge 50% above normal levels as issuers sought to take advantage of lower borrowing costs and investors clamored for the relatively higher yields they could get by taking on more credit risk. More recently, struggling oil producers have tapped the market in an effort to stave off insolvency as crude prices plummet, leading directly to a situation where outstanding HY energy bonds account for a disproportionate share of all outstanding debt in the space. With rates set to rise later this year, with crude prices likely to stay depressed for the foreseeable future, and with suppressed liquidity in the secondary market for corporate credit poised to bring heightened volatility, the stage may be set for a high yield meltdown.
The euro tries again at another rally.
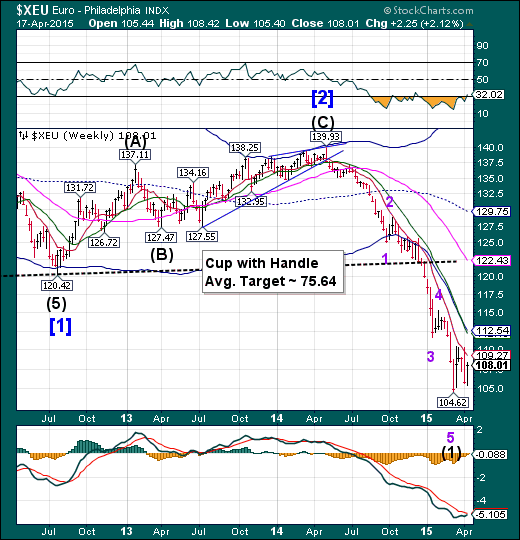
The euro made a short-term low on Monday and rallied the rest of the week.A rally above weekly Short-term resistance at 109.27 may allow it to challenge its Cycle Bottom at 112.54.This may be the limit to the retracement.
(ChicagoTribune) With the Greek government hinting it could be forced from the euro and the country's official creditors growing increasingly frustrated with the government's doublespeak and foot-dragging, analysts are starting to focus on what might happen if bailout talks fail.
German officials are "taking just about everything into consideration," Finance Minister Wolfgang Schaeuble said in an interview this week as he urged Greek leader Alexis Tsipras to stop offering his people with false hopes. Economists such as UniCredit Bank's Erik Nielsen say it may be just a matter of time before Tsipras' cash supplies run out and he's forced to print a new currency.
Adopting the euro was always supposed to be a one-way ticket, so there is no legal precedent or political roadmap for an exit. If you're waiting for a formal announcement of a clear resolution, you may be waiting a long time.
Euro Stoxx have a strong reversal.
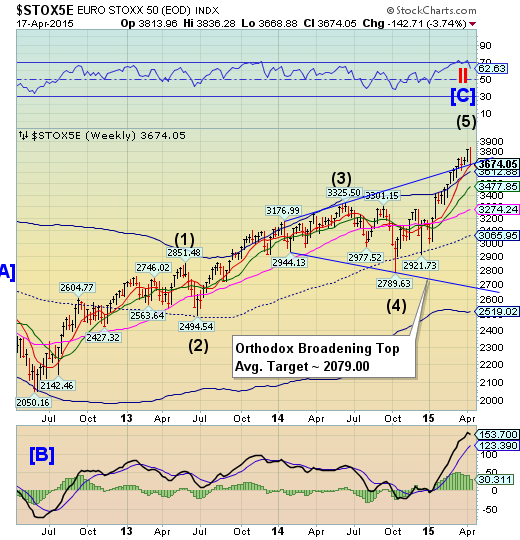
The Euro Stoxx 50 made a possible final high on Monday before closing at the upper trendline of the Orthodox Broadening Top.No supports were broken, but Cyclical weakness may continue next week.Could a rising euro cause a sell-off in Stoxx?
(MarketWatch) European stocks dropped sharply Friday, pulling lower along with other global markets, with traders attributing the moves to changes in Chinese trading rules.
Heightened worries about a default by Greece also contributed to the dark mood on the financial markets. Friday’s hefty losses drove European indexes deeper into the red for the week. Germany’s DAX 30 DAX, -2.58% logged its worst week since November 2011, with 5.5% decline.
The yen tests Cycle Bottom support.
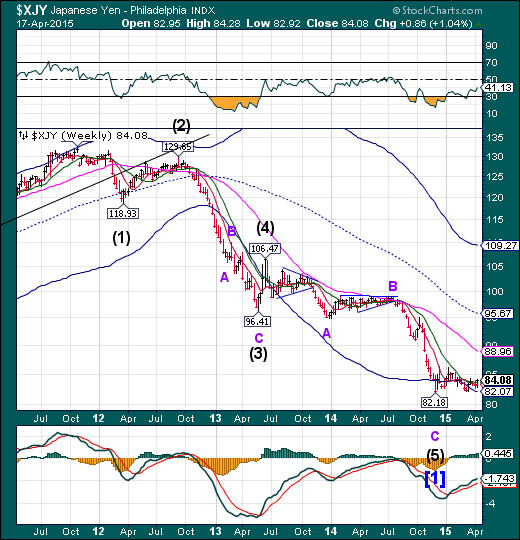
The yen rose this week, but did not break out of its sideways consolidation. All indications point to a probable strong breakout next week.
(Bloomberg) Japanese Finance Minister Taro Aso said his counterparts and central bank governors from Group of 20 nations had no criticism over the yen’s weakness after it depreciated about 30 percent under Prime Minister Shinzo Abe.
“None,” Aso told reporters when asked if he faced any criticism on the currency after the G-20 meeting Friday in Washington. At the joint press briefing, Bank of Japan Governor Haruhiko Kuroda said the G-20’s view on monetary policy is consistent with the BOJ’s unprecedented easing
The Nikkei may be reversing.
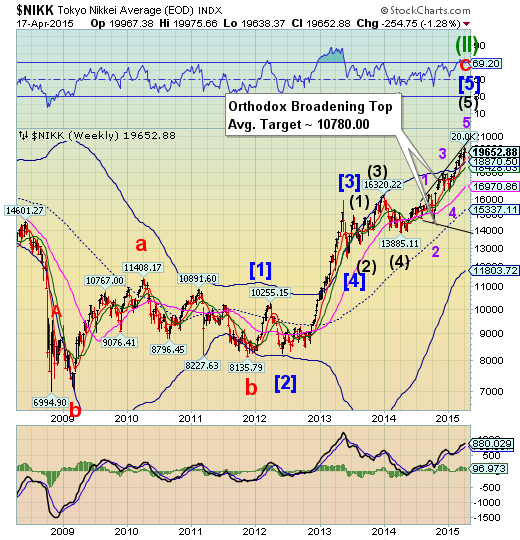
The Nikkei stalled beneath last Friday’s high and the upper trendline of its Orthodox Broadening Top, beginning its decline on Thursday. Last week I had mentioned, “The Nikkei at 20000 represents both round number resistance and its previous high in 2000. Both of these resistances pose a risk to the continuation of the rally.” It appears that may have been the case.
(Reuters) - Japan's Nikkei share average dropped on Friday morning after weaker-than-expected U.S.housing data soured the mood, while investors awaited Japan's corporate earnings starting next week.
Also dampening sentiment was weakness in Europe shares and concern about Greece's financial woes.
At mid-morning, the Nikkei was down 0.5 percent to 19,780.69.
The Nikkei traded above the psychological mark of 20,000 last Friday for the first time since April 2000, but the first four days of this week the index barely changed.
U.S. dollar declines, but still above support.
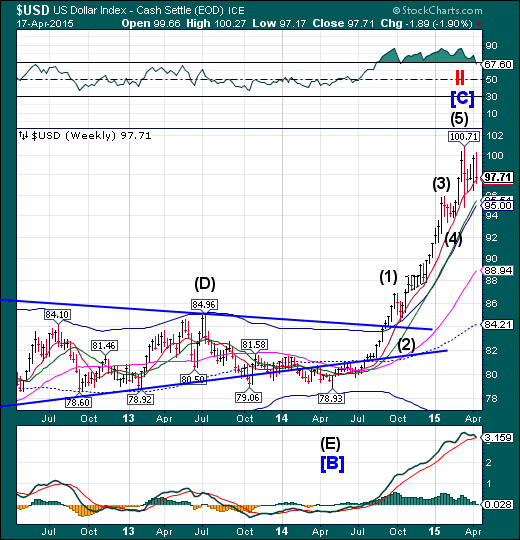
The US dollar challenged, but did not break through its weekly short-term support at 97.50 this week. The Cycles Model calls for a month-long decline as far as mid-cycle support, currently at 84.21. Critical support is at the Cycle Top at 95.00. Dollar longs may be crushed in a decline beneath that level.
(Reuters) - The U.S. dollar posted its worst week in four against a currency basket on Friday after data showing a rise in consumer prices failed to alleviate concerns that recent soft U.S. economic data could delay the Federal Reserve's first rate hike.
The dollar rebounded against major currencies in morning trading after data showed U.S. consumer prices rose 0.2 percent in March, while closely watched core consumer prices rose 1.8 percent year-on-year, inching closer to the Fed's 2.0 percent target.
The move was short-lived, however, as traders reverted to selling the dollar on the view that the data was not strong enough to offset a batch of weaker-than-expected economic readings for the first quarter, ranging from retail sales to housing starts.
USB makes a partial comeback.
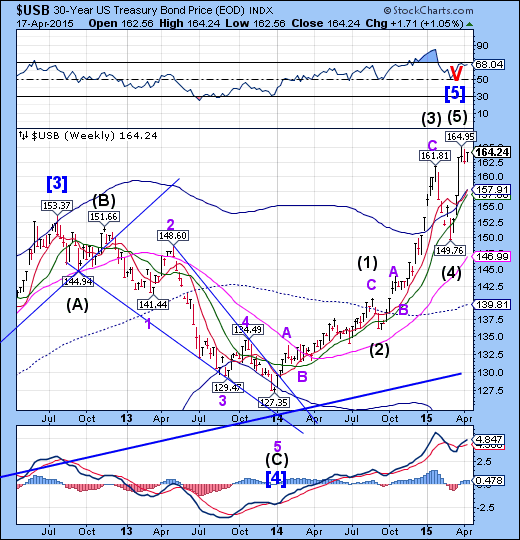
The Long Bond made a 73% retracement of the decline off its high at 164.95. However, that high made on April 1 fulfilled an important technical target and divergences are setting in. A decline beneath the weekly cycle top currently at 157.91 may incite a longer, deeper reaction.
(ZeroHedge) Nearly two years ago we wrote about a phenomenon that has become the most acute problem facing the modern, "QEverywhere" financial system: an unprecedented collateral shortage, as a result of central banks soaking up trillions in "high-quality collateral" in the form of government bonds. To wit from "Desperately Seeking $11.2 Trillion In Collateral":
Over a year ago, we first explained what one of the key terminal problems affecting the modern financial system is: namely the increasing scarcity and disappearance of money-good assets ("safe" or otherwise) which due to the way "modern" finance is structured, where a set universe of assets forms what is known as "high-quality collateral" backstopping trillions of rehypothecated shadow liabilities all of which have negligible margin requirements (and thus provide virtually unlimited leverage) until times turn rough and there is a scramble for collateral, has become perhaps the most critical, and missing, lynchpin of financial stability.
Gold may be testing its right shoulder.
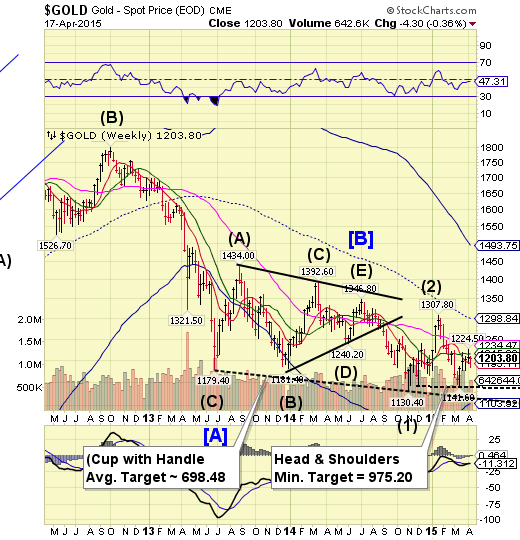
Gold partially retraced what may be the right shoulder of the Head and Shoulders formation after challenging its weekly Short-term support at 1193.11. A failure beneath 1141.60 triggers the formation with a minimum target of 975.20.
(Reuters) - Gold pared gains on Friday, heading for a second weekly drop, after data showing U.S. consumer prices rose in March tempered speculation the Federal Reserve will delay its first interest rate rise in nearly a decade.
The metal held above the $1,200 an ounce level, however, which it broke above earlier this week after a run of downbeat U.S. data led analysts to reassess expectations the Fed would raise rates in June.
Crude extends its rally.
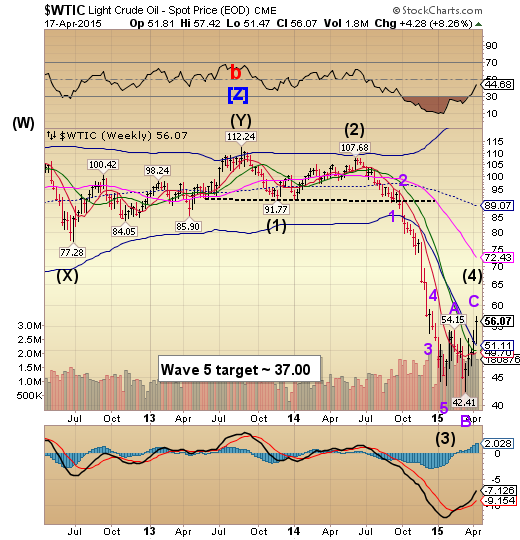
Crude extended its correction, breaking above Cycle Bottom support at 51.11. The higher retracement has altered the calculation for the Wave (5) Target. There is a good probability of a further decline through mid-to-late May.
(Reuters) - Crude futures fell from 2015 peaks in choppy trading on Friday, but Brent's 9.6 percent weekly gain was its biggest in more than five years as Middle East turmoil and signs of lower U.S. production lifted prices.
U.S. crude also retreated from its 2015 high, but registered a fifth straight weekly gain, which at 7.9 percent was the biggest since it jumped 13.5 percent in the week to Feb. 25 2011.
Shanghai Index at a Primary Cycle high?
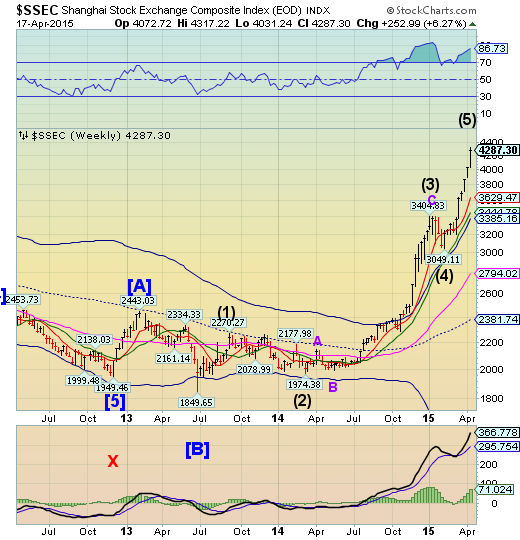
The Shanghai Index appears to have put in a Primary Cycle high today as it completes the end of its year-long bull run. The Cycles Model suggests a probable turn may be imminent. Retail investors are piling onto this index, which is a good indication of an overbought market.After the (Chinese) markets closed on Friday, turmoil broke out, as you may read below.
(ZeroHedge) As noted earlier, while tens of thousands of Bloomberg terminal users were twiddling their thumbs during an outage that lasted several hours, China futs crashed.
There was some confusion about the cause of the rapid move, but it appears the catalyst was an announcement by the China Securities Regulatory Commission in which it allowed fund managers to lend shares for short-selling, and will also expand the number of stocks investors can short sell, in a bid to raise the supply of securities in the market.
The Banking Index bounce fails again.
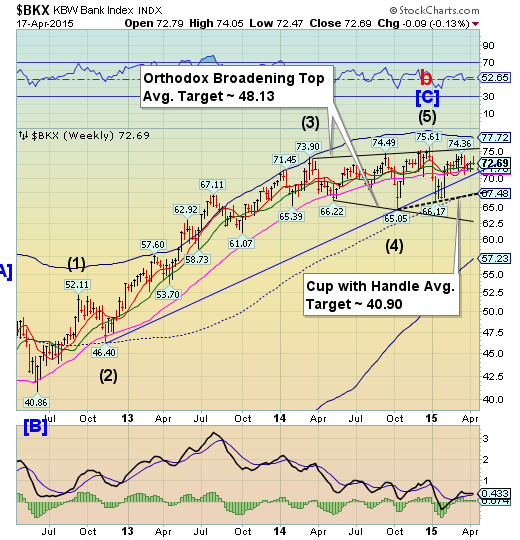
--BKX rallied to its weekly high on Thursday, but gave it all up on Friday, breaking through weekly Short-term support at 72.72. This kind of action is bearish but frustrating until supports finally give way. A resumption of the decline may break several critical supports and trigger as many as three bearish formations. The Cycles Model now implies that the next decline may last through late April. Could this be a waterfall event?
(WSJ) WASHINGTON—Banks already in trouble with the Justice Department for previous misconduct could face tougher penalties in a federal probe into currency rigging, a top federal prosecutor suggested Friday.
Leslie Caldwell, who heads the Justice Department’s criminal division, hinted in a speech that banks under investigation for currency rigging would face harsher punishments if they are already subject to legal action, such as a deferred prosecution or non-prosecution agreement.
“A company that is already subject to a DPA or NPA for violating the law should not expect the same leniency when it crosses the line again,” Ms. Caldwell said at New York University Law School.
(ZeroHedge) Earlier today, we reported that Germany is preparing a contingency plan to deal with the fallout from a Greek default, the odds of which analysts are now putting at even money. According to Die Zeit, Berlin is looking at options to keep the Greek banking sector solvent (i.e. make sure there are still euros in the ATMs) even in the event Athens misses a payment to the IMF next month. Germany also indicated it was prepared to let Greece go should Tsipras, Varoufakis, and their merry band of Syriza socialist saviors be unwilling to adopt reforms in exchange for assistance to the banking sector. In the event the Greek government remains steadfast in its “where’s our money” approach to negotiations, Brussels will reportedly assist the country in transitioning back to the drachma. In the midst of the (continuing) drama, UBS is out with a new note which warns against adopting the idea that a Grexit would prove to be an isolated event.
(ZeroHedge) "We could now be at a crossroads," warns Deutsche Bank in its annual default study report. As the 'artificial bond market' is exposed and yield curves flatten on Fed rate hikes so carry risk-reward is reduced and default cycles have often been linked to the ebbing and flowing of the YC through time with a fairly long lead/lag. With HY defaults having spent 12 of the last 13 years below their long-term average (with the last 5 years the lowest in modern history), "a perfect default storm could be created for 2018 if the Fed raises rates in 2015."
(ZeroHedge) As regular readers know, we’ve variously described the China-led Asian Infrastructure Investment Bank as representing both an attempt by China to cement its regional dominance by implicitly adopting a sino-Monroe Doctrine, as indicative of Beijing’s desire to supplant to US-dominated multinational institutions that have been a fixture of the post WWII economic world order, and, perhaps most importantly, as a not-so-subtle indication that dollar hegemony may be on the way out and yuan hegemony may be around the corner.
