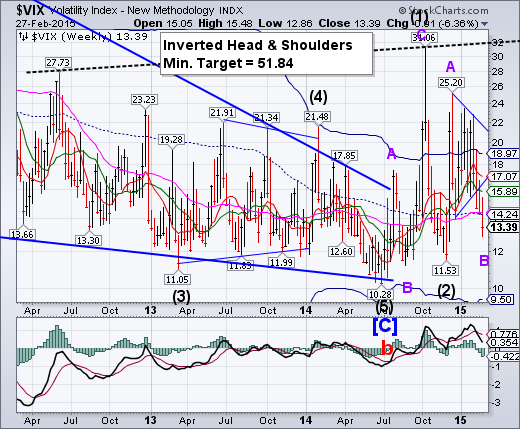
-- VIX extended the “tail” of its Triangle formation this week, bottoming on Wednesday. A rally above the mid-Cycle resistance at 14.24 may confirm that the reversal to new highs may be underway. A rally above the Head & Shoulders neckline may get very exciting.
S&P 500 made a new all-time high, but closed the week at a loss.
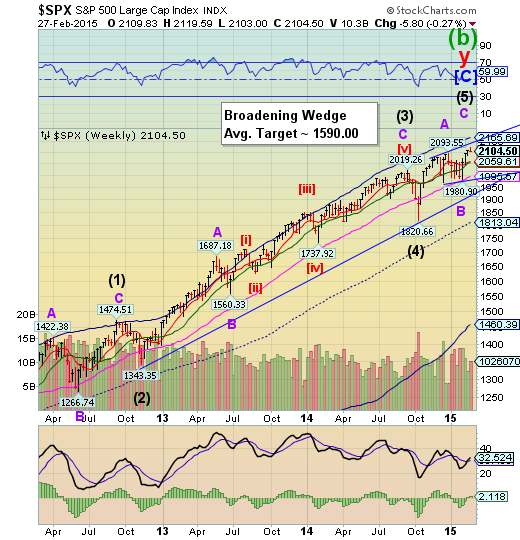
S&P 500 made a new intra-day high at 2119.59 on Wednesday, but gave it up on Thursday and Friday on high volume. It may be too early to call it a top, but this kind of action should put traders on high alert for next week. The next decline may not be saved at Long-term support as the last one was..
(TheStreet) -- All four major stock indexesclosed lower Friday and the stock market finally saw an increase on volume, albeit to the downside.
On up days, the volume has been lower versus the down days, which have seen a pattern of increased volume. The S&P 500 Trust Series ETF (SPY) volume traded over 106 million shares. That was the first trading day of over 100 million shares since Feb. 20.
NDX meets the upper trendline.
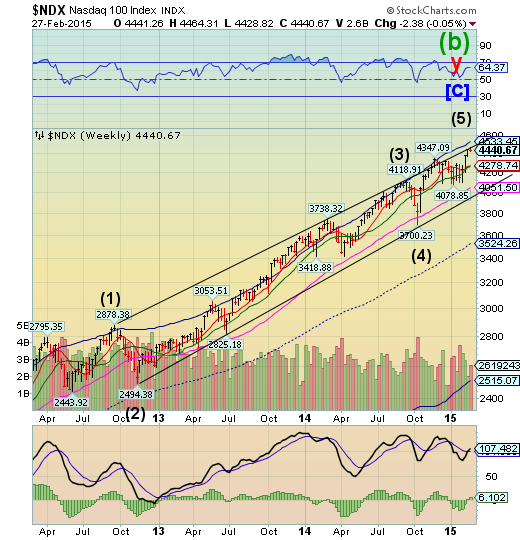
NASDAQ rose to the upper trendline of its trading channel and appears to have been repelled. There has been talk of a sprint to its all-time high at 4816.35, but even a Super Cycle Wave (b) carries no assurance of that event.
The anticipated decline that is due momentarily must carry the NDX to its prior Wave (4) low at 3700.23, or lower. Once the decline begins, it is likely to last until mid-April, so there will be plenty of time to accomplish its goal.
(StreetTalkLive) With the S&P 500 and Dow Jones Industrial Average already hitting real, inflation-adjusted, all-time highs; market participants have now turned their attention towards the Nasdaq Composite. Today's "Chart of the Day" takes a look at just how close, and far, the Nasdaq is from joining the "all-time" high club.
High Yield run for the top weakens...
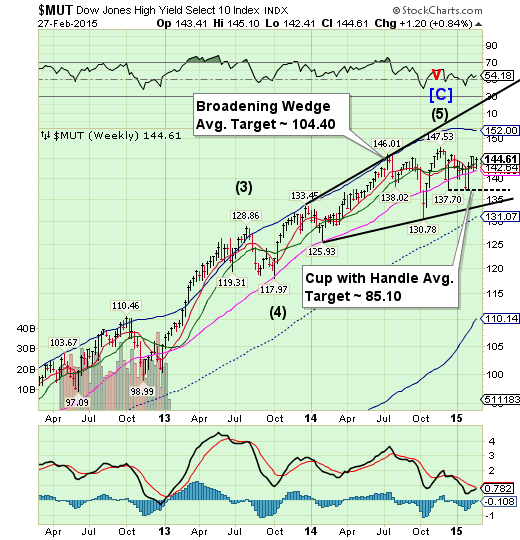
The High Yield Index bounced off weekly Long-term support this week, but could not make a new high. The two remaining formations are its Broadening Wedge and Cup with Handle formations, both carrying high probabilities of success. With lower highs, the upside pattern appears complete, so a reversal may be imminent. The mainstream press has no idea what might be coming…
(StreetTalkLive) With Janet Yellen recently warning about overvaluation in the bond market, I thought it would be important to look at potentially one of the single most overvalued areas in that market - high yield. To wit: "However, the staff report noted valuation pressures in some asset markets. Such pressures were most notable in corporate debt markets, despite some easing in recent months. In addition, valuation pressures appear to be building in the CRE sector, as indicated by rising prices and the easing in lending standards on CRE loans. Finally, the increased role of bond and loan mutual funds, in conjunction with other factors, may have increased the risk that liquidity pressures could emerge in related markets if investor appetite for such assets wanes. The effects on the largest banking firms of the sharp decline in oil prices and developments in foreign exchange markets appeared limited, although other institutions with more concentrated exposures could face strains if oil prices remain at current levels for a prolonged period."
The Euro is at the brink .
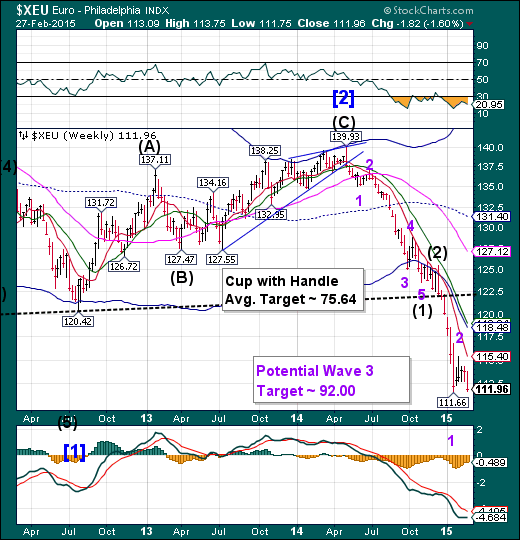
The Euro gave up on its attempts to rally and now is at the brink of another breakdown. It anticipates its next Master Cycle low (Wave 3) in mid- March, which may produce quite a fall. The discussion now is, “How far below parity will the Euro go?”
(ZeroHedge) As the rest of the world appears happy to assume everything is fixed in Europe (and if it's not, Draghi will buy it back to being awesome), Greece is looking unwell once again. Initial exuberance has faded dramatically in the last 3 days as IMF default warnings and a 22.5% plunge in tax revenues has sparked concerns about Greece's sustainability once again. Default (or restructuring) risk is soaring, Greek bond yields are surging, stocks sliding, and Greek banks (bonds and stocks) are getting hammered. As The Guardian's Helena Smith notes, "the country is in a strategic vacuum," and next week's T-Bill auction could be a major catalyst.
EuroStoxx makes its final run to its Broadening Top.
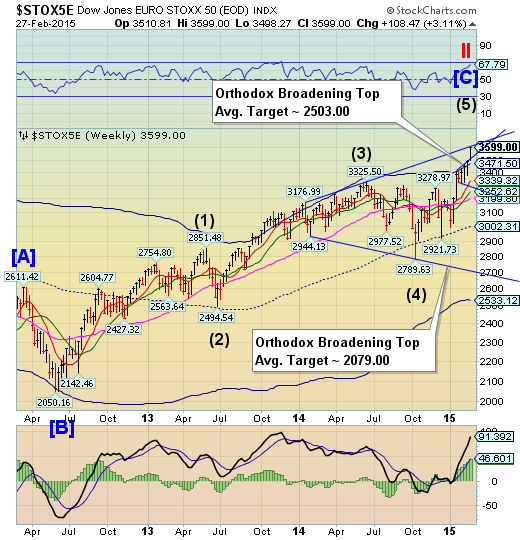
The DJ Euro Stoxx 50 appears to have simultaneously completed the final upward probe of two Orthodox Broadening Tops. The Cycles Model now suggests the next low may come in mid-March.
(Reuters) - European shares edged higher on Friday, pausing after their best start to the year since regional benchmarks began in late 1986, but still supported by positive earnings reports.
Shares in Airbus were up 7.5 percent after it posted a sharp rise in operating earnings, also announcing its biggest ever dividend.
Bank of Ireland rose 7.2 percent after posting its first annual profit since the financial crisis, while shares in International Airlines Group (LONDON:ICAG) rose 2.8 percent upgrading its 2015 profit forecast by more than 20 percent.
The Yen is still lingering at the bottom.
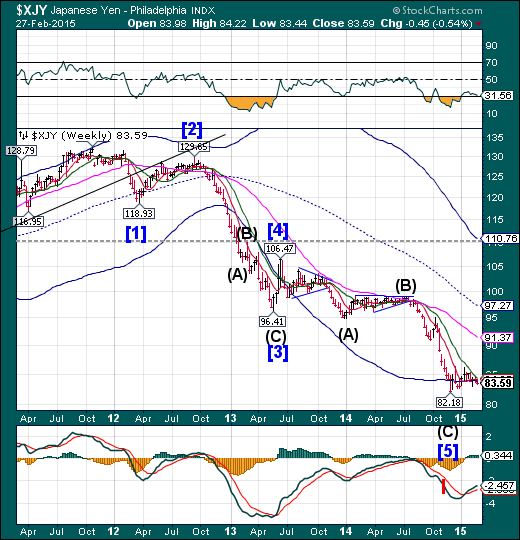
The Yen continues to challenge its Cycle Bottom at 83.79, but hasn’t exceeded the low of December 5, 2014. It has yet to overcome its December 16 high at 86.34. This reversal may take patience, but once the breakout occurs the Yen may gain momentum in its rally. Most traders have not recognized a change of trend…yet.
(Bloomberg) Spare a thought for Japan -- the nation imports almost all its energy and stood to make windfall gains from the collapse in oil prices, only to see the benefits slip away as the yen slumped to near seven-year lows.
This means that Japanese consumers and companies aren't getting as big a boost as in the U.S. and elsewhere, even as the government is counting on them to increase spending to help boost an economy recovering from a recession.
The Nikkei 225 “throws over” its Cycle Top .
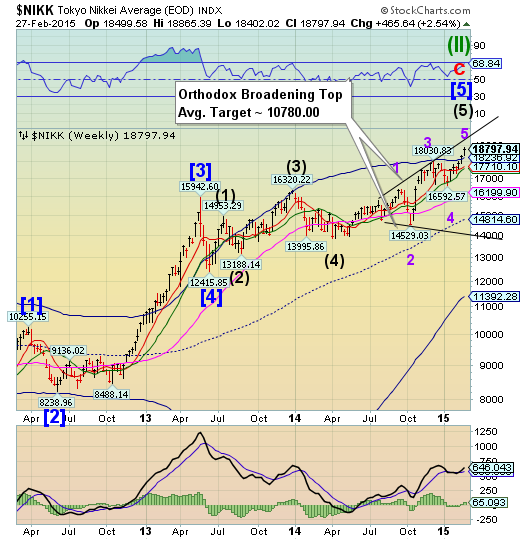
The Nikkei achieved a “Triple 5” Wave high this week as it approaches its 6-year anniversary of the March 9, 2009 low. It may continue rising to its anniversary, but the risk of a reversal is mounting. The Orthodox Broadening Top agrees with that outcome, since it represents a market that is out of control and has a highly emotional public participation. This may be the start of a dramatic decline that may be imminently due.
(Reuters) - Tokyo share prices hit a fresh 15-year high on Friday on upbeat Japanese industrial output data, while the market awaited an announcement from the country's biggest pension fund on its latest asset allocations.
The Nikkei share average rose 0.3 percent to 18,834.89. On the month, it is up 6.6 percent so far, which if sustained, would be the biggest monthly gain since November
2013.
Signs of recovery in exports and outputs, expectations that cheap oil prices will benefit Japanese consumption and companies and hopes of more corporate reforms have been all helping the market.
"It seems like there is no reason to sell other than to take profits," said Takashi Hiroki, chief strategist at Monex Securities.
US Dollar may “shake out” weaker hands.
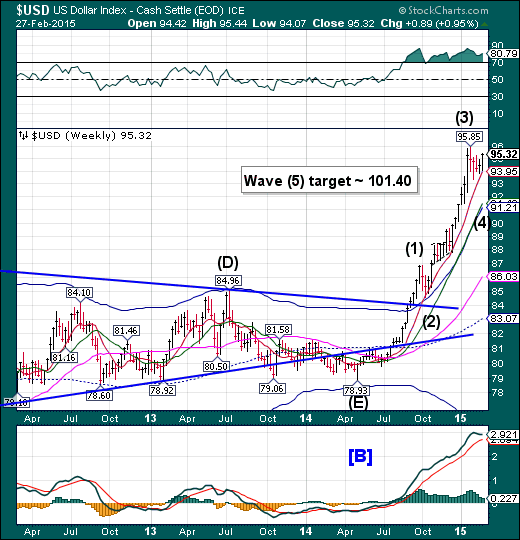
The US Dollar may be ready for a shakeout of weak hands as it appears ready to make a forceful decline to Cycle Top support at 91.21, at a minimum. The Cycles Model appears to be calling for a deeper Wave (4) than witnessed so far. Typically a retracement will fall back on some support level, but it may decline as far as the top of Wave (1). It’s time for caution here.
(Reuters) - Speculators further trimmed bets favoring the U.S. dollar, pushing net longs to their lowest in more than two months, according to data from the Commodity Futures Trading Commission released on Friday.
The value of the dollar's net long position fell to $40.81 billion in the week ended Feb. 24, from $42.04 billion the previous week. Net dollar longs declined for a third straight week.
That said, this was still the ninth straight week that dollar longs have hit at least $40 billion.
USB also may do a shake out.
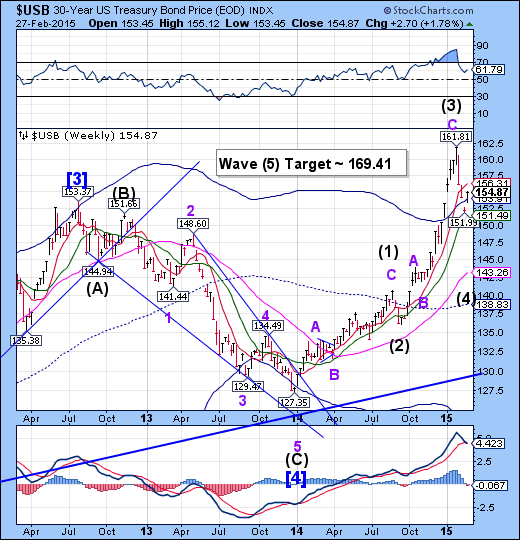
The Long Bond also appears ready for a shake out of weaker hands. For the last two weeks liquidity has been rotating out of bonds and into stocks and commodities as the Cycle inverted. However, other events may also change the direction of money flows as the Euro weakens further and the Yen strengthens.
(WSJ) U.S. government bonds suffered the biggest monthly selloff since June 2013 after soaring over the past year as debate is heating up on whether the Federal Reserve may raise official interest rates in June, or wait longer to act.
The swing came as mixed data in the U.S. and abroad continue to generate uncertainty over the growth outlook. Fed Chairwoman Janet Yellen said earlier this week that while the Fed is moving closer to a rate increase, the timing still hinges on how the economy performs going forward, including inflation data.
Gold bounces, but meets resistance.
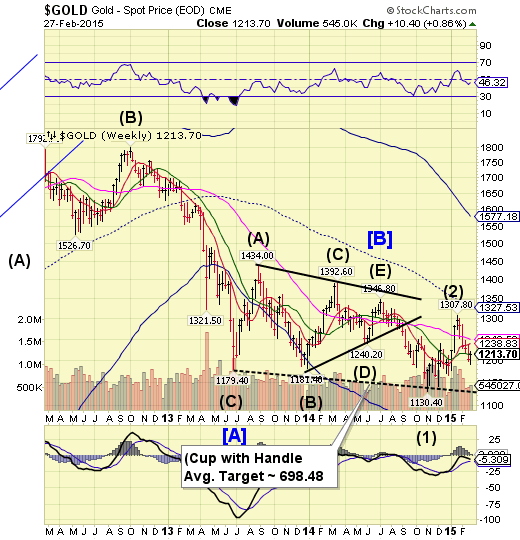
Gold attempted to rise above Intermediate-term resistance at 1216.98, but closed beneath it. It may attempt to bounce further early next week, but should resume its decline by mid-week. The next target may be the Lip of its Cup with Handle formation.
(WSJ) Gold prices ticked higher Friday as investors bet the Federal Reserve won’t rush in shifting to a tighter monetary policy.
The most actively traded contract, for April delivery, rose $3, or 0.3%, to settle at $1,213.10 a troy ounce on the Comex division of the New York Mercantile Exchange.
Prices have moved higher in recent days, after Federal Reserve Chairwoman Janet Yellen told lawmakers that while the central bank is closer to raising interest rates, such a move still depends on U.S. economic data. Ms. Yellen, in testimony to Congress on Tuesday and Wednesday, said wage growth and inflation must climb before rates can be raised, even though the labor market has shown signs of improvement.
Crude Oil may be capable of a higher rally.
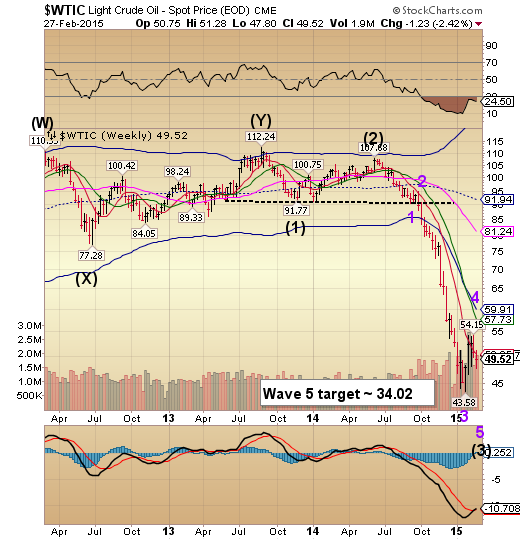
Crude appears to be capable of a further rally on the pullback of the Dollar. It may either rally to its weekly Cycle Bottom resistance currently at 59.91 or possibly higher. This may allow the weaker (short) hands to be shaken out even more. I’m repeating myself from two weeks ago, but these markets can quickly go from boredom to panic and back again. A decline beneath 43.58 suggests that the decline has resumed.
(WSJ) Volatility is roiling the oil market, luring traders in search of quick profits but discouraging longer-term investors who had grown accustomed to more muted swings.
Crude prices tumbled Thursday to their lowest levels in nearly a month after data released Wednesday showed inventories continuing to swell.
Volatility has surged in recent months following a bruising selloff that cut global benchmark prices by 60% from June through January. That was followed by a jump of more than 30% in the first two weeks of this month.
Shanghai Index shows a reversal pattern.
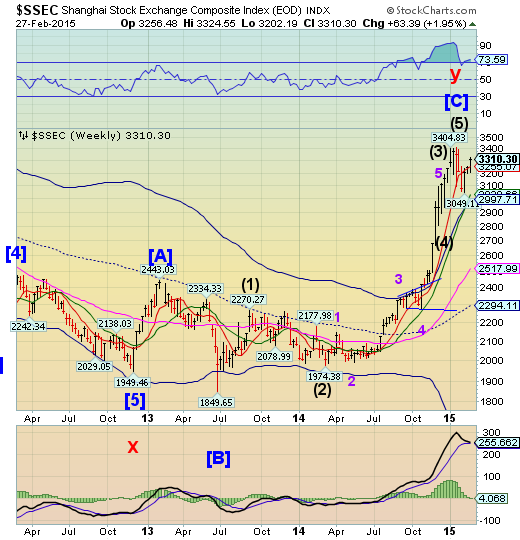
The Shanghai Index rallied above Short-term support/resistance this week, but could not close above its January 22 peak. The Shanghai Index appears to have completed a reversal pattern that may result in a panic decline that could last into May. The decline may go to weekly Long-term support at 2517.99 or possibly mid-Cycle support at 2294.11 by early March. Volatility is on the rise in China, despite massive liquidity injections.
(ZeroHedge) And then there were 21.
Hours ago on Saturday, the country whose currency is largely pegged to the dollar which itself is now anticipating a rate hike in the coming months, surprised the world by confirming its economic slowdown yet again following a recent rate cut just this past November when it lowered its benchmark rate by 40 bps, after it again cut benchmark lending and deposit rates by 25 bps starting on March 1. Specifically, the PBOC will lower the one-year lending rate to 5.35% from 5.6% and its one-year deposit rate to 2.5% from 2.75%. It also said it would raise the maximum interest rate on bank deposits to 130% of the benchmark rate from 120%.
The Goldman Sachs (NYSE:GS) Banking Index (NSE:BBES) losing its grip.
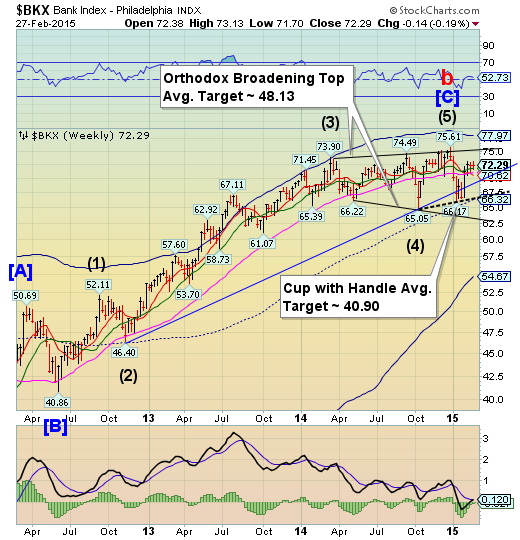
-- BKX extended its retracement rally with a high of 73.21 on Tuesday, but couldn’t change its bearish outlook. This is the index that will lead equities and commodities in their next decline. The Cycles Model now implies that the next decline may last through mid-April. Could this be a waterfall event? Here come the bank failures.
(ZeroHedge) Based on Bloomberg data, Doral Bank is the 3rd largest (by assets) bank in Puerto Rico...or rather was. After a 58% collapse in the share price today, news broke after the close:
*PUERTO RICO'S DORAL BANK PLACED UNDER FDIC RECEIVERSHIP
*PUERTO RICO'S BANCO POPULAR AGREES TO BUY DORAL BANK OPERATIONS
Banco Popular will take the deposits (and 8 of Doral's 26 branches) and the FDIC, aka America's bad bank, eats the bad debt estimated to cost the Deposit Insurance Fund (DIF), as in the US taxpayer, some $748.9 million.
(ZeroHedge) A month ago, we wrote about a bizarre situation involving Denmark's now totally broken monetary system, where as a result of an unprecedented scramble to weaken the currency in order to preserve the peg to the Euro the central bank unleashed a historic rate-cutting scramble, where in 4 consecutive rate cuts its pushed the interest rate to an unheard of -0.75% (while at the same time being the first modern central bank to unveil what we dubbed "Bizarro Backdoor QE"). The culmination of this series of events was the surreal realization by some debtors that the bank would now pay them the interest on their new or existing mortgage.
(Bloomberg) -- Global regulators have issued dozens of rules aimed at making the biggest banks safer. That’s leading to another result some wanted: making them shrink.
HSBC Holdings Plc (LONDON:HSBA), Europe’s biggest bank by market value, said this week it’s considering “extreme solutions” for some of its units. Royal Bank of Scotland Group (LONDON:RBS) Plc is reducing its U.S. trading staff and getting out of two-thirds of the countries where it operates. JPMorgan Chase (NYSE:JPM) & Co (NYSE:JPM). is closing branches, raising fees on some institutional deposits and looking for ways to shrink its trading businesses.
(ZeroHedge) Moments ago the Bank of Greece presented its latest, January, deposit data. And it's a doozy: following a record €12.2 billion monthly outflow, greater in absolute and relative terms than anything experienced during any of the previous Greek crises and bailouts, the total amount of Greek corporate and household deposits has now tumbled to just €148 billion, down 7.7% from the month before, and down 10% since November. This number is in line with some of the more pessimistic expectations, and brings the total cash holdings at Greek banks to the lowest level since August 2005.
Disclaimer: Nothing in this email should be construed as a personal recommendation to buy, hold or sell short any security. The Practical Investor, LLC (TPI) may provide a status report of certain indexes or their proxies using a proprietary model. At no time shall a reader be justified in inferring that personal investment advice is intended. Investing carries certain risks of losses and leveraged products and futures may be especially volatile. Information provided by TPI is expressed in good faith, but is not guaranteed. A perfect market service does not exist. Long-term success in the market demands recognition that error and uncertainty are a part of any effort to assess the probable outcome of any given investment. Please consult your financial advisor to explain all risks before making any investment decision. It is not possible to invest in any index.
