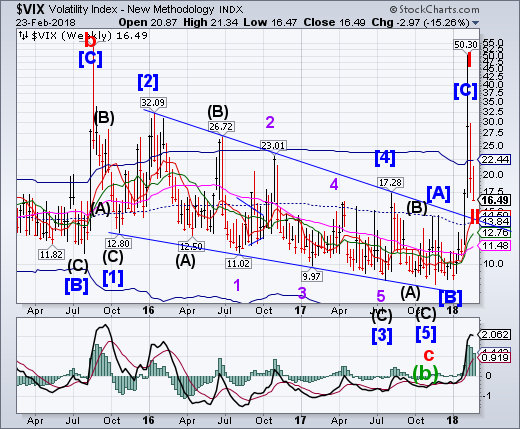
VIX expanded its retracement to 81% in the two week period since its high.While this has allowed market participants to relax about risk, the fact remains that, should it turn higher, it will be immediately back on a buy signal.The downtrend in the VIX is broken. The next Cycle Top may occur in the next 4 weeks.
(Bloomberg) China stopped updating its homegrown version of the VIX Index, taking another step to discourage speculation in equity-linked options after authorities tightened trading restrictions last week.
State-run China Securities Index Co. didn’t publish a value for the Shanghai SE 50 Volatility Index on its website Thursday. An employee who answered CSI’s inquiry line said the company stopped updating the measure to work on an upgrade. The move was designed to curb activity in the options market, said people familiar with the matter, who asked not to be identified discussing private information. It’s unclear when the index will resume.
SPX closes flat for the week.
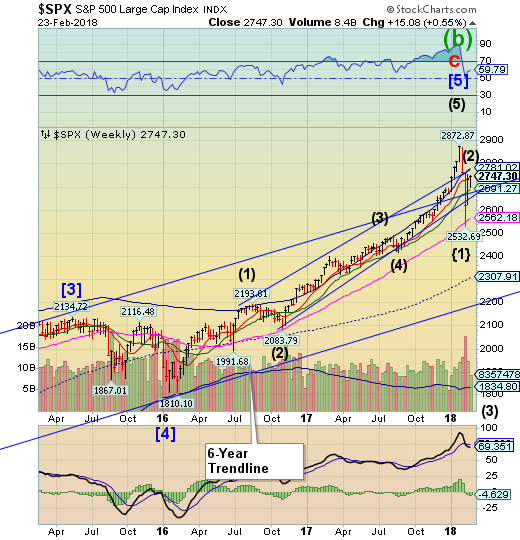
S&P 500 began its descent early this week but retraced most of its losses on Friday. It closed just above Short-term support/resistance at 2743.07. However, it closed beneath last week’s high at 2754.42 leaving this week as an inside week, denoting uncertainty. The retest of the lows may still be in the cards.
(Reuters) - US stocks advanced on Friday, buoyed by gains in technology stocks and a pullback in Treasury yields as the Federal Reserve eased concerns about the path of interest rate hikes this year.
The central bank, looking past the recent stock market sell-off and inflation concerns, said it expected economic growth to remain steady and saw no serious risks on the horizon that might pause its planned pace of rate hikes.
Investors largely expect the Fed to raise rates three times this year, beginning with its next meeting in March, the first under new Chair Jerome Powell. Traders currently see a 95.5 percent chance of a quarter-point hike next month, according to Thomson Reuters data.
NDX pushes through its Cycle Top.
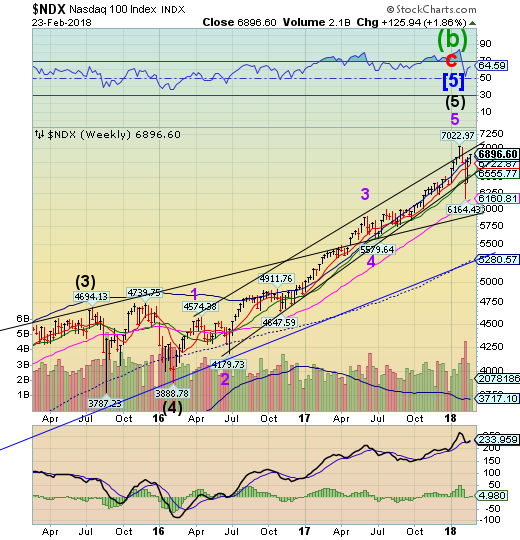
The Nasdaq 100 closed above its weekly Cycle Top at 6844.05 after finding support at the Short-term support level. A decline beneath Cycle Top resistance allow the NDX to do a retests of the lower supports. A failure here allows the NDX to decline to mid-Cycle support and the 7-year trendline at 5280.57. A breakthrough at that point suggests a further decline to the October 2011 low.
(Reuters) - US stocks rallied on Friday, lifted by gains in technology stocks and a retreat in Treasury yields as the Federal Reserve eased concerns about the path of interest rate hikes this year.
The US central bank, looking past the recent stock market sell-off and inflation concerns, said it expected economic growth to remain steady and saw no serious risks on the horizon that might pause its planned pace of rate hikes.
Investors largely expect the Fed to raise rates three times this year, beginning with its next meeting in March, the first under new Chair Jerome Powell. Traders currently see a 95.5 percent chance of a quarter-percentage-point hike next month, according to Thomson Reuters data.
High Yield Bond Index has an indecisive week.
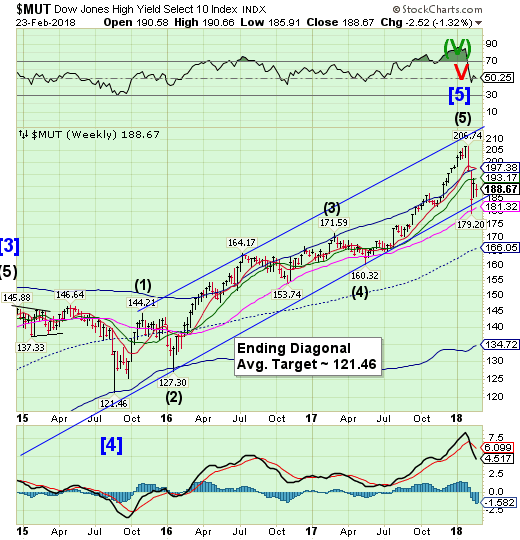
The Dow Jones High Yield Select 10 pulled back in an inside week that left no clue what it will do next. The sell signal remains and the Cycles Model suggests additional weakness going forward.
(ZeroHedge) Despite rebounds in US (and less so European) equities and drops in both the regions which VIX measures, the last few days have seen an ominous reawakening in credit markets that is far more systemically concerning than a volatility ETN.
European credit spreads are back near cycle wides.
And it's not just HY credit, US investment grade credit spreads are starting to crack wider and US HY spreads are pushing back towards last week's wides.
UST may have started a bounce.
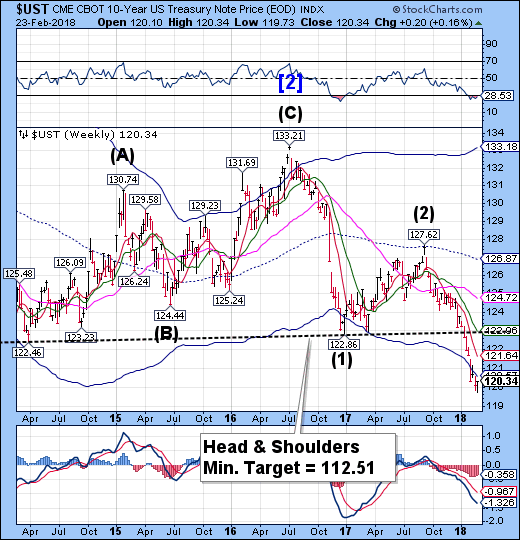
The 10-Year Treasury Note Index extended its Master Cycle low to Wednesday and appears to have started a bounce.The target for this bounce may be a retest of the Head & Shoulders neckline near 122.50.The bounce may last 2-3 weeks.
(ZeroHedge) As Bloomberg's Michael Regan writes, "pinpointing the exact level of Treasury yields that will break the back of the bull market has become the trendiest parlor game in town." Earlier today, Tom Lee of Fundstrat became the latest to chime in, predicting that rates - which are rising due to reflation - should support higher P/E ratios until interest rates are above 4%.
Then, it was Jeff Gundlach's turn.
Recall that it was Gundlach who duriong a DoubleLine webcast on January 9 predicted that if the 10-Year goes to 2.63% - it was at 2.50% then - "stocks will be negatively impacted." However, he also added that if the 10Y TSY passes 2.63%, it will head well higher, likely pushing toward 3%. Gundlach also was the first to note that he expects a 3.25% print on the 10Y in 2018, a target which was since adopted by both Goldman and, today, Bank of America.
The euro makes an inside consolidation.
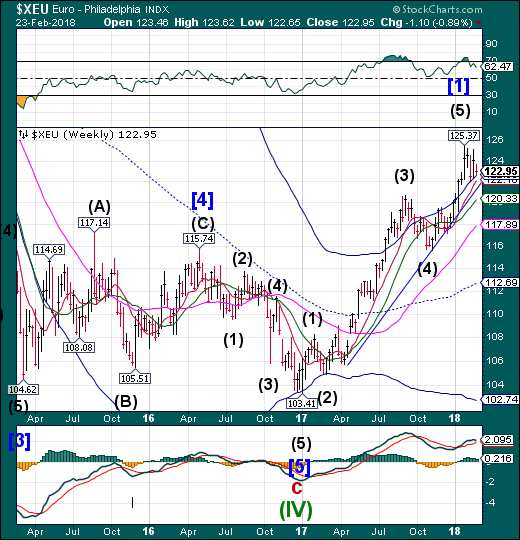
The euro is still being supported by a rising Cycle Top in an inside week of trading. The Cycle Top isn’t broken, but a failure to make a new high suggests a reversal may be at hand. If so, XEU may decline to is mid-Cycle support at 112.69.
(CNBC) The euro could hit $1.30 in the next 12 months as the European Central Bank (ECB) unwinds its stimulus, economic growth continues and political risks dissipate further, analysts told CNBC.
Markets forecast a gradual reduction in the ECB's quantitative program as inflation expectations in the region increase. ECB minutes released Thursday indicated once more that inflation, the most important economic indicator at the central bank, is picking up at a faster pace. This has fueled calls that the need for a significant monetary stimulus is over.
Euro Stoxx expanded its bounce.
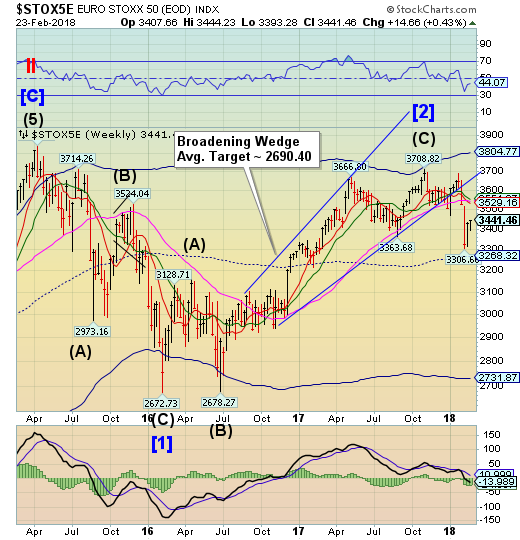
TheEuro Stoxx 50 Index expanded its bounce this week, but has not achieved the 38.2% retracement level.The Cycles Model suggests the decline may resume early next week for a decline through late March.
(ZeroHedge) Following dismal PMIs across Europe yesterday, the region's equity market rebound is rolling over today and has triggered the dreaded 'death cross,' last seen in September 2015 before stocks legged notably lower.
European economic data has been dramatically disappointing recently (weakest since Sept 2016)...
The 50-day moving-average has crossed below the 200-day moving-average just as the dead-cat-bounce in European stocks rolls over...
The Yen has an inside week.
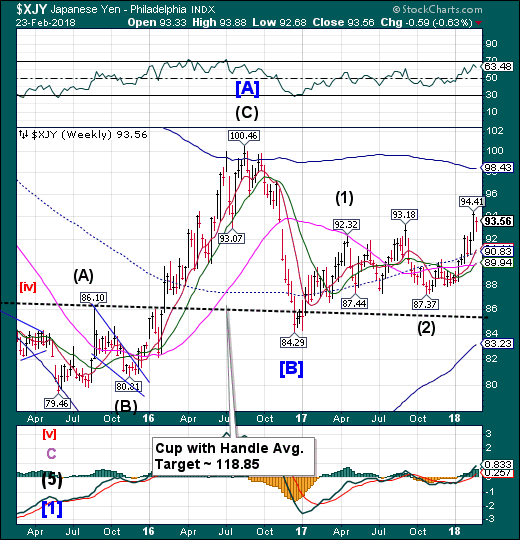
The yen broke consolidated its gains in an inside week. The Cycles Model suggested a possible brief consolidation, but the trend is solidly higher through early to mid-March.
(Reuters) - The dollar edged up against the yen and other currencies on Friday, trimming earlier losses, as global investors gingerly dipped their toes back into riskier assets amid rapidly shifting views on US monetary policy.
The dollar edged up 0.1 percent to 106.850 yen.
It had dropped nearly 1 percent overnight as US Treasury yields retreated from four-year peaks.
The greenback was given some reprieve, however, as yields leveled off.
Japan’s Nikkei rose 0.4 percent and MSCI’s broadest index of Asia-Pacific shares outside Japan adding 0.9 percent.
The market focus was on whether equities could extend their gains should US yields resume rising.
Nikkei makes a higher retracement.
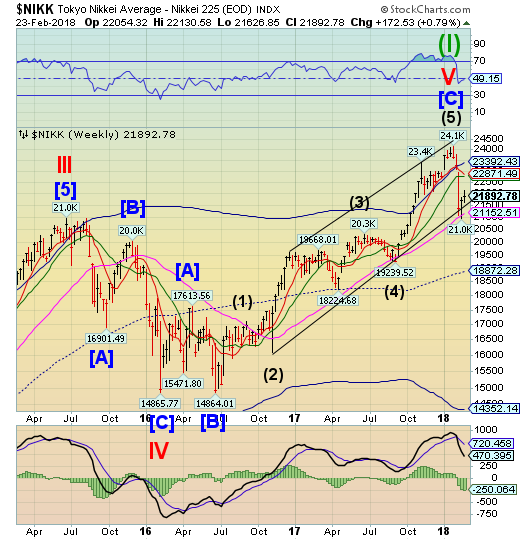
The Nikkei continued its retracement to attain the 38.2% retracement level, but has given back some of its gains later in the week. Cyclical strength appears to have dissipated quickly as a major low may be due in the next week or so. Supports have been violated and are due to be retested.
(Bloomberg) Japanese retail investors bought domestic stocks for a fourth consecutive week, stoking hope that foreign buyers will join them in helping the market make a full recovery from a rout that started last month.
Individual investors last week added to their record net purchases of the nation’s stocks, yet foreigners were net sellers for a sixth straight week. Overseas players -- who generated 68 percent of the market’s equity trading value last month -- have to start buying more if Japan’s equity benchmark is to rebound from its 10 percent correction, analysts said.
US Dollar rallies above key support.
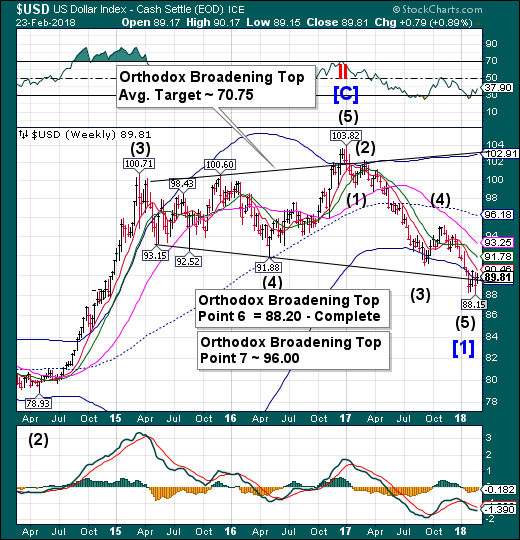
USD rallied above its Broadening Top trendline ans Cycle Bottom support/resistance at 89.45.TheCycles Model indicates a probable rally over the next 2 weeks. There is a Broadening Top “Point 7” target near the weekly mid-Cycle resistance at 96.18.
(DailyFX) There is a popular adage that markets will do what they need to do to disappoint the most people at any one time. The recent USD out-performance has helped that adage ring true and most notably against commodity currencies like the Canadian dollar and Australian dollar as well as the EUR.
Institutions are known as smart money, but they often get caught crowded into popular trades that are quick to reverse. One of those is the play of selling the US dollar. Per Bank of America Merrill Lynch (NYSE:BAC), the short US dollar trade is the second most crowded trade second to bullish US equities and the most crowded FX trade.
The short-term outlook has seen focus turned to the concerns of the US fiscal expansion late into an economic cycle and the view that other major central banks normalization anticipation will drive up their currencies, and keep global capital flows as limiting USD upside
.Gold falls beneath Short-term support.
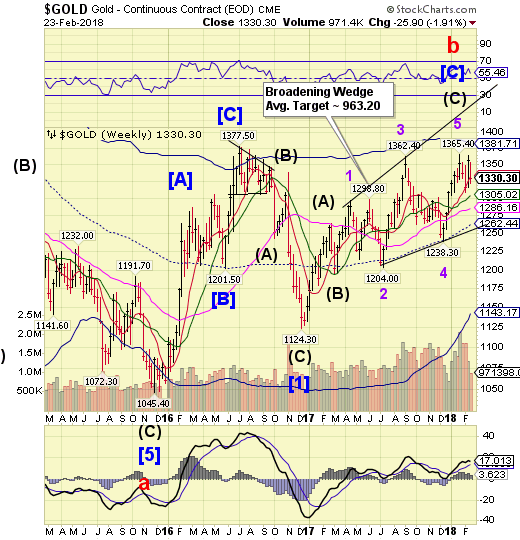
Gold has fallen back beneath Short-term support at 1332.36 this week. This implies a loss of prior supports and additional follow-through to the decline.If so, the proposed target appears to be the lower trendline of the Broadening Wedge formation near 1260.00
(SeekingAlpha) Gold is faring quite well today technically, though you sure wouldn't know it from the rampant bearish sentiment. Gold's price is in a strong uptrend over a year old, high in both its current upleg and young bull market. Gold isn't far from breaking out to its best levels since September 2013, a really big deal. The stock markets even finally sold off after years of unnatural calm. Yet traders are still down on gold.
Across all markets price action drives psychology. When something's price is rising, traders get excited and bullish on it. So, they increasingly buy to ride that upside momentum, amplifying it. Of course, the opposite is true when a price is falling, which breeds bearishness and capital flight. Given gold's great technical picture today, investors and speculators alike should be growing enthusiastic about its upside potential.
Crude surges to its Cycle Top resistance.
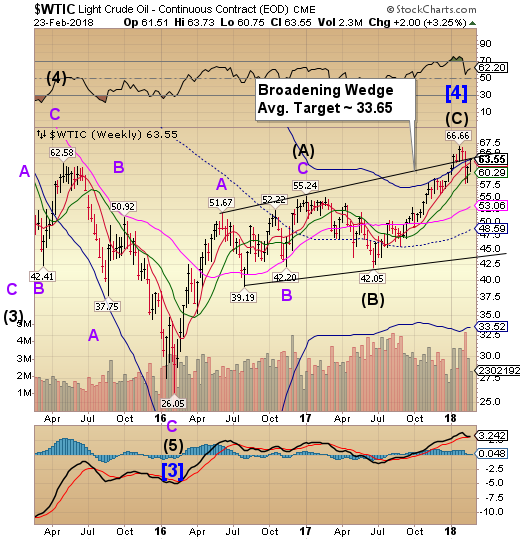
Crude Oil surged this week to its Broadening Wedge trendline and Cycle Top resistance at 63.67 in a 66% retracement of its decline from the January high.The Cycles Model suggests that the current strength is about to run out over the next week. A break of the Intermediate-term support at 60.29 gives crude a sell signal..
(Reuters) - Oil prices rose to two-week highs on Thursday, boosted by data showing a surprise draw in US crude inventories and also by a drop in the dollar.
West Texas Intermediate (WTI) crude CLc1 futures rose $1.09, or about 1.8 percent, to settle at $62.77 a barrel. US crude traded between $60.75 and $63.09, its highest since Feb. 7.
