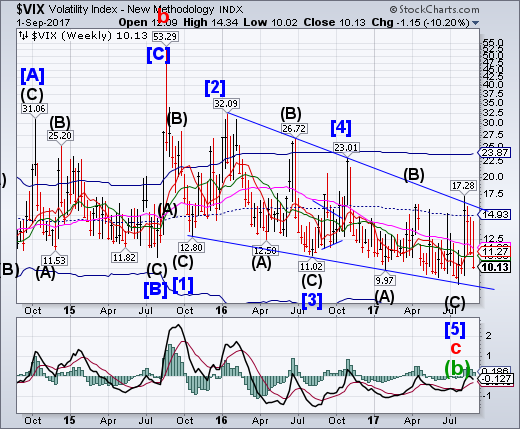
VIX retraced 86% of its rally, closing beneath its Intermediate-term support at 10.93. It is temporarily off its weekly buy signal. Confirmation comes above that level and the subsequent move may be very fast. Ending Diagonal patterns are known to completely retrace themselves, once broken. Could the initial foray have broken the trendline already?
Volatility, volatility, volatility. Market participants who are looking for volatility to find trading opportunities might have something to look forward to. Generally, most of the historical market crashes have been preceded by a decrease in volatility and often referred to as the calm before the storm. So could it happen again?
It is now a decade on since the onset of the credit crisis and coming up to the 30th anniversary of Black Monday, the stock market crash that occurred on October 19, 1987, that saw the Dow Jones Industrial Average lose a hefty 500 points on the day. By the end of that month leading stock markets around the globe had declined by between 30% and 40%.
SPX Crosses makes a partial retracement.
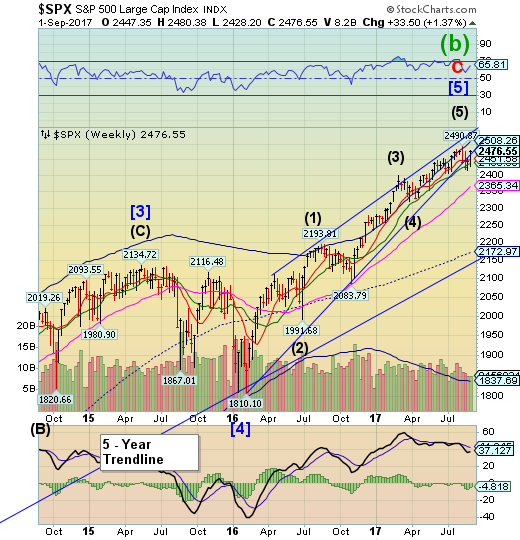
SPX rallied within 10 points of ita August 8 high (2490.87) but did not break out. A reversal beneath Short-term support at 2451.58 may re-introduce the sell signal. Should SPX not break above its prior high the current formation suggests a probable decline to or below 2300.00.
Wall Street gained on Friday as a tepid U.S. jobs report did little to change bets for another interest rate hike this year, while investors were on track to kick off a typically dour month for stocks on a positive note.
NDX makes a new all-time high
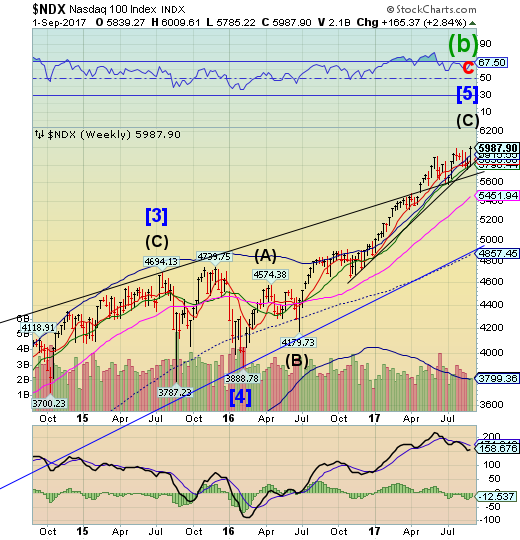
NDX rallied to a new all-time high today in a throw-over above its 6-year Ending Diagonal.Intermediate-term support and the nearby trendline at 5796.44 are providing critical support. A decline beneath Intermediate-term support and its Brexit trendline may produce a sell signal.
Despite their hefty price tag, the FANG stocks and Apple (NASDAQ:AAPL) have had remarkable staying power, surviving a sell-off and reaching record share price highs. But has the relative safety of the tech giants come to an end?
As the world grappled with North Korea's latest aggression and Hurricane Harvey wreaking havoc in Houston, Apple was on the verge of something monumental.
Apple, which had more than $30bn (£23.2bn, €25.1bn) wiped off its share price on 9 June after plummeting to $148.98 per share, began trading at a record high of $162.86 per share.
If its shares rally another 14-15%, the Silicon Valley superstar will become the first firm in history to breach the $1trn market capitalisation.
High Yield Bond Index makes a new all-time high.
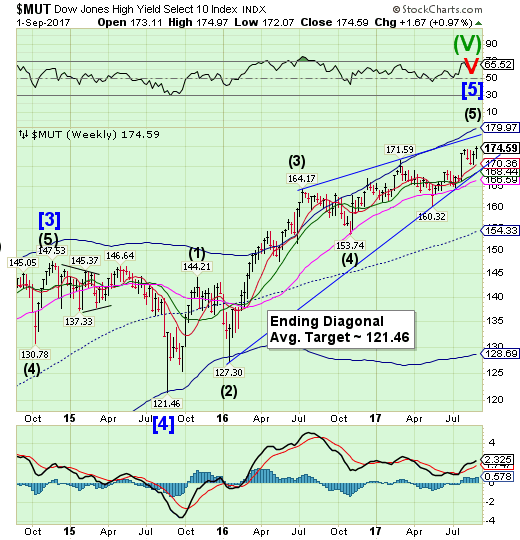
The High Yield Bond Index stair-stepped to an all-time high. The Cycles Model suggestsits period of strength may be over. A sell signal may be generated should MUT fall beneath Intermediate-term support and its Ending diagonal trendline at 168.44.
After a tough summer for junk bonds, with investors yanking cash out of the market, the clouds are gathering for a potentially stormy fall.
September is typically among the busiest periods of the year for debt sales, posing a risk to issuers of high-yield bonds after fund managers from Pacific Investment Management Co. to DoubleLine Capital turned bearish on the asset class. How the market adjusts to the coming wave of supply will determine whether the recent slump proves to be just a blip.
USB shows caution in the bond market.
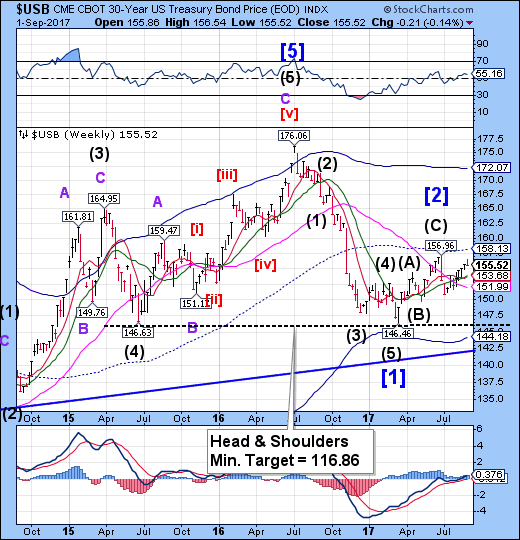
The Long Bond appears to have reversed without a breakout to new highs. Treasuries may have begun their period of weakness that may last through mid-month. Should the right shoulder of a potential Head & Shoulders be complete, then a sell-off of a major proportion may begin.
10-Year benchmark Treasury yield briefly fell through the 2.10% mark earlier this week, the lowest level since Nov. 10.
Treasury prices ended lower on Friday, nudging yields up, after briefly rallying following a weaker-than-expected August jobs report.
Selling gathered steam after a U.S. manufacturing sentiment gauge hit a six-year high.
But Friday's moves gave little direction to the week, as Treasury yields across the board returned close to where they had started on Monday. Geopolitical tensions in North Korea and another soft inflation reading for were counteracted by investor concerns that Treasury yields were too low.
The euro reverses above Cycle Top resistance.
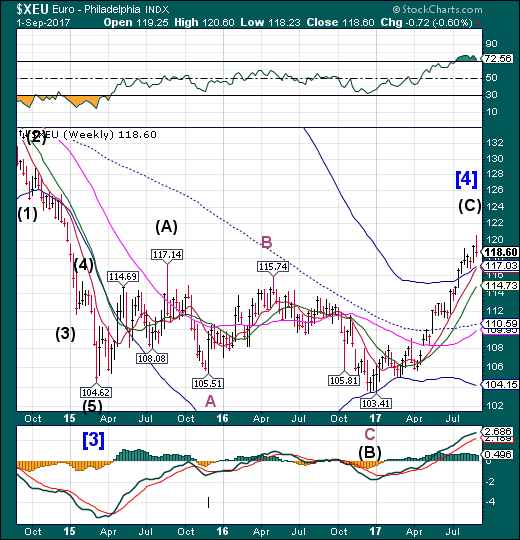
The euro may have completed its rally on Tuesday, making a 46.5% retracement of it decline. The Cycles Model suggests that the period of strength may have ended and calls for a major reversal. A decline beneath the Cycle Top may be a sell signal. Traders are looking for a higher Euro, but it has reached a technical limit to this rally.
The euro's surge above $1.20 for the first time since the start of 2015 has captivated the foreign-exchange market. The rally has been seen as further confirmation of Europe's economic recovery after years of debt crises and political instability. The question now is whether the euro is becoming too strong and at risk of "overshooting" its long-term fair value.
The debate has become more intense since European Central Bank President Mario Draghi failed to address the euro's appreciation in his Aug. 25 speech at the Federal Reserve's Jackson Hole retreat. That led many traders to speculate the ECB is relatively comfortable with the euro's appreciation. If that's the case, then the euro may gain all the way to $1.25, which is where it was trading when the ECB started its quantitative easing measures in 2015.
Euro Stoxx breaks the Head &Shoulders formation.
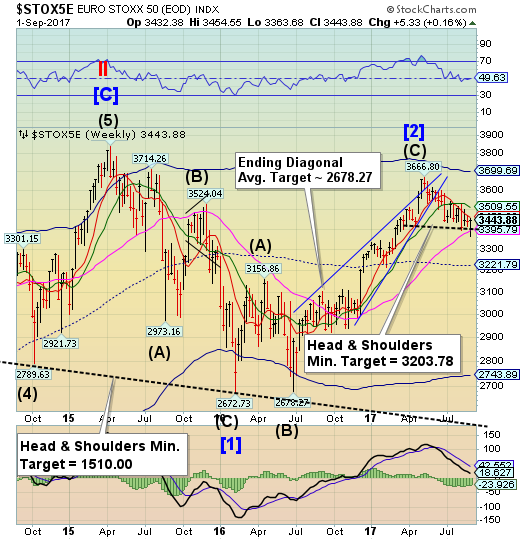
The EuroStoxx 50 Indexfinally broke through the Headand Shoulders neckline and Long-term support at 3395.79. That, in turn, produced a bounce back to Short-term resistance at 3459.83. The breakdown is indicative of weakness that may set a cascading decline unto motion. The Cycles Model suggests a possible significant low next week.
Investors piled back into European stocks on Wednesday, boosting indexes higher in a rally a day after geopolitical concern caused a drop across equity markets.
The pan-European STOXX 600 gained 0.7 percent, recovering nearly all the ground lost the day before when North Korea’s missile launch sparked a sell-off.
Euro zone stocks and blue chips STOXX50E rose 0.6 percent.
The yen breaks out.
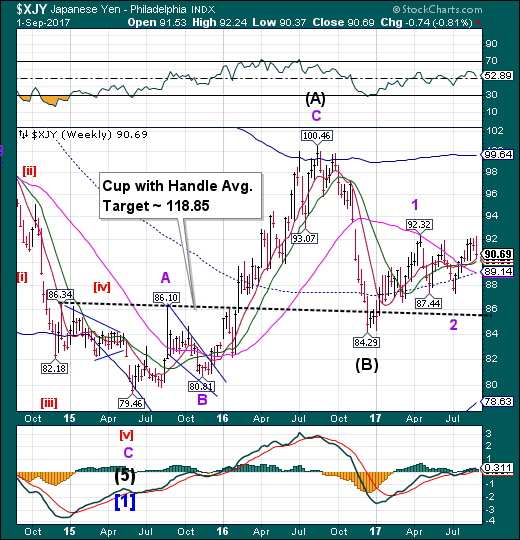
The yen consolidated down to Short-term support at 90.29.It hasn’t yet broken out, but remains on a full-blown buy signal. It may have completed a Trading Cycle low this week, which gives it the opportunity to resume its rally.
Just why do investors flock to the yen in times of trouble, even when the trouble is on the Korean peninsula?
That question gained added relevance on Tuesday as the currency once again performed a post-North Korea provocation rally. The yen hit the highest since April, surging with safe-haven assets including U.S. Treasuries, gold and the Swiss franc after Kim Jong Un’s latest ballistic missile test. The gains were all the more impressive because the rocket flew directly over Japan.
Nikkei bounces at Long-term support.
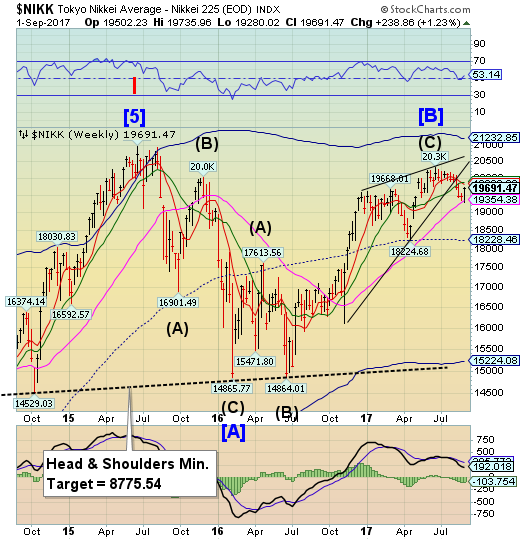
The Nikkei bounced at Long-term support at 19354.38 on Tuesday. The retracement may take another week, but Cyclical resistance lies at 19822.00 to 19875.00. A much deeper low lies await at the end of September.
Japan's Nikkei share average touched its lowest intraday level in almost four months on Tuesday, as a missile fired by North Korea over Japan put investors on edge and increased the yen's safe-haven appeal. The Nikkei ended 0.5 per cent lower at 19,362.55. At one point in the morning, it reached 19,280.02, a 0.9 per cent drop for the day and the lowest level since May 1. The benchmark index, which has lost 1.2 per cent in August, fell below its 200-day moving average.
US dollar probed beneath its cycle bottom
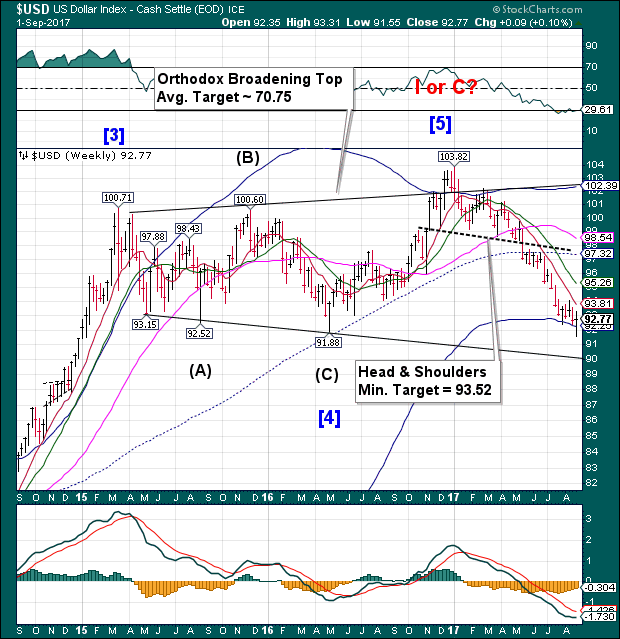
USD probed beneath its Weekly Cycle Bottom support at 92.25 on Tuesday, but closed the week above it. While there may be some bounce left, note that the weekly short-term resistance is at 93.81, which may limit its momentum. The lower trendline of the Orthodox Broadening Top at 90.00 may be the next attractor.
The bad news just keeps piling on for the dollar.
The US dollar index has fallen every month since February. This is its longest losing streak in 14 years. At some point, a correction is to be expected, especially given that the economy seems to be humming along nicely. This week, data showed US GDP grew at its fastest rate in more than two years in the second quarter of 2017. Today’s jobs report could have been the day it turned around. But it didn’t:
Gold is at a turn date.
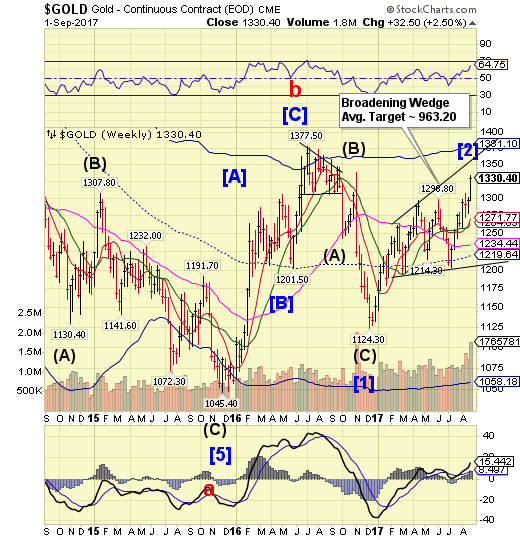
Gold has inverted its Cycle, making a new retracement high. Friday was the ideal Cycle turn date, so Monday morning may offer a downside surprise. The Cycles Model suggests a probable week-long decline to kick things off. We will assess the damages next week..
(FoxBusiness) Gold prices rose Friday after the latest monthly U.S. jobs report came in weaker than economists expected.
Continue Reading Below
Gold for December delivery closed up 0.6% at $1,330.40 a troy ounce on the Comex division of the New York Mercantile Exchange, its highest close since September 2016. The precious metal had its best week since February, supported by geopolitical tensions and growing doubts about the Federal Reserve raising rates for a third time in 2017.
Crude tests mid-Cycle support.
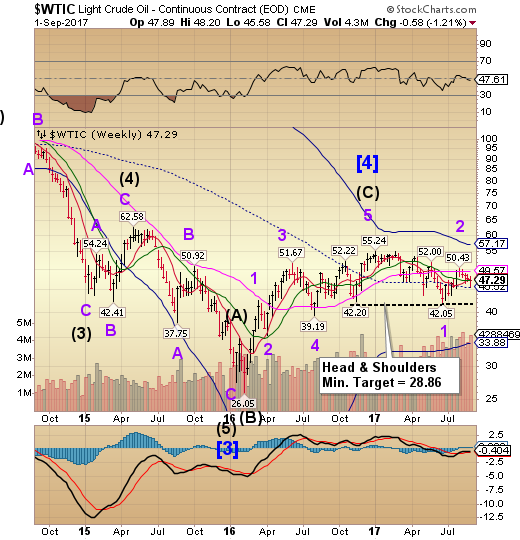
Crude declined to mid-cycle support at 45.52 on Thursday before a quick recovery on Friday.Intermediate-term resistance at 47.31 appears to have stopped the bounce. The sell signal is potentially in play with confirmation beneath mid-Cycle support.
Benchmark U.S. gasoline prices slid for the first day since Hurricane Harvey struck the U.S. oil industry heartland, as some refineries restarted operations, while oil prices remained under pressure and settled about flat.
Harvey, downgraded to a tropical storm and losing steam as it moved inland, killed more than 40 people and brought record flooding that shut at least 4.4 million barrels per day (bpd) of refining capacity.
Shanghai index makes a run for the upper trendline.
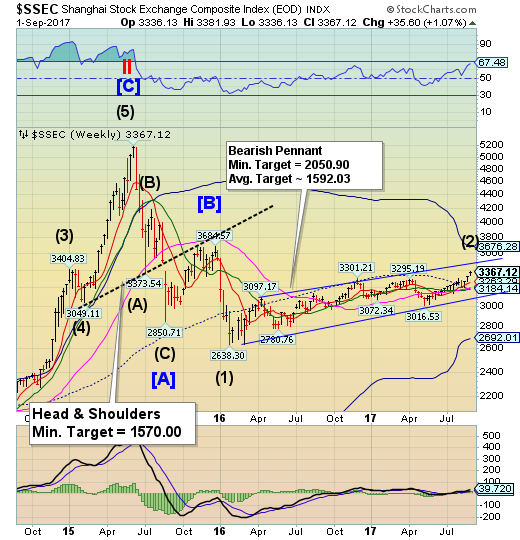
The Shanghai Index continues to gain altitude above mid-Cycle support at 3184.14 as it winds up its period of strength. A decline beneath Intermediate-term support at 3199.48 puts it on a sell signal. The Shanghai Index now.
China stocks edged up on Friday to cap their third week of gains, bolstered by robust corporate earnings and signs of accelerated reforms of state firms.
Investor confidence has also been buoyed by expectations that markets will remain bullish in the lead-up to a key Communist Party congress in mid-October, which could give more clues on the government’s policy priorities for the next five years.
State media said late on Thursday that China’s once-every-five years party congress will start on Oct. 18.
The Banking Index finds support at the Long-term.
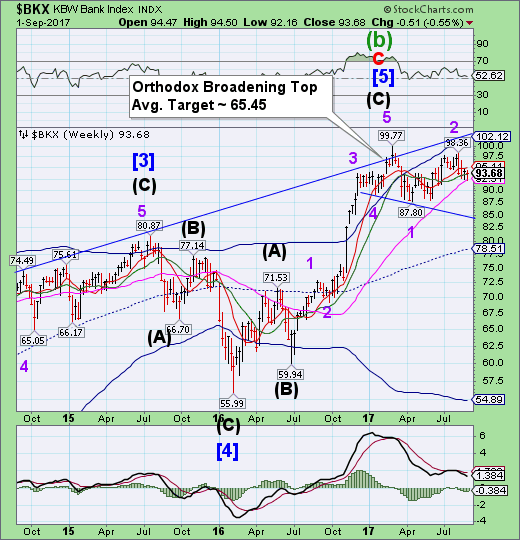
BKX continues to consolidate using Long-term support at 92.51 as its safety net. Further weakness may develop next week as BKX declines beneath its supportto find a new level. It remains on a confirmed sell signal.
The Federal Reserve on Friday finalized a new rule that should make it easier to wind down systematically important U.S. banks by creating a safe harbor for financial contracts after a firm defaults.
The decision, unanimously approved by Fed board members, forms part of global post-crisis efforts to end ‘too big to fail’ institutions that are so large and complex they could endanger the entire financial system if they fall into bankruptcy.
The rule requires global systematically important banks (GSIBs) to amend the language in common financial contracts so they cannot be immediately canceled if the firm enters bankruptcy.
(NYT) Central banks should be ready to inject cash into the financial markets to keep them stable after Britain leaves the European Union in 2019, a draft report from a bank industry lobby said.
The Association for Financial Markets in Europe (AFME), in a draft report seen by Reuters, said that regulators, central banks and national governments should continue to support financial market stability between Britain's departure from the EU and start of new trading terms.
The report said:
This may require particular attention during the uncertain period around Brexit, and in particular during the transition, and may involve more regular market communications and targeted support in case of market need, for example, access to liquidity schemes.
This and other steps would be needed to minimise disruption, it said.
It used to be that just the BOJ (via ETFs) and the largest Japanese pension fund, the GPIF (the largest in the world), had an implicit green light to allocate funds (in the case of the former, created out of thin air) to equities. That is no longer the case: according to Bloomberg, Japan's second largest commercial bank, Japan Post Bank Co., has decided to follow in the footsteps of its giant peers, and plans to "plow" an 100 billion yen ($904 million) directly buying stocks "when it finds the right opportunities."
Unable to generate required returns through conventional means such as lending, Japan's second-largest bank by deposits, which currently invests in equities only through passive investments in funds, plans on becoming a giant prop-trading hedge fund and aims to boost active stock holdings to several hundred billion yen in the next five to 10 years, said Katsunori Sago, executive vice president at the Tokyo-based company.
