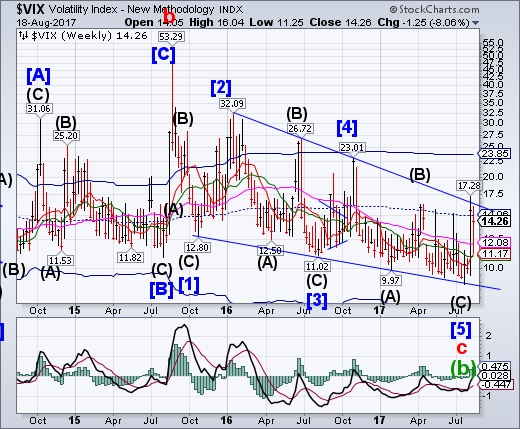
VIX had an inside week, trading between the Ending Diagonal trendline and Intermediate-term support at 10.93. It remains on a weekly buy signal. The next move may be to rise above the Ending Diagonal pattern, which usually results in a complete retracement of that formation.
The CBOE Volatility Index (VIX) surged more than 30% on Thursday, as U.S. stocks suffered their worst day in three months. Just a week prior, the VIX, or the stock market's "fear gauge," skyrocketed more than 40% in one day. According to data from Schaeffer's Senior Quantitative Analyst Rocky White, it's only the third time ever the VIX has experienced two single-session jumps of 30% or more in one week.
SPX closes beneath Intermediate-term support.
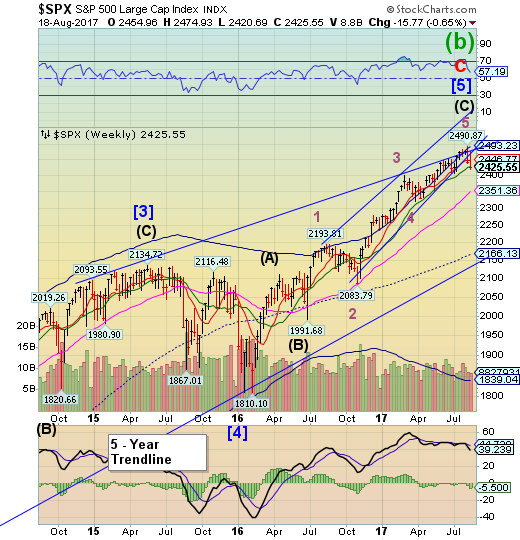
SPX declined beneath its Intermediate-term support at 2430.03, leaving a confirmed sell signal in place. The next potential target may be Long-term support at 2351.36.A meltdown in the Risk Parity Models may bring the SPX considerably lower.
The Trump-fed rally in stocks, lately showing signs of faltering as the long Wall Street summer nears its end, faces a key test in the weeks ahead with the approach of a historically unkind season for equities and a clutch of issues, such as raising the debt ceiling, awaiting the return of lawmakers to Washington.
With September, typically the worst month in the year for stocks, on the doorstep, investors are likely to be nervous that cracks seen in the more than-eight year bull run in equities will turn into a steeper selloff.
"September is historically one of the most volatile months of the year," said Michael Purves, chief global strategist at Weeden & Co in New York. "Why do you want to chase the S&P right now if there's a good shot that September can be an ugly, volatile month."
NDX closes beneath weekly Cycle Top support.
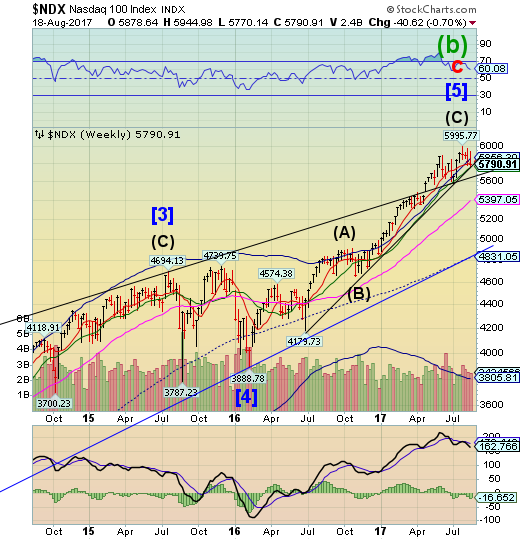
NDX declined beneath its Cycle Top at 5856.30 but closed above Intermediate-term support at 5762.10.A further decline beneath Intermediate-term support and its Brexit trendline at 5750.00 may produce a sell signal.
On an equal-weight basis, the Nasdaq 100 just dropped to a relative all-time low.
There are countless ways to measure the level of participation in a stock market rally. By “participation”, we are referring to the number of stocks that are taking part in the rally. One way is to look at the market’s “internals”, e.g., advances vs. declines, new highs vs. new lows, etc. As an indication of good quality participation, we like to see a high number of each of the former vs. each of the latter. When that is not occurring, even as the indices hold up well, we say that the rally is “thinning”, or seeing a decreasing level of participation. We’ve published multiple examples of this internal weakness in recent weeks.
High Yield Bond Index declines toward Short-term support.
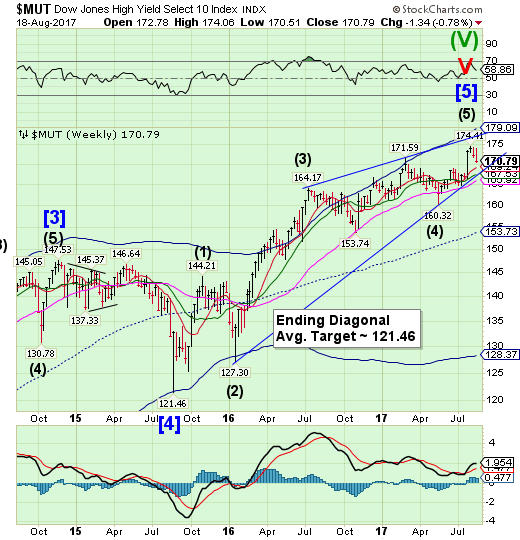
The High Yield Bond Index declined toward weekly Short-term support aftera probable reversal last week. A sell signal may be generated should MUT fall beneath Intermediate-term support and its Ending diagonal trendline at 167.53.
Tesla (NASDAQ:TSLA)'s (NASDAQ:TSLA) recent $1.8 billion high yield bond issuance has received much attention, given the popularity of the stock, the cars, its founder, Elon Musk, and its $60 billion market capitalization. The issue carries a 5.3% coupon, matures on August 15, 2025, and is callable beginning on August 15, 2020, at 103.975, as was sold at par. There has been much written about this bond issuance, including assertions that the deal somehow signals a "top" for the high yield bond market.
For instance, this CNBC.com article quotes an analyst who states that the bond issuance "speaks to the sheer insanity found in the high-yield market to have a deal like this upsized with terms so unappealing to investors." This Bloomberg article states that the bond issuance "represents the latest sign of froth in the high yield market, where investors have been turning a blind eye to bond-market basics in search of yield."
USB launches from Intermediate-term support.
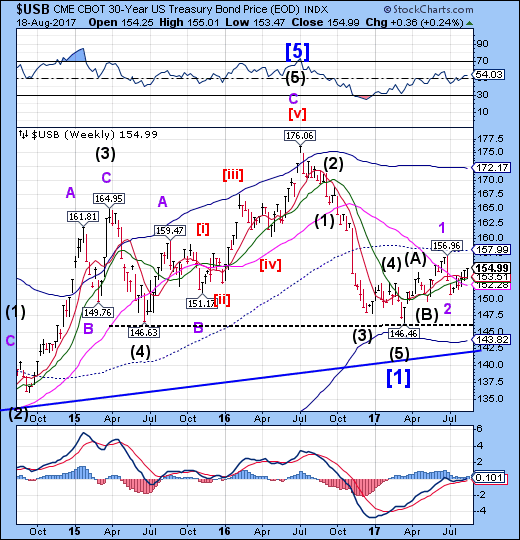
The Long Bond probed higher after testingIntermediate-term support at 153.41. Treasuries have begun their period of strength.The rally has quite a distance to go, since it may complete the right shoulder of a potential Head & Shoulders formation near 165.00 before a major reversal takes place.
As we pointed out earlier, the chances of government agreeing any kind of debt ceiling deal (and avoiding a government shutdown) is dropping fast as USA default risk spikes and the Treasury Bill curve inverts. Goldman Sachs (NYSE:GS) is now concerned also.
Uncertainty in The White House is starting to make investors realize the chance of successfully navigating the debt ceiling crisis without a government shutdown are dwindling.
Low approval ratings raise legislative risks. In the near term, we believe there is a 50% chance of a brief government shutdown, as the president seeks to solidify support among his base by embracing more controversial positions, despite needing Democratic support to pass spending legislation.
The euro has an inside weekabove Cycle Top support.
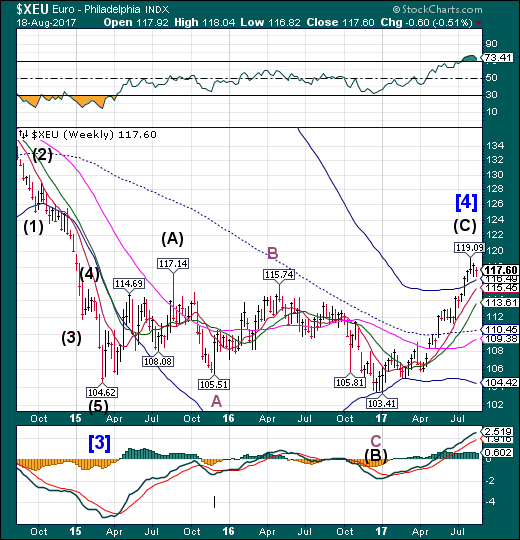
The euro had an indecisive inside week above weekly Cycle Top support at 116.49. The Cycles Model calls for a probable significant low next week. A decline beneath the Cycle Top may be a sell signal. Traders are looking for a higher euro, but it may have reached its technical limit.
(IrishTimes) The euro could soon be the strongest major currency on the planet. Morgan Stanley (NYSE:MS) is predicting a stronger euro and a weakening pound, the trend that has dominated currency markets in 2017, will combine to make the single currency more valuable than sterling for the first time.
In a recent note, the bank’s analysts forecast the euro would trade at £1.02 by the end of the first quarter for 2018. Right now, it’s hovering around £0.91. This rate is close to the level brought about by the “flash crash” incident of last October which, at the time, sent shockwaves through currency markets. Now it’s becoming normalised, as we head even deeper into sterling’s Brexit-related malaise.
Euro Stoxx breakdown delayed.
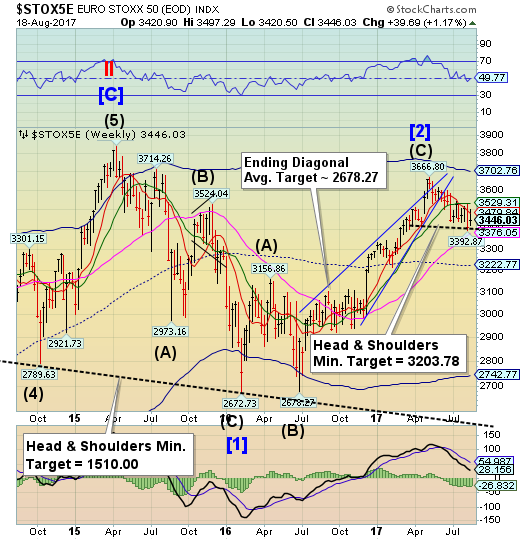
The Euro Stoxx 50 Index rallied back above its Head & Shoulders neckline to challenge weekly Short-term resistance at 3479.04. This has caused an adjustment to that formation, which remains valid. The implication is that the right shoulder may have just been completed as we await a breakdown beneath the adjusted neckline.
(The Guardian) Stock markets in Europe have fallen after the Barcelona attack, with shares in airline, hotel and travel companies among the hardest hit.
IAG (LON:ICAG), the parent company of British Airways and the Spanish carrier Iberia, fell 2% on Friday. Ryanair and easyJet (LON:EZJ) posted more modest losses, while Air France-KLM ended the day 1.6% down. InterContinental Hotels Group lost 1.6%, and more broadly, the European travel and leisure index fell 1.5%.
Neil Wilson, analyst at the stock market betting firm ETX Capital, said: “As we’ve seen over the last couple of years in Europe, these kinds of atrocities affect tourism and will hit airline earnings.”
The yen consolidates its gains.
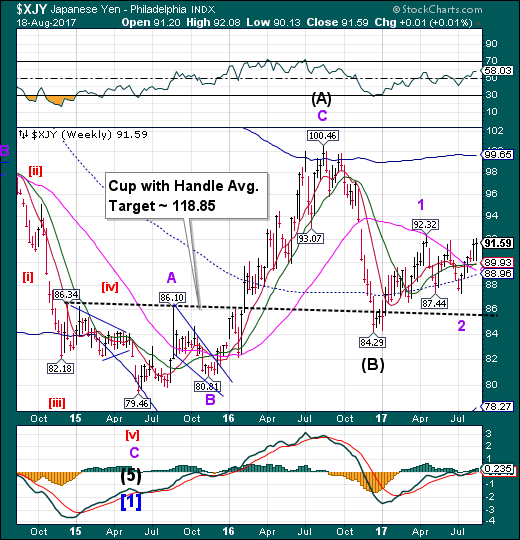
The yen retested last week’s low before resuming its rally. Speculators now recognize the yen as a safe haven despite Japan’s close proximity to North Korea. The yen is on a full-blown buy signal.
(Hindu Business Line) The yen was the major mover among the G10 group of developed world currencies on Friday, gaining another half per cent against the dollar as nerves over stock market valuations and the future of an 8-year global rally seeped into other assets.
The euro had recovered all of the ground it lost after European Central Bank policymakers warned of an overshoot in the currency in the minutes on Thursday from last month's policy meeting, trading 0.2 percent higher at $1.1748.
Concerns over President Donald Trump's ability to push through the pro-growth measures financial investors had expected at the start of this year were at the heart of a second daily 1 per cent loss for Wall Street on Thursday.
Nikkei continues its decline.
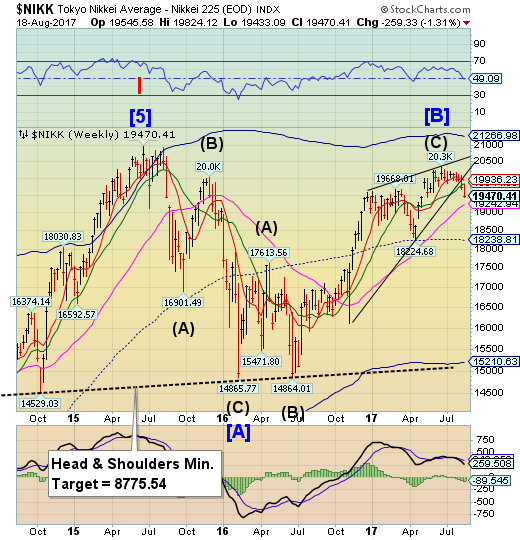
The Nikkei continued its decline, strengthening its sell signal as it broke beneath its May 18 low. A breakdown beneath the Ending diagonal suggests a complete retracement of the rally. From a Cyclical point of view, this action suggests a decline to the weekly Cycle bottom at 15210.63.
(Nikkei Asian Review) The Nikkei Stock Average index fell for the third straight day Friday to end the week at its lowest level since May 2, with growing concern over geopolitical risks and the yen's rise against the U.S. dollar stoking bearishness.
The Japanese stock benchmark lost 232.22 points, or 1.18%, to close at 19,470.41 in what was the fourth-steepest daily drop so far this year.
Geopolitical risks were high on investors' minds as they wrapped up the working week. The terrorist attack in Barcelona on Thursday added to concerns already heightened by the persisting tensions between the U.S. and North Korea.
US dollar Cyclical strength wears thin.
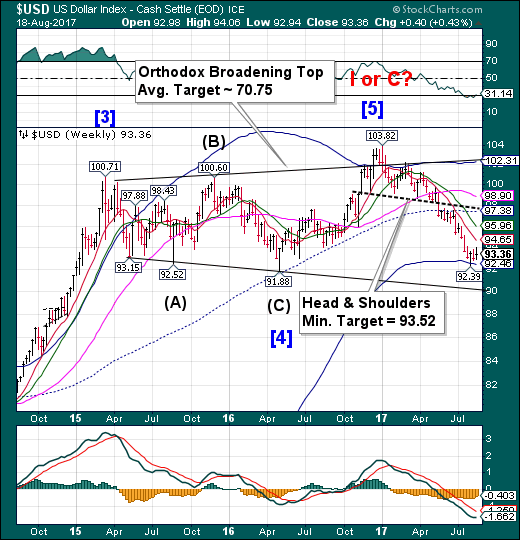
USD strength may have run its course this week as it retreats back toward its Cycle Bottom support at 92.46.A break of the Cycle Bottom may send the USD to test its next (not visible) support near 88.00.
(Xinhua) The U.S. dollar fell against most major currencies on Friday amid rising political uncertainty in the White House.
Investors have been keeping a close eye on the news, which has weighed on the market in these two sessions.
Moreover, it was reported on Friday that Trump had also removed Steve Bannon from the post of White House chief strategist.
Gold delays its turn date to make a new high.
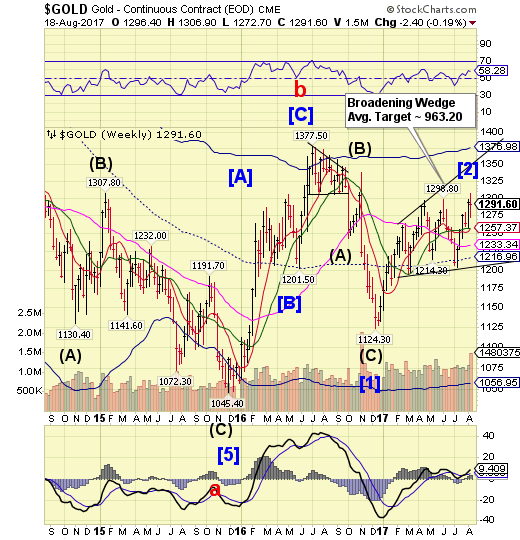
Gold appears to have delayed turn date, making a new high on Friday and annulling its Head & Shoulders formation. The spike high may be attributable to options expiration. But this action introduces an even stronger relative formation, the Broadening Wedge. The Cycles Model suggests a probable decline may be imminent. Gold may go into freefall at any time during this decline.
(Reuters) Gold jumped to its highestin more than nine months on Friday as the dollar retreated onpolitical uncertainty in the United States and a suspectedIslamist attack in Spain boosted bullion's safe-haven appeal.
Spot gold touched its highest since Nov. 9 at$1,300.80 per ounce, and by 1333 GMT was trading up 0.8 percentat $1,298.51.
"There is clearly more for financial markets to be concernedabout," Danske Bank analyst Jens Pedersen said, referring to U.S. political uncertainty and the attack in Spain. "That hasled to a risk-off environment, and that's supportive for gold."
Crude pulls back to Intermediate-term support.
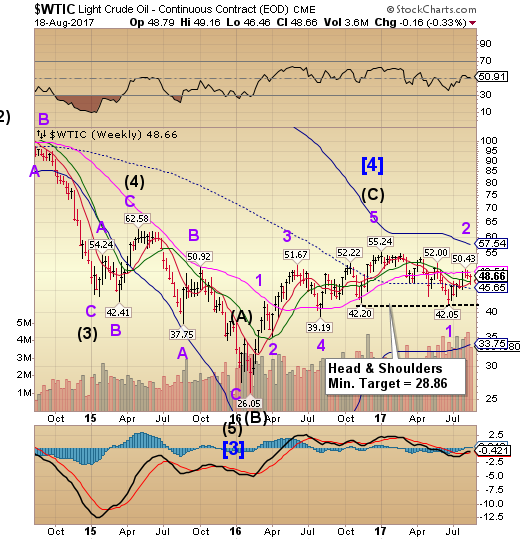
Crude declined to challenge Intermediate-term support at 47.33. On Friday it spiked toward its Long-term resistance at 49.51. The Cycles Model suggests a probable spike above that resistance before a likely tumble until the end of the month. A decline beneath mid-Cycle support at 46.65 reinforces the sell signal.
(Oil Price) The number of active oil and gas rigs in the United States fell this week by 3 rigs as drillers in the United States proceed more cautiously as oil prices fail to sustain any significant increase. Combined, the total oil and gas rig count in the US now stands at 946 rigs, up 455 rigs from the year prior, with oil rigs in the United States decreasing by 5 and gas rigs increasing by 1.
Oil rigs in the United States now number 763—357 rigs above this time last year.
Canada lost 6 oil rigs this week, with the number of gas rigs holding steady—for a total of 214 oil and gas rigs—93 above the year ago levels.
Shanghai Index climbs above mid-Cycle support.
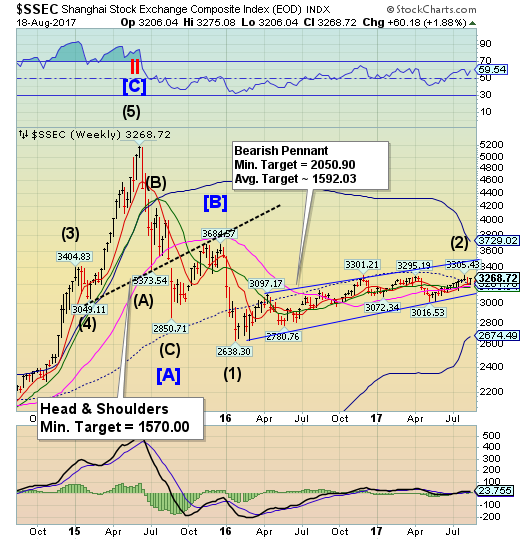
The Shanghai Index climbed above mid-Cycle support at 3201.76. A decline beneath Intermediate-term support at 3173.54 puts it on a sell signal. The Shanghai Index now enters the negative season through October. The ability to stay above supports will determine its outcome.
(ZeroHedge) The first time we laid out the dire calculations about what is perhaps the biggest mystery inside China's financial system, namely the total amount of its non-performing loans, by former Fitch analyst Charlene Chu we called it a "neutron bomb" scenario, because unlike virtually every other rosy forecast the most dire of which topped out at around 8%, Chu argued that the amount of bad debt in China was no less than a whopping 21% of total loans.
Corporate investigator Violet Ho never put a lot of faith in the bad loan numbers reported by China’s banks: crisscrossing provinces from Shandong to Xinjiang, she’s seen too much - from the shell game of moving assets between affiliated companies to disguise the true state of their finances to cover-ups by bankers loath to admit that loans they made won’t be recovered. The amount of bad debt piling up in China is at the center of a debate about whether the country will continue as a locomotive of global growth or sink into decades of stagnation like Japan after its credit bubble burst. Bank of China Ltd. reported on Thursday its biggest quarterly bad-loan provisions since going public in 2006.
The Banking Index makes new lows.
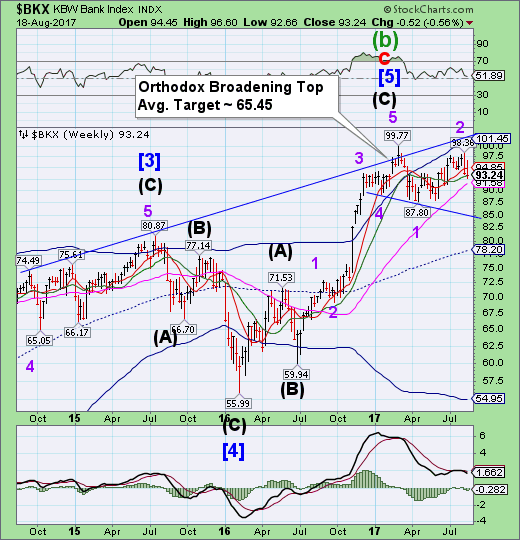
BKX made a brief bounce that failed on Thursday, as it closed beneath its Intermediate-term support at 93.40. This action may confirm a sell signal in BKX. Follow through on that signal may result in BKX challenging its mid-Cycle support at 78.20.
(Washington Examiner) Elbridge Gerry was a colonial-era plutocrat who became a patriot, a signer of the Declaration of Independence and a champion of equal justice under the law. He initially refused to assent to the Constitution, although he attended the Convention, because it lacked a Bill of Rights.
One of his more famous sayings was that "a tribunal without juries would be a Star Chamber in civil cases" -- "Star Chamber" being a reference to the supervisory English court known best for protecting friends of the king and persecuting his enemies.
(DesMoinesRegister) Iowa's biggest public employee pension plan is among three plaintiffs suing some of the nation's largest investment banks, claiming the Wall Street giants have colluded to maintain exclusive control of the $1-trillion-plus stock loan market.
Together with the Orange County Employees Retirement System and the Sonoma County Employees Retirement Association, the Iowa Public Employees' Retirement System filed a federal class action suit Wednesday in the Southern District of New York.
Known as IPERS, the Iowa fund has more than 350,000 members, including state, city, county and school district employees, plus former Iowa public employees and retirees.
The lawsuit claims that six investment banks ― Bank of America (NYSE:BAC), Credit Suisse (SIX:CSGN), Goldman Sachs, JP Morgan, Morgan Stanley and UBS ― "took collective, illegal action to boycott, attack and acquire multiple entities who tried to increase competition and lower costs in the stock loan market."
(ZeroHedge) Is the ongoing Qatar blockade starting to seriously squeeze the finances of the tiny, but rich (or maybe not so rich any more) Gulf nation?
Overnight, Credit Suisse's largest shareholder, Qatar, announced it has lowered its direct shareholding in the largest Swiss bank to 4.94% through the nation's sovereign wealth fund - the Qatar Investment Authority - marking a rare sale of the Swiss bank’s stock. The QIA previously owned 5.01% in voting rights and is reporting a sale of shares for the first time since 2008. Qatar’s overall holding - including convertible bonds - declined to 15.91% from 17.98% after a rise in the number of outstanding Credit Suisse shares because of its capital increase.
