REVIEW
After three weeks of trending sideways last week was wild! The market started the week at SPX 2477. After a higher open on Monday the market rallied to all-time high on Tuesday at SPX 2491.
After that what appeared to a normal pullback turned into a profit taking selloff after the NK and US engaged in saber rattling. By Thursday the SPX had dropped 2% to 2438, bounced, and retested that low again on Friday. For the week the SPX/DOW lost 1.25%, and the NDX/NAZ lost 1.35%. Economic reports were light and mixed. On the downtick: consumer credit, the PPI, the Q3 GDP estimate and weekly jobless claims rose. On the uptick: wholesale inventories, the CPI and the budget deficit improved. Next week we have industrial production, retail sales, the NY/Philly FED and the FOMC minutes. Best to your week!
LONG TERM: uptrend
With the bull market already 18 months old, and the NK/US saber rattling intensifying this week, the market pulled back immediately after making all-time new highs. Since the potential for a black swan event exists, it behooves us to review the seven major indices (SPX/DOW/NAZ/NDX/TRAN/SOX/R2K) with a worse case scenario in mind. Therefore, we are putting aside expectations and just reviewing each of these indices wave patterns to see what they are displaying.
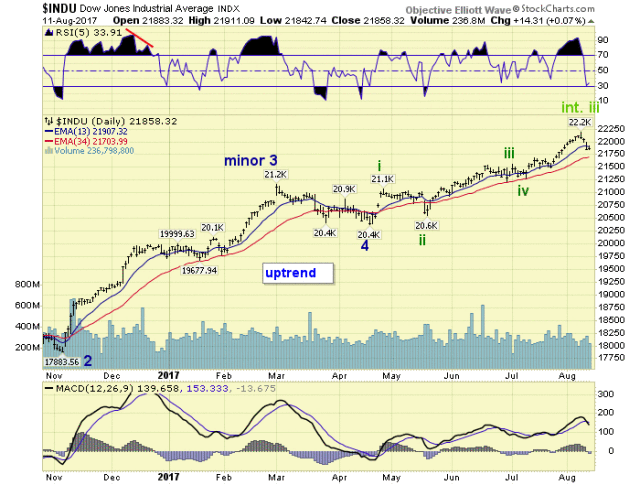
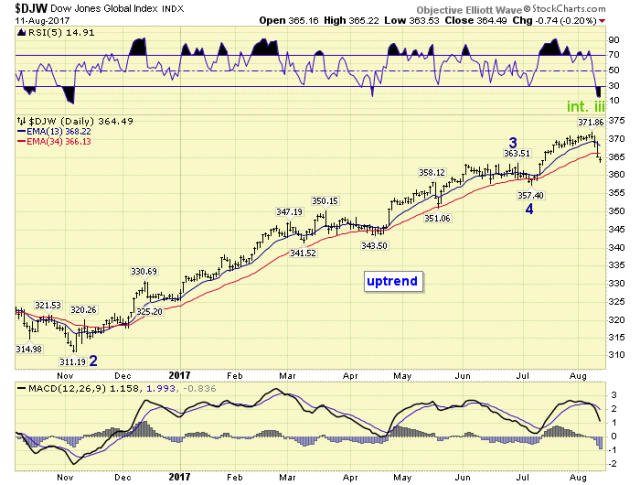
A worse case scenario for the DOW suggests the recent uptrend just completed Intermediate wave iii, and an Intermediate wave iv correction is underway. The wave structure from the early-2016 low does not suggest the bull market is over.
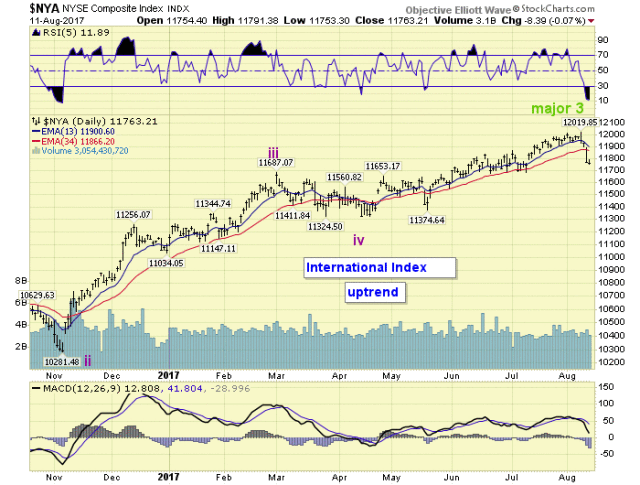
The NYSE has a similar pattern, albeit it is carrying the alternate Primary V scenario. Three Major waves up from the early-2016 low, with possibly a major wave 4 correction underway. No bull market top here either.
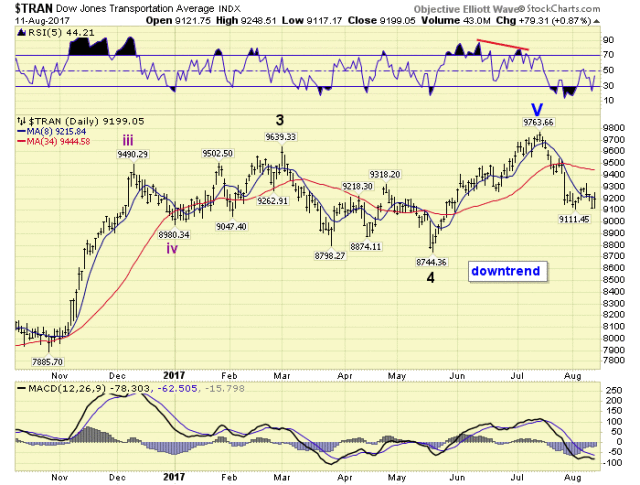
The Transports, however, do display five Major waves up from the early-2016 low. And the bull market here may have ended with the alternate Primary wave V count. Historically the Transports have topped together, with the other indices, or were a few months early. Despite the potential bearish count this supports the DOW/NYSE scenarios.
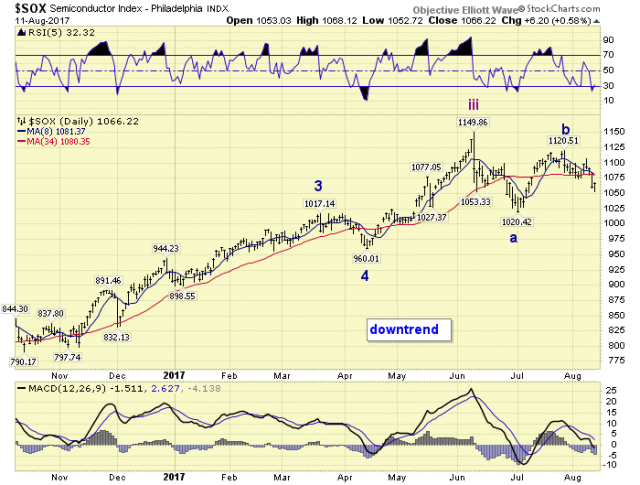
The Semiconductor SOX also displays three waves up from the early-2016 low. The recent uptrend failed to make new highs, so the SOX is probably doing an a-b-c Intermediate wave iv. Again, no signs of a bull market top in this index either.
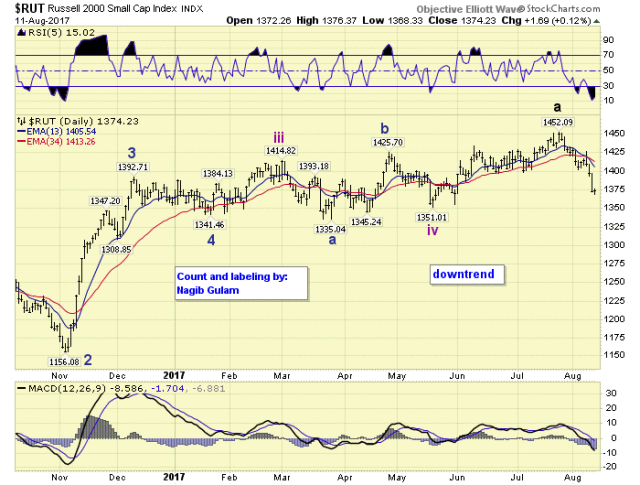
The Russell 2000 does look like it has done five waves up from the early-2016 low. We have labeled it a Major wave a, since the R2K has always moved in large a-b-c’s. Sometimes this index tops early like the TRAN.
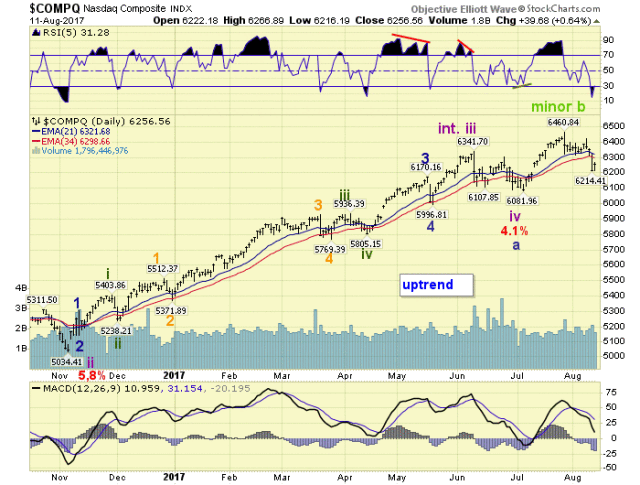
The SPX can be counted five waves up from early-2016 if you are will to accept a 2% correction as all of a key 4th wave, Intermediate iv. Since there have only been two other 2% corrections in the past 100 years, and neither was a significant wave, we have trouble with this potential count. The more likely scenario is that that little correction was Minor a of an ongoing Intermediate wave iv correction. This count would align the clearly bullish DOW/NYSE/SOX. An irregular Intermediate wave iv correction would also align the charts of the NDX/NAZ.
Plenty of worse case scenario counts to choose from. Some bullish, some bearish. Decide which ones you like and go with it. It’s your money.
MEDIUM TERM: uptrend
After a miniscule correction in April, the SPX aided by the DOW which did not correct, rallied to all-time highs just this week. The uptrend looked impulsive at times, but spent the past three weeks, of a 4+week uptrend, in a 1% range before the false breakout on Tuesday was sold. What the market managed to do in three weeks, a 1% range, was accomplished, in reverse, in three hours on Tuesday.
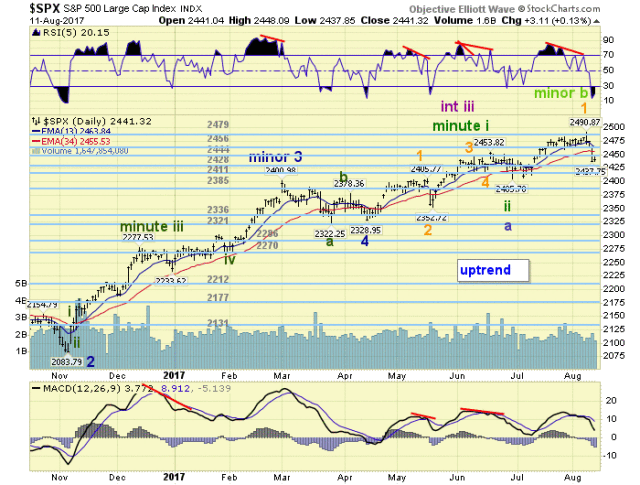
After the pump and dump activity on Tuesday, and reviewing all the other major indices, we decided to put the irregular Intermediate wave iv scenario back on the table. Clearing the OEW 2479 pivot was certainly no breakout. In case it was, we are maintaining the Micro 1-2 scenario too. The irregular iv count aligns with the SOX, the DOW/NYSE, and if you are so inclined even the DJ World index. Medium term support is at the 2428 and 2411 pivots, with resistance at the 2444 and 2456 pivots.
SHORT TERM
We continue to carry the Micro 1-2 scenario on the SPX charts, since it looks quite similar to the Micro 1-2 during the last uptrend. In fact, this Micro 2 is as oversold as the last one. This scenario cannot be ruled out until the SPX confirms a downtrend. It is still in a uptrend.
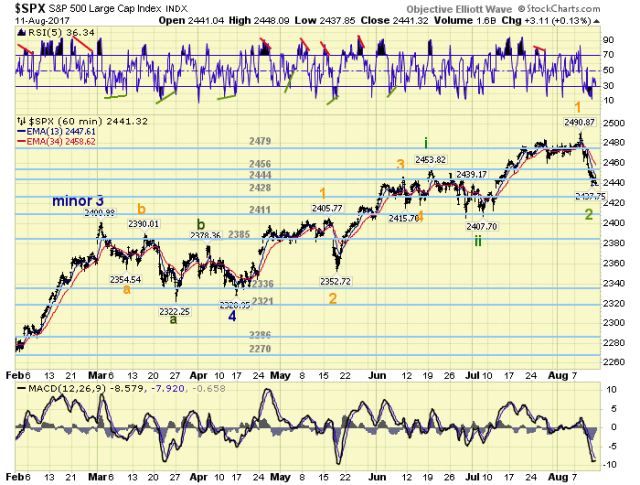
The decline from SPX 2491 so far is three waves: 2462-2474-2438. Where the first and second decline are nearly equal. Several hourly/daily indicators are oversold, and the market is due for at least a bounce, or to setup a positive hourly divergence. With several unknowns, including option expiration, in the coming week, the market could continue its volatility. Short term support is at the 2428 and 2411 pivots, with resistance at the 2444 and 2456 pivots. Short term momentum ended the week oversold.