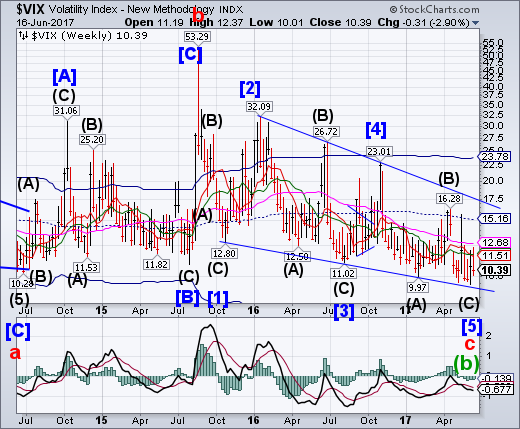
VIX challenged both Short-term and Intermediate-term resistance before closing beneath them. A rally above Long-term resistance at 12.68implies that VIX may challenge its Ending Diagonal at 17.50 in the next move.
Investors on Wall Street have proven to be ingenious in finding new vehicles and avenues to take risks in the quest of making a profit.
One glaring example is the VIX, the benchmark volatility index used as a measure of market risk, which was invented 24 years ago to signal possible market crashes in the making. But since then, the index has morphed into its own market, a "giant casino" that speculators use to seek big money, shorting the VIX on bets that it will go even lower, the Wall Street Journal reports. In addition, volatility-control investment funds valued at about $200 billion use the VIX as a signal to buy or sell stocks, pension funds are placing bets on its movement, and insurance companies are linking products to it, the Journal says.
SPX caught between support and resistance.
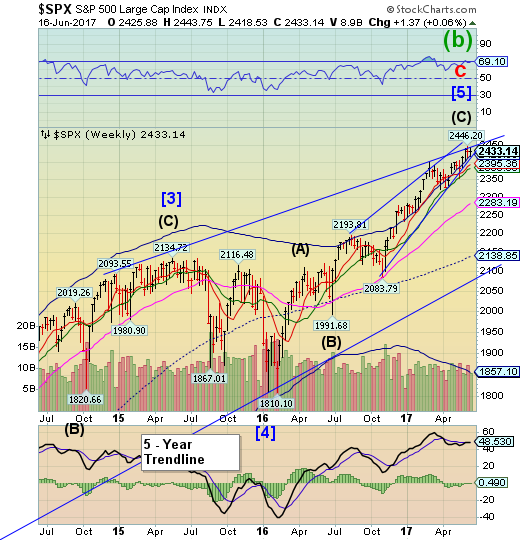
After last week’s key reversal SPX has been testing its Cycle Top Support at 2430.00 and its Diagonal trendline at 2445.00. This has left an inside week of consolidation and uncertainty among investors. This has been option expiration week, which is normally positive.
For confirmation that the market is now in its "blow off top" phase, contrary to claims that the market keeps "climbing a wall of worry" and that the "money on the sidelines" refuses to enter, look no further than the latest BofA "flow show" in which Michael Hartnett reports that capital markets just saw their biggest week of equity inflows since the US election ($24.6bn), another chunky inflow to bonds ($9.0bn), which combines to "the second largest week of inflows to Wall Street ever (largest was $35.5bn in Dec'2014)."
Unfortunately for active managers, the news was anything but good because for another week in a row, the big winner was ETFs with $26.3bn equity ETF inflow vs $1.7bn outflow from equity mutual funds, while fixed income saw 4.8bn bond ETF inflows vs $4.2bn into bond mutual funds; seven equity ETFs (SPY (NYSE:SPY), IVV, IWM, VO, VTI, XLF, VUG) & one bond ETF (EMB) had inflows >$1bn.
NDX has a second negative week.
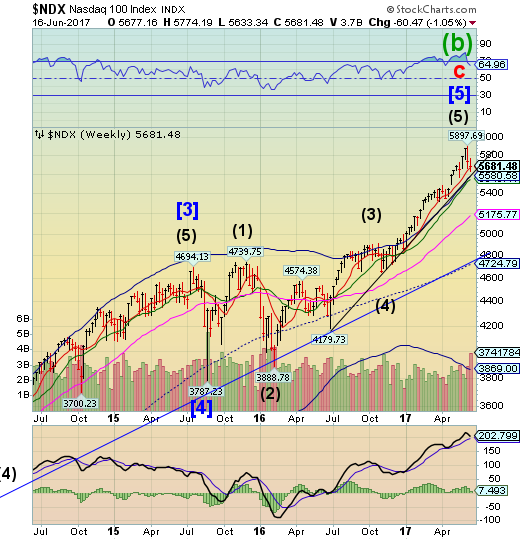
NDX tested its trendline near 5600.00 and bounced, closing at its weekly Short-term support.The next move to look for is a challenge of the trendline and supports beneath it. A decline beneath the Cycle Top support at 5580.58 may suggest a deeper correction is in order. Has the NASDAQ been defanged?
FANG Stocks just took out Friday/Monday's crash lows to the lowest since April 28th as NFLX leads the collapse.
The no-brainer is down 12% from its record highs last week, officially entering correction.
No! I am not talking about President Trump but rather the crash in both Technology stocks, and Oil prices, which are obstructing the continuation of the “bull market.”
As I discussed this past Tuesday, the mini “flash crash” in Technology certainly woke investors up:
While there is certainly damage being wrought in the Technology and Discretionary sectors, the rotation to Financials, Energy, Small and Mid-Capitalization areas are offsetting the correctionary process. As shown below, the markets remain confined to the bullish trend currently while the overbought condition is being reduced.
High Yield Bond Index rallies above Intermediate-term resistance.
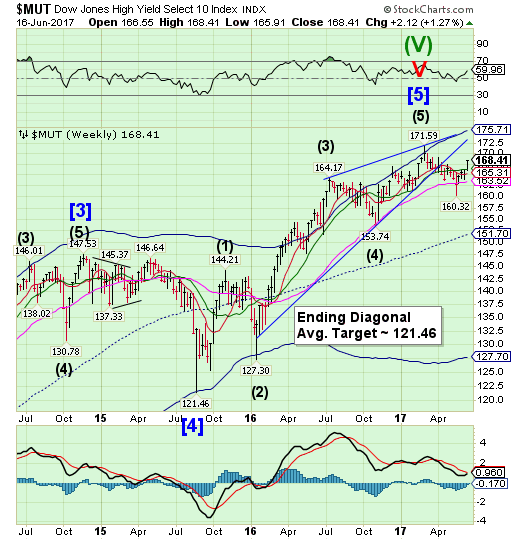
The High Yield Bond Index rallied above Intermediate-term resistance at 166.33. The sell signal has been nullified, but it won’t take much to reclaim it. The Cycles Model suggestsweakness may resume next week.
For investors seeking momentum, iShares iBoxx $ High Yield Corporate Bond ETF HYG is probably on radar now. The fund just hit a 52-week high and is up about 8.1% from its 52-week low price of $82.01/share.
But are more gains in store for this ETF? Let's take a quick look at the fund and the near-term outlook on it to get a better idea on where it might be headed:
USB breaks out
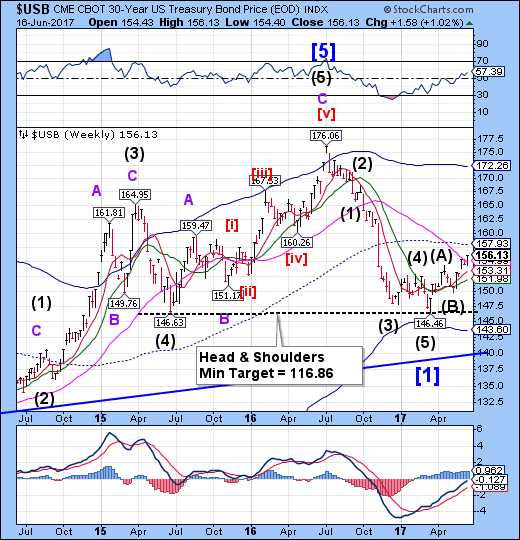
The Long Bond broke out above Long-term resistance at 154.99, signaling more strength ahead. This week’s modest weakness may have been all it took to revive the uptrend.
It is not only Equity volatility being crushed these days.
Treasury Volatility too reached all-time lows area this week, dipping below 4.
In the last 5 years, whenever Treasury Volatility closed below rock-bottom 4 level, large movements in term rates followed swiftly (by approx 100bps each time – see Chart), quickly pushing volatility back up again in the process.
The euro begins its breakdown.
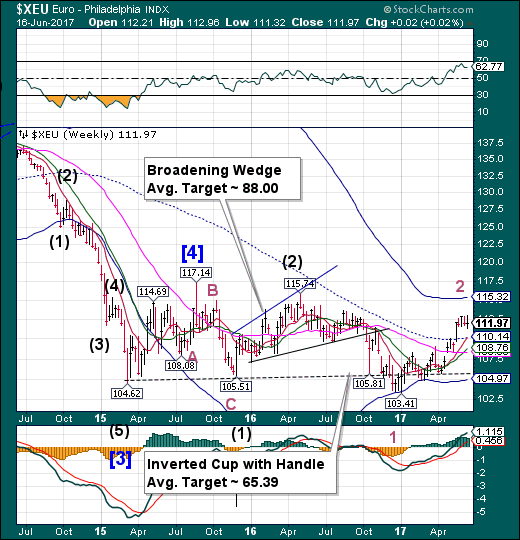
The euro made a new high on Wednesday and reversed, making a daily Key Reversal, but not weekly. The reversal from the high may be unusually strong and fast, since it must make a Master Cycle low in the next week.
The common currency hit a two-week low on Thursday morning of $1.11555, down half of percent on the day, despite moving higher earlier in the week.
Thursday's drop was caused by a more hawkish tone by the U.S. Federal Reserve than what markets were expecting.
John Hardy, Head of forex strategy at Saxo Bank, told CNBC via email:
The euro got a bit overextended on the recent run higher as it ran out of new good news to take it higher and the European Central Bank did its utmost to dampen expectations for the beginning of any asset purchase taper.
Euro Stoxx breaks the trendline.
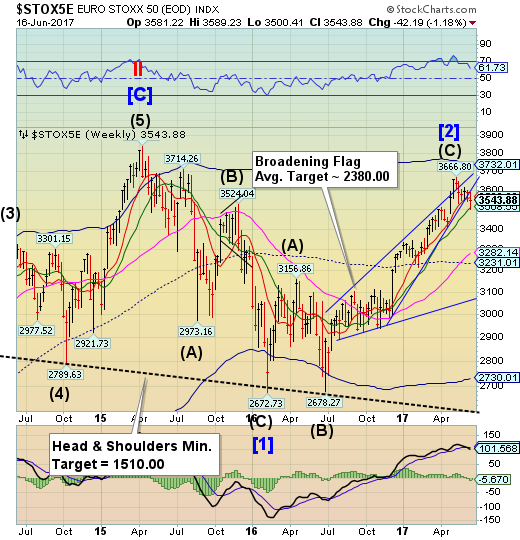
The Euro Stoxx 50 Index broke through the Ending Diagonal trendline andbounced off intermediate-term support at 3508.55, closing above it. The next week may be rugged for the Euro Stoxx bulls as it may have an entire week of weakness in its Cycle pattern.
Markets in Europe closed higher on Friday as investors digested news of more money for Greece and focused on wider political events and data releases.
The pan-European Stoxx 600 ended Friday 0.66 percent higher, with the majority of sectors in positive territory. All major bourses were little changed for the week however as a sell off in tech stocks continued to weigh.
Wall Street, however, remained in the red as a miss on U.S. housing data did little to buoy major indices, which have been weighed down by slumping tech stocks for the majority of the week.
The yen challenges Long-term resistance again.
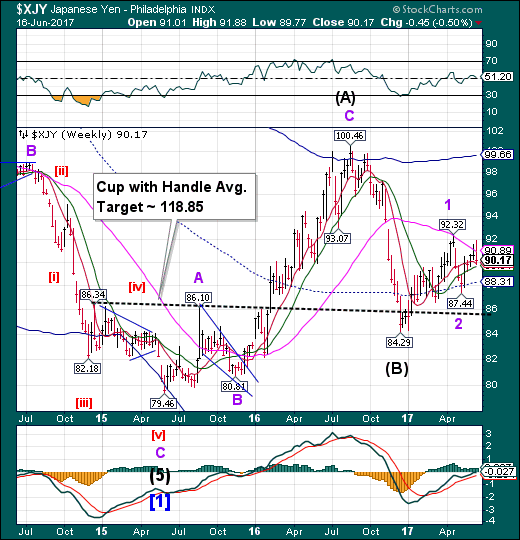
The yen challenged Long-term resistance at 90.89, closing above Intermediate-term support at 89.61. This week’s pullback does not appear to be a significant one. It is probable that the rally may resume for another week. A breakout above Long-term resistance may alter the pace of the rally.
The dour U.S. data boosted the yen, which had slid to a two-week low versus the dollar.
Axel Merk, president and portfolio manager at Merk Hard Currency Fund in Palo Alto, California, said:
The move in the yen very much coincided with a strengthening of bonds in the U.S., which also coincided with a selling off in (U.S.) equity markets ... My guess would be that the risk-off environment prevailed.
Earlier, the yen had weakened after Bank of Japan Governor Haruhiko Kuroda said there was "some distance" to achieving the BoJ's inflation target of 2 percent, and it was "inappropriate" to say how the Bank would exit its massive stimulus program as domestic inflation has remained sluggish.
The Nikkei closes lower for the week.
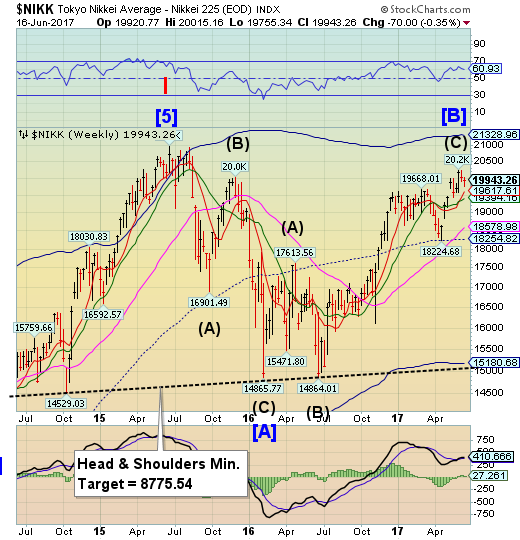
The Nikkei bounced on Friday but closed the week at a loss. The Cycles Model suggests a probable continuation of the decline. A sell signal may be generated beneath 20000 with confirmation of the correction beneath Short—term support at 19617.61. The decline may not be long, but threatens to be deep.
Japan's Nikkei share average rebounded on Friday morning, rising for the first time in the week as the dollar bounced against the yen after solid U.S. data, while financial stocks attracted strong gains.
Trading in Takata Corp stock was suspended by the Tokyo Stock Exchange, after media reported that the company is preparing to file for bankruptcy as early as next week as the safety equipment manufacturer attempts to manage the world's largest safety recall. Takata is working toward a deal for financial backing from U.S. auto-parts maker Key Safety Systems Inc.
- U.S. dollar is probing new lows
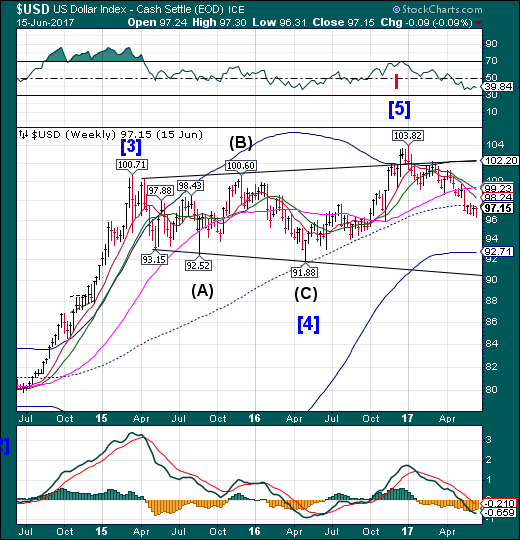
USD appears to be probing new lows while unable to gain any traction above mid-cycle resistance at 97.46 for the past month. The Cycles Model suggests a possible 5-week decline in USD.
Speculators slashed net long positions on the U.S. dollar in the latest week to their lowest level since last August, according to calculations by Reuters and Commodity Futures Trading Commission data released on Friday.
The value of the dollar's net long position slid to $6.48 billion in the week ended June 13, from $8.0 billion the previous week.
Up until the Federal Reserve's interest rate hike on Wednesday, the dollar had been on a declining trend this year amid a spate of soft data such as U.S. inflation and non-farm payrolls.
Gold slips under Short-term support.
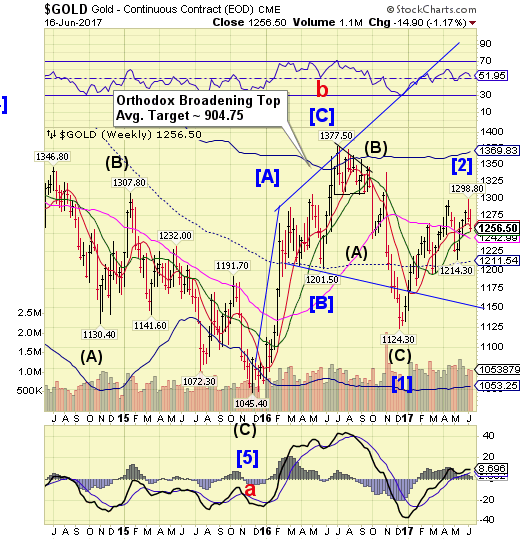
Gold declined beneath Short-term support at 1260.20, earning a sell signal. A further decline beneath Intermediate-term support at 1253.16 confirms that signal. The Cycles Model suggests a significant low may occur in the next week.
Gold could continue to suffer in the short term as Federal Reserve monetary-policy tightening weighs on the market, according to analysts.
Traders are closing the book on what has been a volatile week with prices ending near a three-week low at key. August Comex gold futures are ending its second week of negative losses, last trading at $1,256.10 an ounce, down more than 1% from the previous Friday.
The silver market is also seeing a second consecutive weekly close with prices ending the week back below the key level of 17 an ounce. July Comex silver futures last traded at $16.45 an ounce, down more than 3% from last week.
Crude tests the Head & Shoulders neckline.
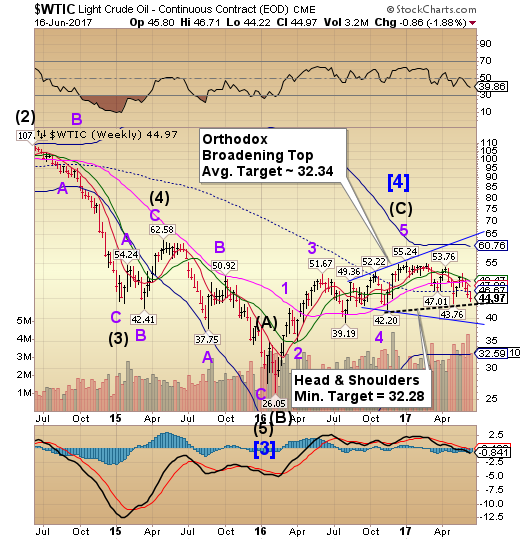
Crude declined to the Head & Shoulders neckline at 44.00 this week and may be ready to follow through in the next week.There are now three formations indicating the probable target for the coming decline this Summer.
The return of oil and gas initial public offerings was nice while it lasted.
Energy companies aiming to go public are staying on the sidelines as crude prices struggle to keep above $50 a barrel, analysts and investment professionals say. The price weakness has halted a recovery in stock debuts in the energy sector, which typically accounts for one-tenth of the overall IPO market.
- West Texas Intermediate crude futures slipped to a fresh a seven-month closing low below $45 a barrel on Thursday after plunging nearly 4 percent in the prior session.
Shanghai Index has an inside week.
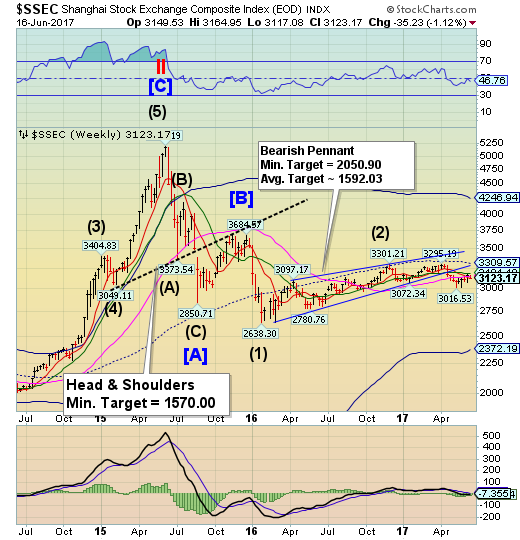
The Shanghai Index had a boring trading week as its price barely wriggled between Short-term support at 3122.46 and Intermediate-term resistance at 3181.10. However, the Shanghai Index is due for a fall next week. Attempts to limit the decline may have succeeded so far, but may have reached their limit.
The surge in Hong Kong housing costs has lifted home prices well beyond the bounds of affordability for most local families and young professionals, leading to long lines at housing sales that were sometimes oversubscribed by as much as 15x. But while home prices have risen for every type of home, Bloomberg notes that the intensifying demand for micro-apartments - some of which are as small as 128 square feet (about the size of a garden shed) - has caused prices for this segment of the housing market to climb more quickly than normal-sized homes. Why? Because they’re practically all Chinese buyers can afford.
Nicole Wong, regional head of property research at CLSA Ltd. in Hong Kong, said:
The pool of buyers for small flats is getting bigger and bigger because people have to downgrade their expectations of the size of flats they can live in.
The KBW Bank completes its correction.
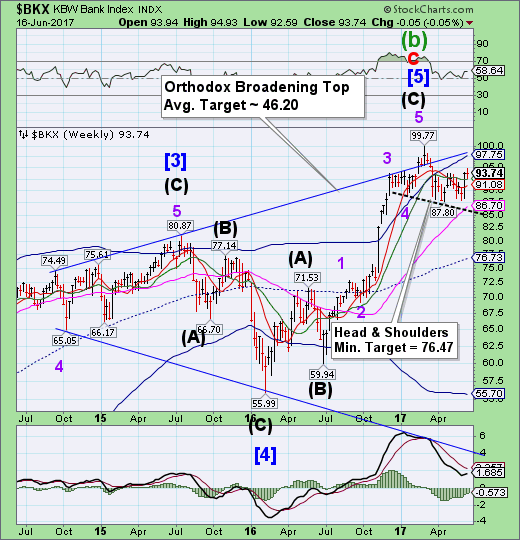
BKX rallied slightly higher on Tuesday, but ended the week unchanged. The sell signal has been temporarily neutralized as BKX rose above its Intermediate-term support at 92.36. The expected weakness may have been delayed due to options expiration, but an important low is now overdue this week.
For 66 years the Glass-Steagall act reduced the risks in the banking system. Eight years after the act was repealed, the banking system blew up threatening the international economy. US taxpayers were forced to come up with $750 billion dollars, a sum much larger than the Pentagon’s budget, in order to bail out the banks. This huge sum was insufficient to do the job. The Federal Reserve had to step in and expand its balance sheet by $4 trillion in order to protect the solvency of banks declared “too big to fail.”
The enormous increase in the supply of dollars known as Quantitative Easing inflated financial asset prices instead of the consumer price index. This rise in bond and stock prices is a major cause of the worsening income and wealth distribution in the United States. The economic polarization has undercut the image and reality of the US as a land of opportunity and has introduced political and economic instability into the life of the country.
What I’m about to tell you isn’t some wild conspiracy. Or fake news.
It’s raw fact, based on publicly available data from the US Federal Reserve.
This data shows a very simple but concerning trend: banks in the United States are becoming less safe. Again.
And they’re doing it on purpose. Again.
Few people ever give much thought to the safety and security of their bank.
After all, banks go out of their way to instill an overwhelming sense of confidence that they’re rock solid.
Confirming earlier concerns over performance, Citigroup (NYSE:C) CFO John Gerspach warned investors at a Morgan Stanley (NYSE:MS) Conference this morning that Citi's second quarter trading revenues would be down 12-13%.
Of course, none of that has anything to do with the stock price's performance.
