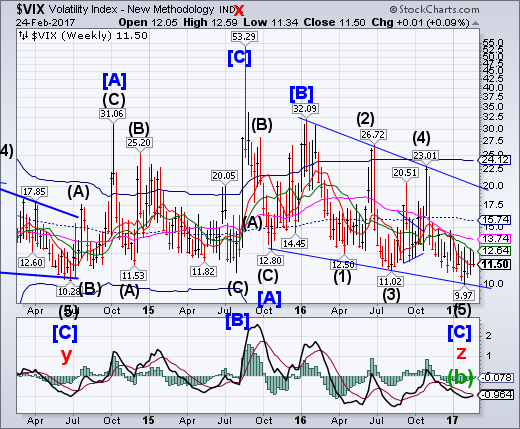
VIX tested weekly intermediate-term resistance at 12.64 a second time before closing at weekly short-term support at 11.50. An aggressive buy signal may be forthcoming should the VIX rally above its intermediate-term resistance. The breakout above long-term resistance at 13.74 implies higher targets to come.
(ZeroHedge) How much longer can this hope-filled balloon be held under water?
'Exceptional Stability'
As Bloomberg notes, swings in U.S. stocks have become unusually narrow as a rally, driven by Donald Trump’s election as president, has persisted. The S&P 500 Index’s volatility over 65 trading days, or about three months, ended last week at the lowest since November 1995. The 65-day time frame was cited in a report Tuesday by David Rosenberg, chief economist and strategist at Gluskin Sheff & Associates Inc.
SPX “throws over” the Broadening Top, week 3.
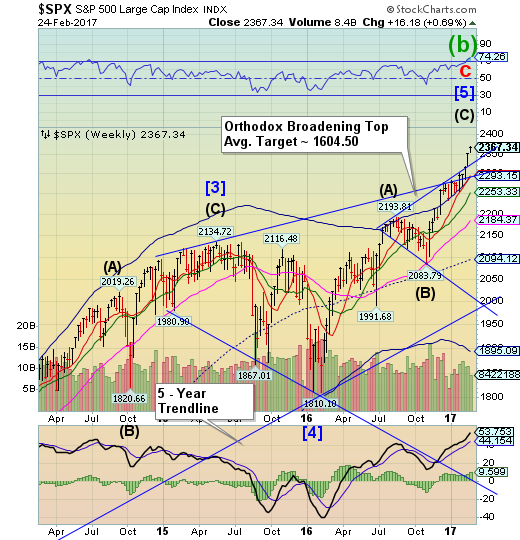
SPX continued its throw over above the upper trendline of its orthodox broadening top, making a new high. A reversal of a throw-over may be a strong indication of a change in trend. A decline beneath the cycle top support and short-term support, both near 2293.15, gives the SPX a sell signal. A break of those supports may send the SPX to its cycle bottom at 1895.09, or possibly lower.
(Bloomberg) It isn’t over till it’s over. Especially on Friday.
For the second time in two weeks, a final-hour ramp in the S&P 500 turned the index green for bulls, with the benchmark equity gauge jumping 6 points in a little over 30 minutes to close with a 0.1 percent advance and help preserve a fifth straight weekly gain. A similar spike salvaged gains seven days earlier.
Andrew Brenner, head of international fixed income for National Alliance Capital Markets, wrote in a note to clients:
The machines kicked in and brought all the averages positive at the close. We think markets move big time next week off the Trump speech Tuesday.
The NDX nearing Wave Completion.
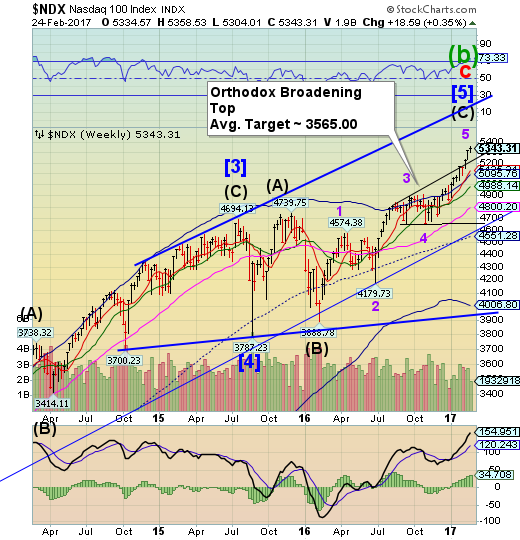
NDX stalled on Wednesday in its extended throw-over above the upper trendline of its orthodox broadening top. Wave 5 is slightly longer than the length of Wave 1, achieving Wave equality at 5333.19 and probable completion. A breakdown beneath the upper trendline of the Broadening Top at 5250.00 may imply a sell signal.
(Tumblr) The Nasdaq 100 has never had a run of strong closes like it is currently demonstrating.
If it seems like the stock market has had a good run of it lately, you’re not imagining things. Stocks across the market cap spectrum have been on a remarkable run of both up days as well as new highs. Furthermore, if it seems like the market has been closing firmly on a consistent basis, you are not mistaken. In fact, in some respects, the recent run of strong closes is unprecedented.
High yield bond index challenges its cycle top resistance.
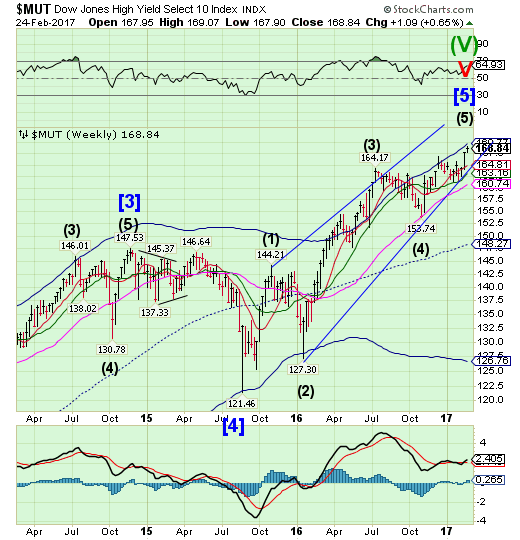
The high yield bond index is now challenging its cycle top resistance at 169.77. A break beneath the diagonal trendline and intermediate-term support at 163.16 implies a complete retracement of the rally may occur, once the rally is over.
(SeekingAlpha) Corporate bond ETFs create what I like to call "phantom liquidity." What you see (or what you think you see) is not in fact what you get. This problem is especially acute in high yield ETFs like the iShares iBoxx $ High Yield Corporate Bond (NYSE:HYG) and the SPDR Barclays (LON:BARC) High Yield Bond (NYSE:JNK).
In the post-crisis regulatory environment, dealers aren't willing to serve as middlemen, the cost of balance sheet is simply too high. What that means, in the simplest possible terms, is that in a pinch, no one is going to be willing to catch a falling knife or, in market parlance, "inventory" these bonds.
USB rises above Intermediate-term resistance.
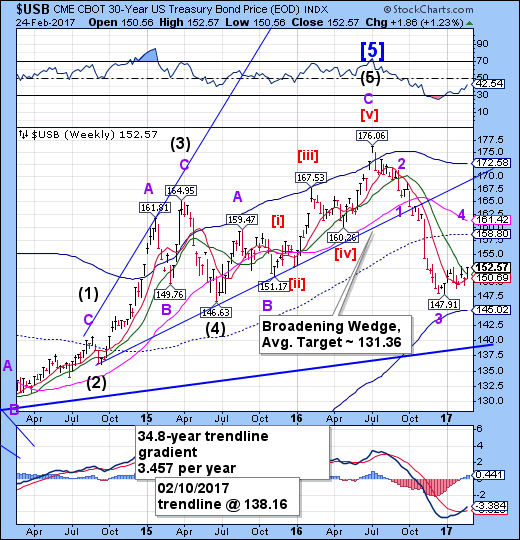
The Long Bond rose above Intermediate-term resistance at 151.42, giving it a buy signal. The cycles model now suggests that a period of strength may develop through mid-March. The mid-cycle resistance at 158.80 still appears to be the target.
(CNBC) The Treasury is studying the possibility of issuing 50- and 100-year bonds, taking advantage of current low interest rates and potentially turning the 30-year long bond into a relative youngster.
The idea was raised by Treasury Secretary Steven Mnuchin in an interview Thursday on CNBC, echoing an earlier comment he made when newly nominated by President Donald Trump. Traders say the idea would be to help the government's future debt payments by securing current low interest rates.
The euro bounces from its cycle bottom.
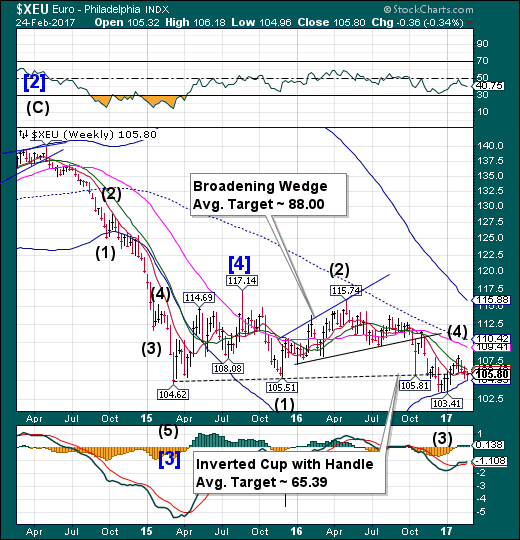
The euro bounced from its weekly cycle bottom at 104.95 on Wednesday, but closed beneath the lip of its cup with handle formation near 106.00. A bounce to Long-term resistance at 109.41 may be the next outcome. There may be some cyclical strength in the next few weeks.
(Reuters) The Netherlands' future relationship with the euro will be comprehensively debated by its parliament following elections in March, after lawmakers commissioned a report on the currency's future.
The motion approving the investigation by the Council of State, the government's legal advisor, coincides with a rising tide of euro scepticism in Europe, which populist parties are hoping to tap into in a series of national elections this year also taking in euro zone powerhouses France and Germany.
The probe will examine whether it would be possible for the Dutch to withdraw from the single currency, and if so how, said lawmaker Pieter Omtzigt.
Euro Stoxx makes a high on Wednesday, pulls back on Friday.
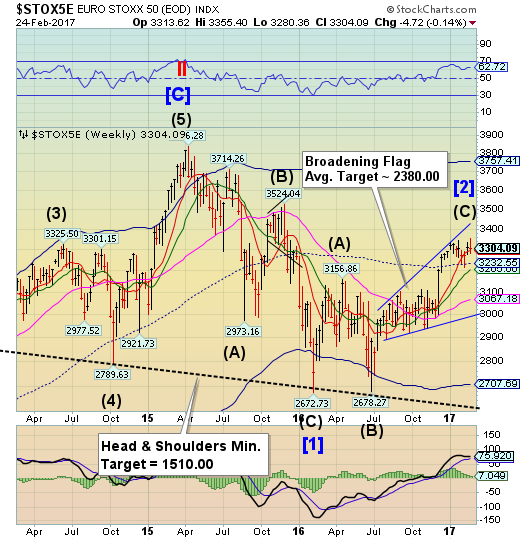
The Euro Stoxx 50 Index may have completed its retracement high on Wednesday, then declined to close above short-term support/resistance at 3296.96 on Friday. The cycles model suggests that the period of strength may be over. A break of short-term support may offer a sell signal which may be confirmed beneath mid-cycle support at 3232.55.
(Bloomberg) European stocks tumbled as investors questioned whether a rally that pushed equities to a 14-month high had gone too far.
The Stoxx Europe 600 Index slid 0.8 percent at the close in its biggest drop in more than three weeks, as all industry groups declined. Boosted by bets for stronger global growth and a pickup in inflation, the benchmark jumped 14 percent from a Nov. 4 low through Tuesday before losing steam.
Commodity producers, banks and car makers, among the biggest winners in the recent rally, led declines on Friday. The gauge of miners fell for a third day, after climbing to its highest level since July 2014.
The yen breaks through Intermediate-term resistance.
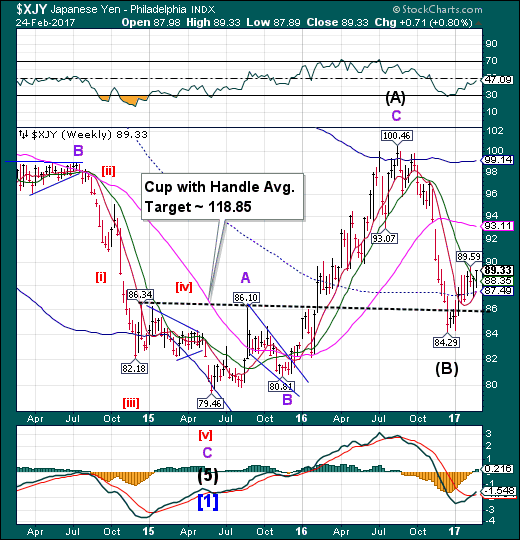
The yen broke through Intermediate-term resistance at 88.35, but did not break out above its prior high. A breakout would be a strong buy signal for the yen.The cycles model suggests a period of strength may last through mid-March.
(CNBC) The yen was set to strengthen against the dollar, despite expectations that U.S. interest rates will rise this year, a foreign-exchange strategist at JP Morgan (NYSE:JPM) told CNBC.
The first reason that the dollar wasn't likely to flex its muscles against the yen was that the U.S. Federal Reserve just isn't that gung ho, Jonathan Cavenagh, head of emerging market Asia foreign-exchange strategy at JP Morgan, told CNBC's "Street Signs" on Friday. he said:
While [the minutes were] sounding hawkish through some parts of the Fed, overall we don't think there's necessarily going to be an aggressive Fed tightening cycle, particularly in the first half of this year.
The Nikkei had an inside week.
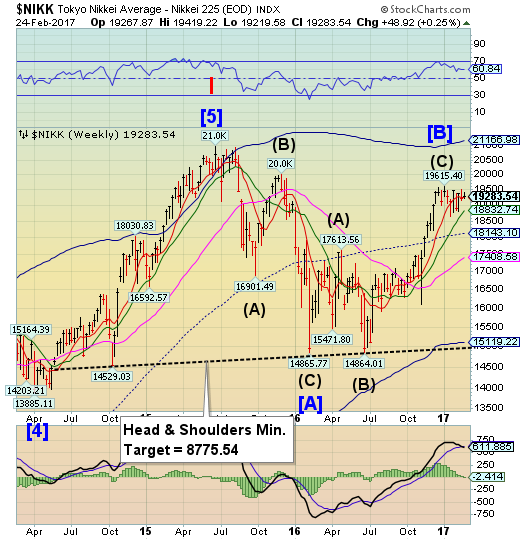
The Nikkei 225 consolidated in an inside week, closing above weekly short-term support at 19252.95. A breakdown beneath this consolidation zone and Intermediate-term support at 18832.74 confirms the sell signal. A loss of the next supports suggests a potential decline to the cycle bottom at 15119.22 or lower.
U.S. dollar tests the broadening top, then retreats.
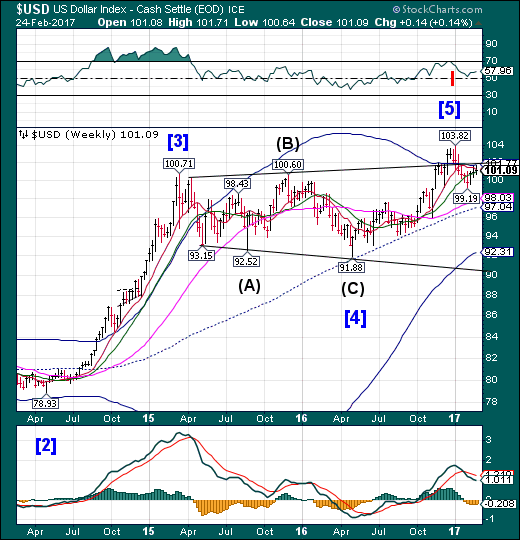
USD also had an inside week beneath the upper trendline of its broadening top, closing beneath its short-term resistance at 101.25 but above Intermediate-term support at 100.99. A sell signal is activated beneath Intermediate-term support. The ensuing decline maybe described in superlatives.
(Reuters) Speculators increased bullish bets on the U.S. dollar for the first time in seven weeks, according to Commodity Futures Trading Commission data released on Friday and calculations by Reuters.
The value of the dollar's net long position totaled $15.02 billion in the week ended Feb. 21, up from $14.99 billion the previous week.
Despite the rise in the dollar's net long positioning, the greenback remains an underperformer so far this year, down about 1.1 percent, after gains of 3.6 percent in full-year 2016.
Gold breaks out, nearing target.
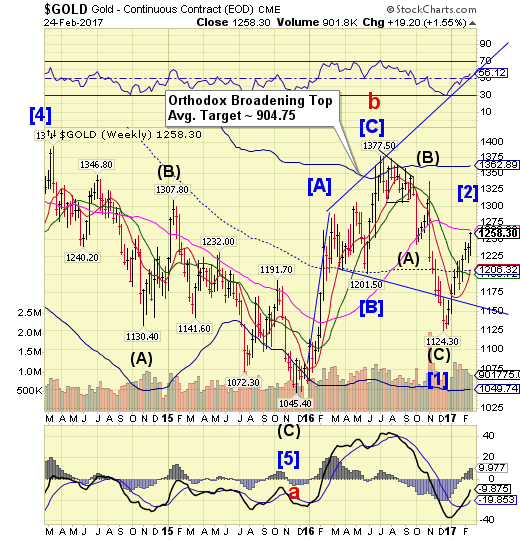
Gold broke out above its 1246.60 high and is now approaching its orthodox broadening top target at long-term resistance at 1263.82. The cycles model suggests completion as early as Tuesday or Wednesday of this week. There may be a lot of unhappy longs soon after.
(Reuters) Gold hit its highest in about 3-1/2-months on Friday, on a weaker dollar and as uncertainties surrounding U.S. President Donald Trump's policies and elections in Europe fueled safe-haven demand.
Spot gold was up 0.4 percent at $1,254.10 per ounce at 0809 GMT, after touching its highest since Nov. 11 at$1,254.31 earlier in the session.
The dollar index was down 0.2 percent at 100.87.
U.S. gold futures edged up 0.3 percent to $1,255. Tempered expectations of a U.S. rate hike in March following the release of the minutes from the U.S. Federal Reserve's last meeting were also seen supporting the bullion.
INTL FC Stone analyst Edward Meir said:
Even in the event of a rate increase, we doubt the precious metal will lose much ground ahead of the key presidential elections in France in April, coupled with the Washington gridlock that seems to be calcifying with greater intensity after each passing day.
Crude fails to break out.
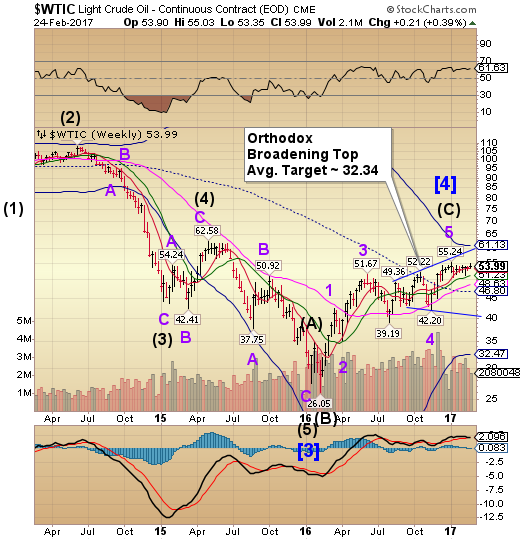
Crude had a brief period of strength that may have ended on Wednesday which failed to achieve a breakout. WTI closed above short-term support at 53.55. A decline beneath intermediate-term support at 51.23 produces a sell signal for crude. The cycles model suggests a potential turn date may have happened on Friday. The cycles are compressed here, making sudden, dramatic moves highly probable.
(OilPrice) It’s reserves reporting season in the oil and gas business. And one of the world’s biggest plays saw some major casualties this week as new numbers hit the street.
Conoco Phillips (NYSE:COP) kicked off the carnage on Tuesday. Reporting that it has cut reserves by 1.2 billion barrels at four oil sands projects: Surmont, Foster Creek, Christina Lake and Narrow Lakes. With overall reserves from these plays dropping from 2.4 billion barrels to just 1.2 billion barrels as of the end of 2016.
And the situation was even more severe for fellow oil sands producer ExxonMobil (NYSE:XOM), which announced yesterday it has written down 3.5 billion barrels of reserves from its Kearl project, representing a full 100% of the reserves previously booked here.
Shanghai Index retracement extends.
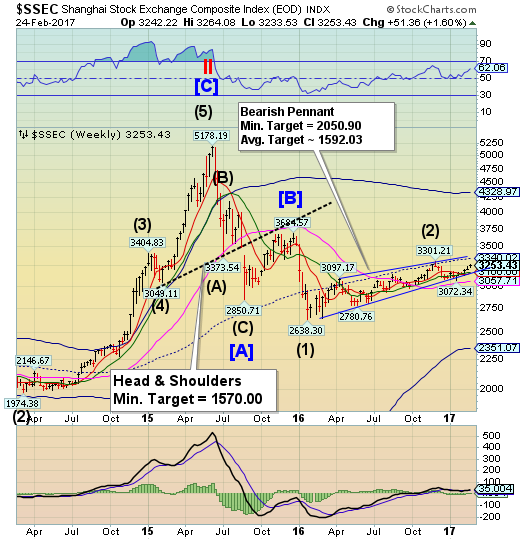
The Shanghai Index may have ended its bounce on Wednesday with nearly an 86% retracement of the decline from November 29. The fractal model suggests the Shanghai is due for another 1,000 point drop. The index restores its sell signal beneath Intermediate-term support and trendline at 3172.44.
(ZeroHedge) One month ago, in delightful, if anticipated, confirmation that much if not all of China's data has been cooked and fabricated as so many skeptics suspected, we reported that according to the People's Daily, the rust-belt province of Liaoning had admitted to fabricating fiscal numbers from 2011 to 2014. The fabricated economic data was meant to show a state of economic strength with fiscal revenues inflated by at least 20%, and some other economic data were also false, the paper said, without specifying categories. In short, the fabrication opened a hornet's nest: if one Chinese was doing it, then why not all, and by how much was the real data off?
But why manipulate the numbers to paint a rosier picture? For obvious reasons: the data were made up "because officials wanted to advance their careers." The fraud misled the central government’s judgment of Liaoning’s economic status, he said, citing a report from the National Audit Office in 2016.
The Banking Index reverses beneath the trendline.
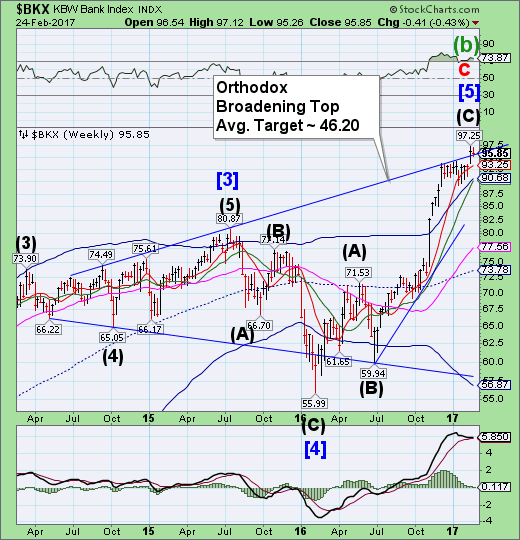
BKX could not break above the February 15 high at 97.25, closing at the upper trendline of the orthodox broadening top formation. While there may be a brief probe higher, once beneath the trendline the decline may be underway. BKX appears to be ready for a large decline that may extend through mid-March, according to the cycles model.
(Reuters) Guo Shuqing, who is stepping down as governor of Shandong province to take control of China's banking regulator, returns to Beijing at a decisive moment for the country's financial system following years of break neck economic growth.
The immediate challenge for the new chairman of the China Banking Regulatory Commission (CRBC) is formidable - Guo must vigorously address troubled lending in the country's 232 trillion yuan ($34 trillion) banking sector and implement tougher measures to control lightly regulated shadow banking activities.
For Guo, highly regarded as one of China's most experienced financial services professionals, returning to Beijing follows an accomplished career including appointments as chairman of China Construction Bank Corp (601939.SS)(0939.HK), the head of the China Securities Regulatory Commission, and most recently as a provincial governor.
(MishTalk) Bitcoin hit an all-time high of $1,172.09.
Traders are happy because the SEC is expected to rule on a Bitcoin ETF by March 11.
Meanwhile, Bloomberg reports China is developing its own digital currency.
After assembling a research team in 2014, the People’s Bank of China has done trial runs of its prototype cryptocurrency. That’s taking it a step closer to becoming one of the first major central banks to issue digital money that can be used for anything from buying noodles to purchasing a car.
(AltMarket) As a part of the increasingly obvious set-up of conservative movements by international banking interests and globalist think-tanks, I have noticed an expanding disinformation campaign which appears to be designed to wash the Federal Reserve of culpability for the crash of 2008 that has continued to fester to this day despite the many claims of economic “recovery.” I believe this program is meant to set the stage for a coming conflict between the Trump Administration and the Fed, but what would be the ultimate consequences of such an event?
In my article 'The False Economic Recovery Narrative Will Die In 2017', I outlined the propaganda trap being established by globalist owned and operated media outlets like Bloomberg, in which they consistently claim that Donald Trump has “inherited” an economy in recovery and ascendancy from the Obama administration. I thoroughly debunked their positions and “evidence” by showing how each of their fundamental indicators has actually been in steady decline since 2008, even in the face of massive monetary intervention and fiat printing by the Fed.
(ZeroHedge) Goldman's former President and COO, who was recently picked to be Trump's chief economic advisor as head of the National Economic Council, will recuse himself from any matters directly involving his former employer, the White House told the Financial Times.
The topic emerged when the FT learned that the former "#2" at Goldman was spearheading Goldman's lobbying at the U.S. derivatives regulator on rules prompted by the role swaps contracts played in the 2008 financial crisis. As president of Goldman Sachs, Cohn attended four meetings in 2015 and 2016 with top officials at the CFTC to discuss the swaps rules mandated by the sweeping Dodd-Frank reforms, according to meeting records.
