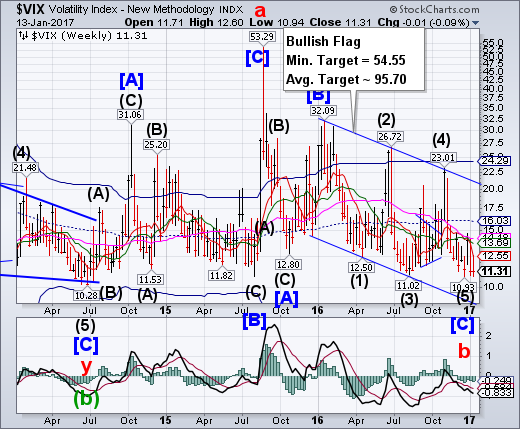
VIX pressed down to the 10-handle for a second week, but did not go beneath the Master cycle low of December 21, although marginally beneath last week’s low at 10.98. The successful retest of the December low is an indication of a probable change in trend. A buy signal may be forthcoming should the VIX rally above its Long-term resistance at 14.19. The breakout above the resistance zone implies higher targets to come. The abrupt turn made in August 2015 may be repeated here.
SPX closes beneath the Broadening Top.
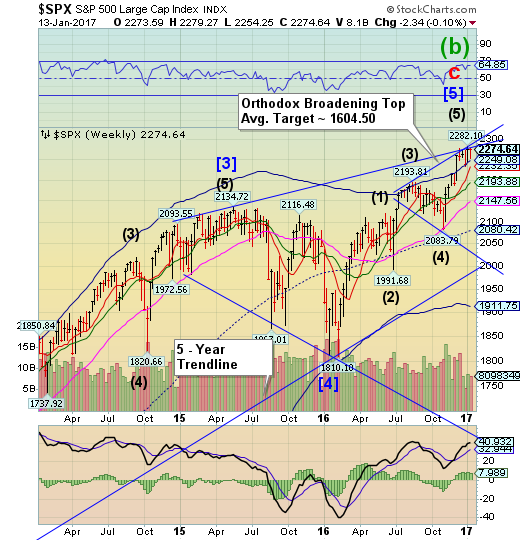
SPX declined to its weekly Cycle Top support at 2249.08 before bouncing to the upper trendline of the larger Orthodox Broadening Top. It closed beneath the lower trendline at 2275.00. A decline beneath the Cycle Top support at 2249.08 gives the SPX a sell signal. The smaller Broadening Top formation suggests a decline to 2000.00 or possibly lower may occur.
(Reuters) The S&P 500 rose on Friday after major U.S. banks kicked off the fourth-quarter earnings season with strong results, helping fuel confidence about a recent market rally.
Wall Street has surged since President-elect Trump's unexpected election victory on optimism he will cut corporate taxes, spend on infrastructure and deregulate banks.
With stocks trading at valuations well above historic averages, many investors believe further gains will depend on S&P 500 companies handing in strong report cards over the next several weeks.
The NDX pushes to the upper trendline of the Orthodox Broadening Top.
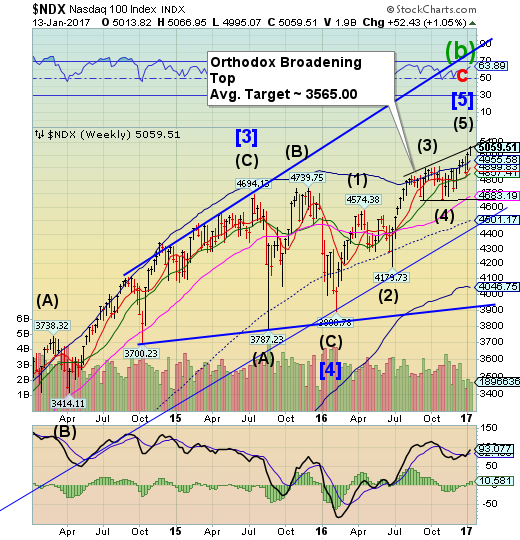
NDX made a new all-time high on Fridayas it challenged the upper trendline of its Orthodox Broadening Top. It must cross beneath its Cycle Top support at 4955.58 to give it a possible sell signal. A further break of the weekly Short-term support at 4899.83 confirms a sell signal.
(ZeroHedge) The vast majority of market participants are showing a surprising lack of flexibility and adaptability when it comes to the Trumpflation trade. As Bloomberg's Mark Cudmore warns, they may regret it.
The dollar can still correct a chunk more without 2017 being a write off. The rush to rapidly buy the smallest dip, without proper consideration for the risks, is fraught with danger.
In the last 24 hours, I’ve been overwhelmed by the number of analyst notes recommending that the correction in the Trump victory-related themes – stronger dollar and higher yields as the most prominent ones -- has already gone too far and provides a great “opportunity” to add to positions.
High Yield Bond Index challenges Short-term support and trendline.
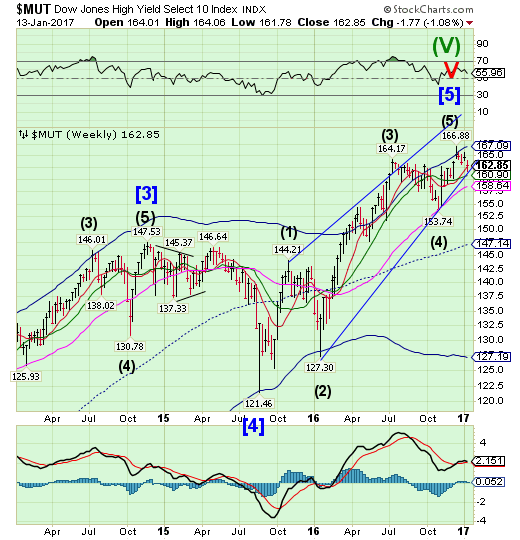
The High Yield Bond Index challenged weekly Short-term support at 162.75 and the Ending Diagonal trendline just beneath it. High Yield Bonds are on a sell signal. The Cycles model suggests a 2-3 week decline ahead. A broken Diagonal trendline near 160.00 implies a complete retracement of the rally may occur. Is this the canary in the coal mine?
(NYT) The forces that rejuvenated the stock market late last year have changed the profile of the fixed-income market.
Heading into the fourth quarter, for example, funds that invest in long-term government debt had been up more than 13 percent for the year as investors favored relatively safe bets on a sluggish economy. But as market interest rates shot up on hopes of accelerating growth and fiscal stimulus from the incoming administration of Donald J. Trump — hopes that contributed to the big rally in stocks — long-term government bond funds fell by double digits in the final three months of the year and finished 2016 up just 1 percent. The Vanguard Long-Term Government Bond E.T.F., for instance, fell nearly 12 percent in the final three months of 2016 and finished the year up only 1.2 percent for the year.
USB pauses. Going higher?
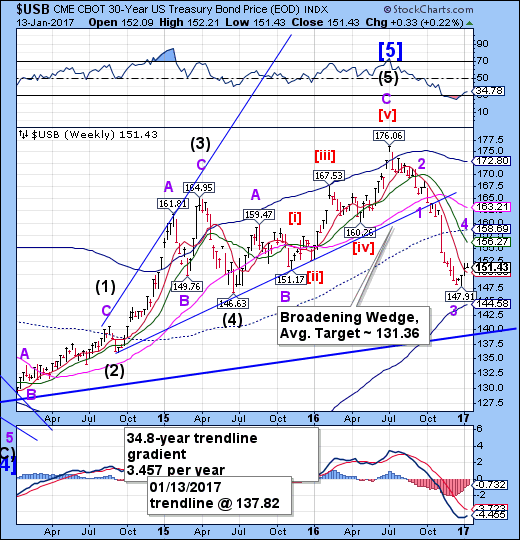
The Long Bond paused above weekly Short-term support at 150.39.The Cycles Model allows another attempt at mid-Cycle resistance at 158.69 over the next week. Success in making that target is not assured. The final declinemay resume shortly with a target near the 35-year trendline at 137.82 by mid-February.
(CNBC) U.S. government debt prices fell on Wednesday as investors digested Donald Trump's remarks at his first press conference as president-elect, as well as new supply.
The benchmark 10-year note yield traded lower following the sale, around 2.358 percent. The yield on the 30-year Treasury bond was also lower, at 2.951 percent.
During the conference, Trump said he thinks Russia is responsible for election-related hacking, but he also pointed to cyberattacks by other groups and declined to criticize Russian President Vladimir Putin. "I think it was Russia, but I think we also get hacked by other people," he told reporters.
The euro strength may be waning.
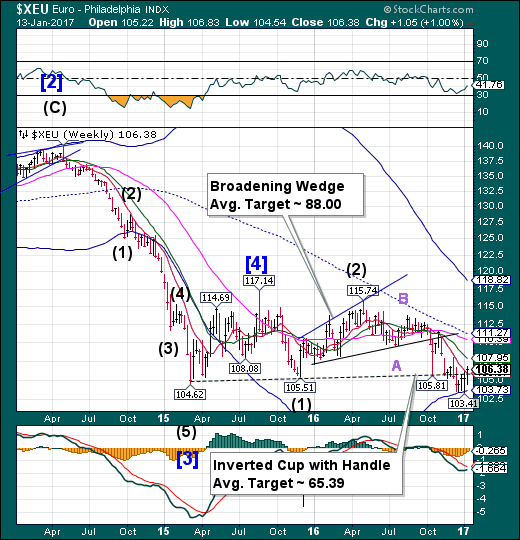
The euro is challenging the Lip of its inverted Cup with Handle formation near 106.00, closing above it. Its period of strength may only have a few days left as it is due for its next major low in February. The Cup with Handle allows throw-backs, so we may see a brief visit to Intermediate-term resistance at 107.95.
(Bloomberg) The euro headed for a fourth weekly advance versus the dollar, its longest winning streak since 2014. The shared currency is strengthening as investors pare bets that President-elect Donald Trump’s victory will spur growth and inflation. The gains accelerated this week as his first press conference since the election failed to provide more information on a potential boost to U.S. fiscal stimulus.
Euro Stoxx 50 closes beneath the high.
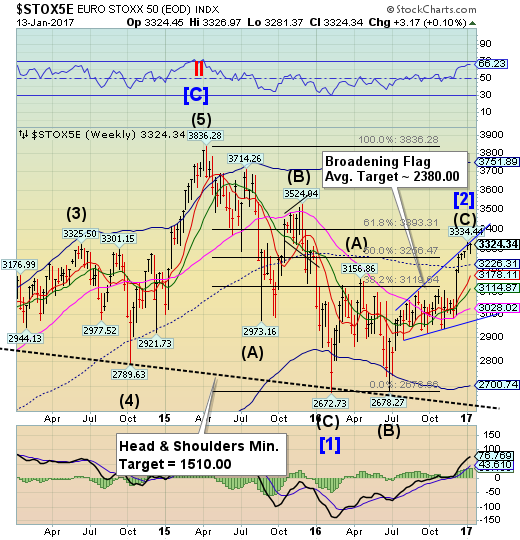
The Euro Stoxx 50 Index slipped back beneath its Broadening Flag trendline, leaving the January 3 high intact. It is now due for a decline that may follow over the next several weeks. The Index must complete a reversal pattern beneath mid-Cycle support/resistance at 3226.31 before a sell signal may be issued.
(Reuters) European shares rose on Monday, led higher by banks stocks, with Britain's blue chip index finishing at an all-time high after extending a record winning streak to 14 days.
However, shares of French media company Technicolor fell 19.7 percent in their worst-ever one-day loss after a profit warning.
The European banking index was the top sectoral gainer, up 2 percent, helped by strong earnings from large lenders in the U.S. and the outlook for higher interest rates in the world's largest economy.
The yen passes another hurdle.
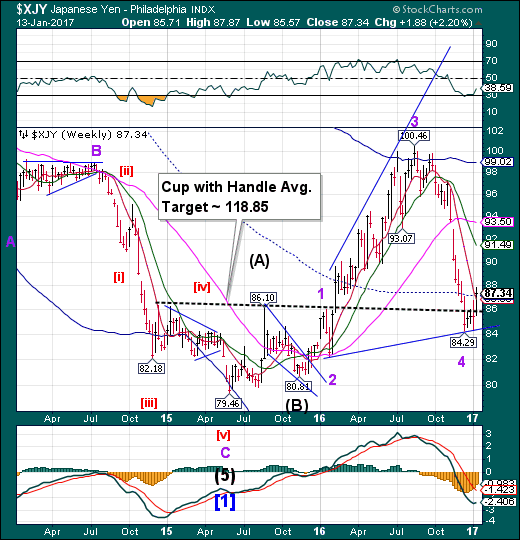
The yen launched itself form the Lip of the Cup with Handle formation to pass weekly Short-term support/resistance at 86.88 and the weekly mid-Cycle resistance at 87.23. The next two weeks appear to be a period of strength for the yen. It may now be capable of a “slingshot move” that may meet the target of the Cup with Handle formation.
(Bloomberg) The dollar headed for its biggest weekly decline against the yen since July after erasing gains from moderate bargain-hunting earlier Friday.
The greenback had rebounded to as high as 115.18 yen in morning Asian trade as Citigroup Inc. and Morgan Stanley recommended buying the currency pair. Societe Generale (PA:SOGN) SA predicts the dollar will reach 120 yen, and strengthen to parity with the euro within Donald Trump’s first 100 days in office, as most clients are still bullish on greenback.
The U.S. currency’s correction this week is due to “flushing out of some positions” as speculative bets against Treasuries get unwound, Kit Juckes, London-based global strategist at SocGen, said at a briefing in Singapore. “We’ll get more inflation, we’ll get a bit more growth” in the U.S., he said, adding that “as long as that’s the case, I don’t think that the selloff in Treasuries market’s finished, or the rally in the dollar’s finished.”
The Nikkei starts its decline.
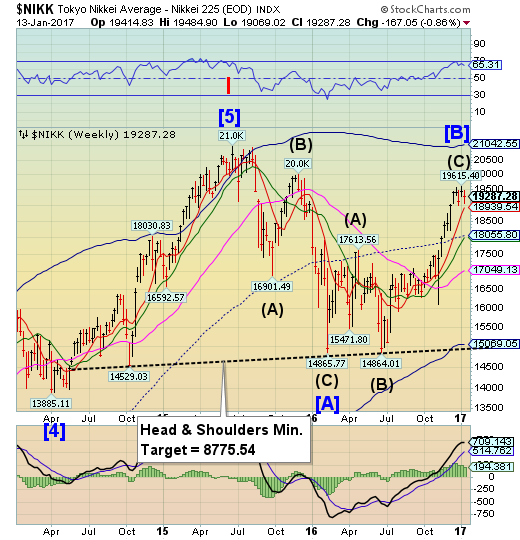
The Nikkei peaked on January 4 and has been in decline since then. The rally was extended, leaving no clear level of support above Short-term support at 18939.54. A further decline beneath that support may confirm a sell signal.
(Reuters) Japan's Nikkei share average bounced back from two-week lows on Friday, supported by optimism on the domestic economic and earnings outlook, with retailer Seven &i Holdings surging after posting strong earnings.
The Nikkei rose 0.8 percent to 19,287.28 while the broader Topix gained 0.6 percent to 1,544.89, with advancers outnumbering decliners by 2-1.
US Dollar Closes Lower
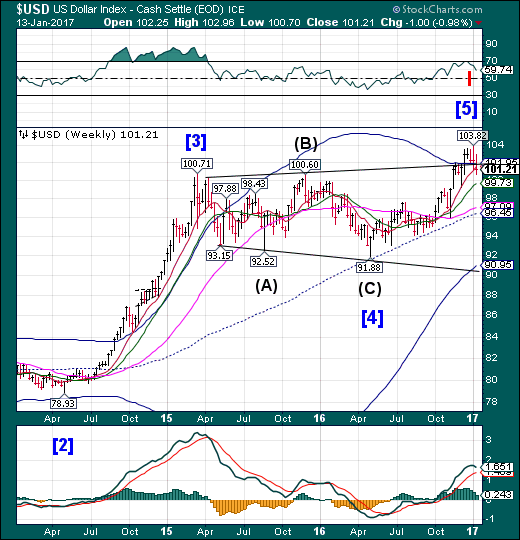
USD closed beneath its trend line and Short-term support at 101.58, leaving it on a sell signal. However, the selling session may be short, lasting only a week or so. The initial target may be Long-term support at 97.09 or mid-Cycle support at 96.46.
(Reuters) Speculators pared back net long bets on the U.S. dollar in the latest week, as investors reduced positions that have become overextended due to a rally inspired by Donald Trump's victory in the U.S. presidential election two months ago.
The value of the dollar's net long position was $24.95 billion in the week ended Jan. 10, from $25.43 billion the previous week, according to data from the Commodity Futures Trading Commission and calculations by Reuters.
The dollar this week posted its worst weekly performance since November as the positive effect of Trump on the market seems to be fading. At Wednesday's first press briefing before his inauguration next week, Trump failed to provide details on his much-touted fiscal stimulus plan of increased infrastructure spending and tax cuts. That disappointed stock and dollar bulls that had rallied on those themes.
Gold is repelled at mid-Cycle resistance.
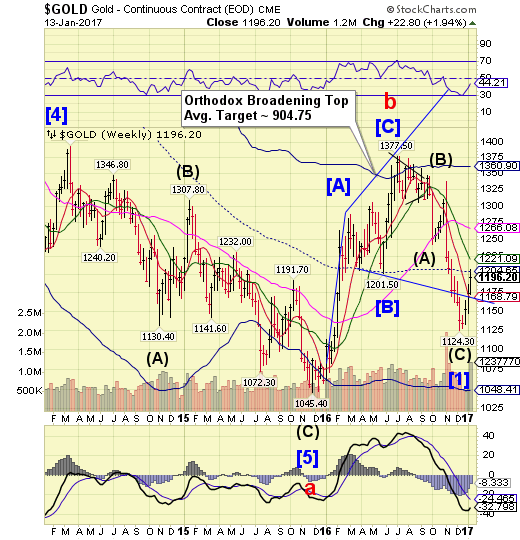
The Gold rally was repelled by weekly mid-Cycle resistance at 1204.65. It may now pull back to weekly Short-term support at 1168.79 before attempting another run higher. The Cycles Model suggests apattern that matches with the Broadening Top pattern and calls for a retracement of one-third to one-half of the decline.The rally may target Long-term resistance, now at 1266.08.
(Reuters) The price of gold turned higher on Friday, hovering below the prior session's seven-weektop as the U.S. dollar weakened and U.S. Treasury yields cameoff their highs, with the metal on track for a third straight weekly gain.
The greenback and yields were initially higher on the backof strong U.S. retail sales, which reinforced the prospect ofthe Federal Reserve raising rates this year, perhaps sooner than previously expected, traders said.
Spot gold was 0.2 percent higher at $1,197.99 anounce by 3:09 p.m. EST (2009 GMT). It was up 2.1 percent on the week.
Crude declines to Short-term support.
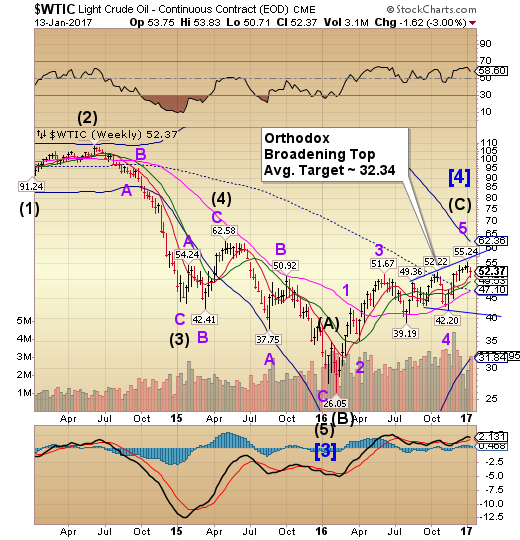
Crude declined from its January 3 retracement high, bouncing off Short-term support at 51.29.The Cycles Model suggests a potential low in the next two weeks.The Cycles are compressed here, making sudden moves highly probable.
(Bloomberg) Oil posted the biggest weekly decline since November as traders await proof that OPEC and other producers are following through on promises to cut production.
Futures declined 1.2 percent in New York on Friday and slid 3 percent this week. Saudi Arabia reduced output to less than 10 million barrels a day and will consider renewing its pledge to trim supply in six months, according to Energy Minister Khalid al-Falih. Still, until monthly production data is released, “these claims cannot be verified,” according to Commerzbank AG. The U.A.E. doesn’t intend to reduce output more than was agreed upon with OPEC in November and a tanker is said to sail to Libya’s Zawiya port to load Sharara crude.
Shanghai Index supported at the Pennant trendline.
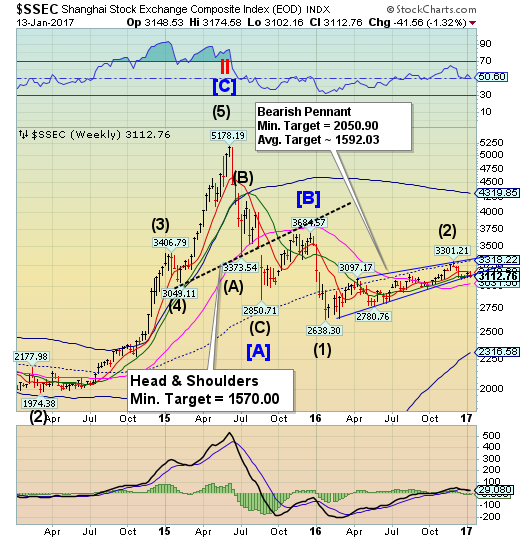
The Shanghai Index continues to be supported by its year-long Bearish Pennant formation at 3110.00. However, Short-term resistance is at 3170.60, in opposition to a further rally. The fractal Model suggests the Shanghai is due for another 1,000 point drop, possibly starting next week. Stay on the alert for the next breakdown beneath the trendline.
(ZeroHedge) China is so concerned about the ongoing surge in capital outflows that its forex regulator, SAFE, has taken the unprecedented step of ordering banks to keep its instructions about curbing capital outflows secret and also to ensure that research analysts do not publish any negative views about the yuan according to Reuters. According to bankers from local and foreign banks, both demands are seen as an attempt by the authorities to prevent alarm that could trigger further declines in the yuan.
With the yuan losing 6% of its value against the dollar last year as a result of hundreds of billions in official outflows (and as much as $1.1 trillion in unofficial since August 2015 according to Goldman calculations), Beijing has unleashed a flurry of restrictive measures on capital outflows from the State Administration of Foreign Exchange (SAFE), including setting limits on banks' currency volumes in some cities or provinces and requiring approval for ever smaller transactions. Overnight, the PBOC even unveiled probed into bitcoin exchanges, sending the digital currency plunging over 20%.
The Banking Index edged higher.
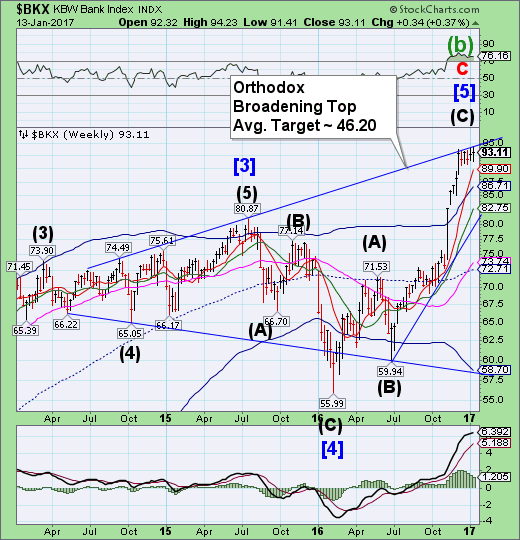
--BKX made a new high today, beating the December 8 high by 58 ticks.A reversal beneath weekly short-term support at 89.90 may result in a sell signal and probable decline to the mid-Cycle support at 72.71 under normal circumstances, but the ultimate target may be the “point 6” target near 54.00. Once broken, we may expect this three-year Broadening Top pattern to unwind very quickly.
(ZeroHedge) Well that's not supposed to happen..."awesome" earnings... "sell the news"?
(ZeroHedge) Over the year, Deutsche Bank has been accused - and found guilty - of doing many illegal things (and paid handsomely for it, both in terms of penalties as well as sacked CEOs), but what happened yesterday was new.
As we observed yesterday morning, as part of his latest attack on currency speculators, Erdogan compared FX traders to terrorists, saying that "terrorists with dollars and with weapons have no difference." Furthermore, on Thursday the government friendly daily YeniSafak reported that Deutsche Bank (DE:DBKGn) and other German institutions were attempting “economic terror” against Turkey by recalling loans to companies before their due dates.
The German lender was not happy, and on Friday Deutsche Bank’s Turkish unit rejected claims that it’s plotting to undermine the economy, and said it’s “unacceptable” for the lender’s name to be associated with terrorism.
(ZeroHedge) While one can argue that both JPM and Bank of America posted results that were ok, with some aspects doing better than expected offset by weakness elsewhere, even if moments ago JPM stock just hit an all time high, there was little to redeem the report from the scandal-ridden largest mortgage lender in America, Wells Fargo (NYSE:WFC). Not only did the company miss revenues significantly, reported $21.6bn in Q4 topline, nearly $1 bn below the $22.4bn consensus, but it had to reach deep into its non-GAAP adjustment bag to convert the $0.96 EPS miss into a $1.03 EPS beat (net of "accounting effect"), but the details of its core business were, well, deplorable, which perhaps was to be expected following the recent drop in new credit card and bank account growth, following last year's fake account scandal.
(Reuters) Executives of big U.S. banks expressed optimism on Friday about the outlook for 2017 in their first public comments about quarterly earnings since the U.S. presidential election in November.
JPMorgan Chase & Co (NYSE:JPM) and Bank of America Corp (NYSE:BAC), the two largest U.S. banks, kicked off the corporate reporting season on a rosy note, each with healthy increases in fourth-quarter profit. Those improvements came on the back of trading revenue gains, higher interest rates, healthy loan growth and cost controls.
On the flip side, the earnings of Wells Fargo & Co, which also reported on Friday, were hurt by the fallout of a sales scandal and a loss related to accounting, both of which are particular to the San Francisco-based lender.
