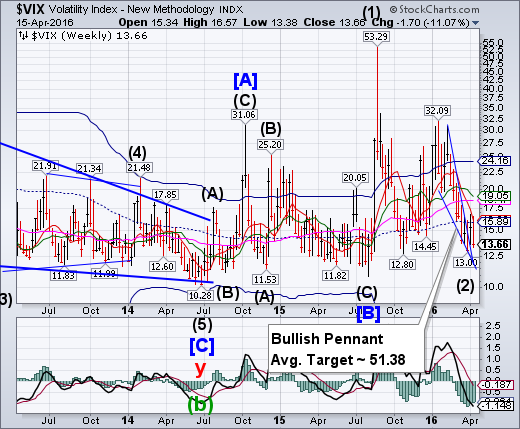
VIX challenged its weekly mid-Cycle resistance at 16.06, closing beneath it. It appears to be on an aggressive buy signal (NYSE sell signal), while closing above mid-Cycle resistance may confirm the signal.
(ZeroHedge) And CSFB's "Fear Barometer" just hit an all-time high...
As CS' Mandy Xu notes, typically, an increase in the CSFB is caused by a combination of higher put demand and lower call demand. Interestingly, this time, the entire move was driven by the call-side. The derivatives market is assigning less than 1% probability the market will rise by 10% in the next three months vs. 17% probability it will fall by 10%.
SPX closes at a lower high.
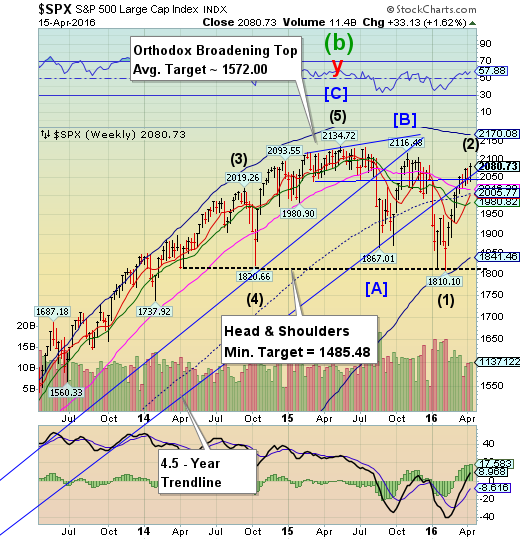
The SPX rallied again last week, but was not able to better the November 3 high.of 2116.48. A reversal beneath the trendline may constitute a sell signal on the SPX. Trendlines are important support areas that often attract, then repel the markets. Earnings season kicks into high gear next week. SPX average earnings are expected to decline another 7.4% year-over-year in the first quarter after a 7% decline in the fourth quarter.
(WSJ) The financial sector joined the stocks rally this week.
After a terrible start to the year, bank stocks received a much-needed boost after several of the largest U.S. banks reported earnings that beat lowered expectations.
The strong performance by banks led stocks higher for the week, with the S&P 500 closing with weekly gains of about 1.6%.
The KBW Nasdaq Bank Index rose 7% this week.
On Friday, stocks retreated slightly. The Dow Jones Industrial Average fell about 29 points, or 0.2%, to 17897. The S&P 500 declined 0.1% and the Nasdaq Composite shed 0.2%.
NDX could not close its gap.
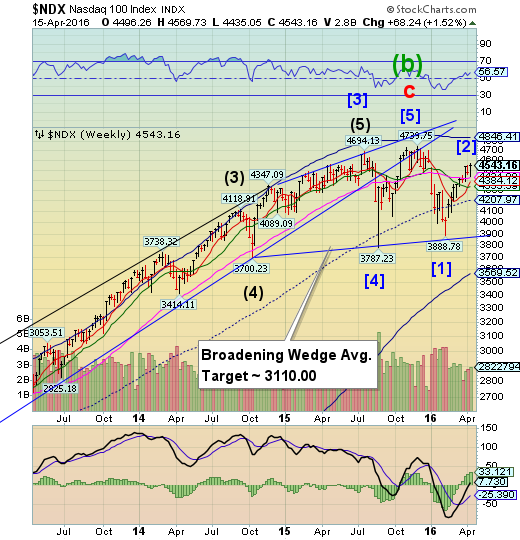
NDX probed higher this week, but was not able to close an important gap at 4592.88 left on December 31. This is a sign of technical weakness in the NDX. Weekly Long-term support is at at 4421.88. Should it decline beneath that level, NDX maybe on a sell signal.
(ZeroHedge) As one veteran trader told us, this massive short-squeeze came "out of nowhere," seemingly driven by oil-headline-induced algo momentum ignition. Goldman's "Most Shorted" stocks are up a stunning 6% in the last 2 days - the biggest 2-day surge since Oct 2015 as Credit Suisse (SIX:CSGN) noted earlier there is a "lot of pain being felt out there on the short side."
High Yield Bond Index goes even higher.
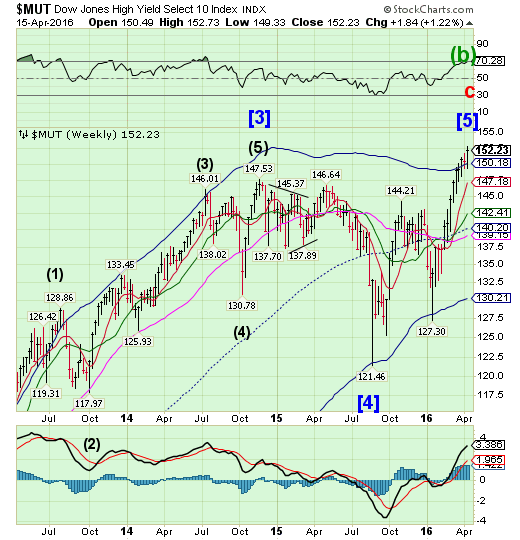
The High Yield Index rallied nearly 20% in the last 86 days. This may be the most spectacular rally in High Yield bonds on record. But the rally is also being met with surging issuance of new debt to match the demand. See below.
(MarketRealist) Deals and flows analysis in the high yield bond markets
High yield bond issuance surged last week and hit its highest level in 2016 yet due to continued growth in volume. According to data from S&P Capital IQ/LCD, dollar-denominated high yield debt amounting to $10.9 billion was issued in the week ended April 8. Last week’s issuance was not only the highest year-to-date but also the largest since March 20, 2015. In the previous week, high yield issuance stood at $8.2 billion. The number of transactions rose to eight last week from six in the previous week.
Last week brought the total US dollar-denominated issuance of high yield debt to $49.0 billion in 2016 year-to-date (or YTD). This is lower by 54% compared to the corresponding period of 2015.
The euro begins a pullback.
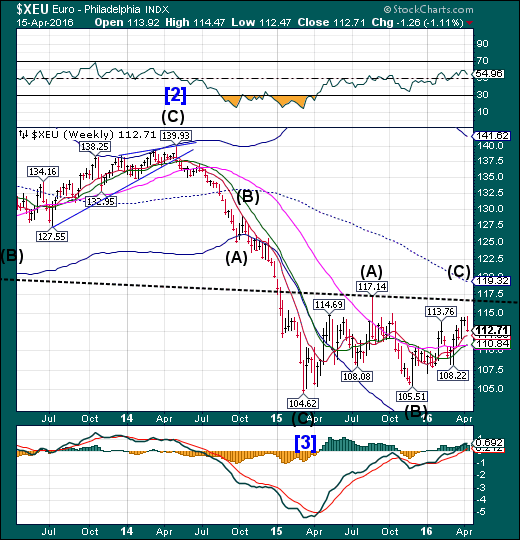
The euro has begun a pullback that may last into the coming week. The low may challenge Long-term support at 110.84 before reversing higher.
(Bloomberg) Implied volatility in the euro hasn’t kept pace with a surge in a similar measure for the pound, even as some investors look to hedge risks linked to a potential U.K. exit from the European Union using euro-dollar options. There is scope for the gap to narrow as euro-area political risks resurface, Bloomberg strategist Vassilis Karamanis writes.
Three-month pound-dollar implied volatility has exceeded 16 percent, hitting levels unseen in six years, while a six-month gauge reached 14.53 percent peak on April 7. The spread between six-month pound-dollar volatility and a similar euro-dollar measure widened to a record of almost 4 percentage points on April 13.
EuroStoxx breaks through 3000.00.
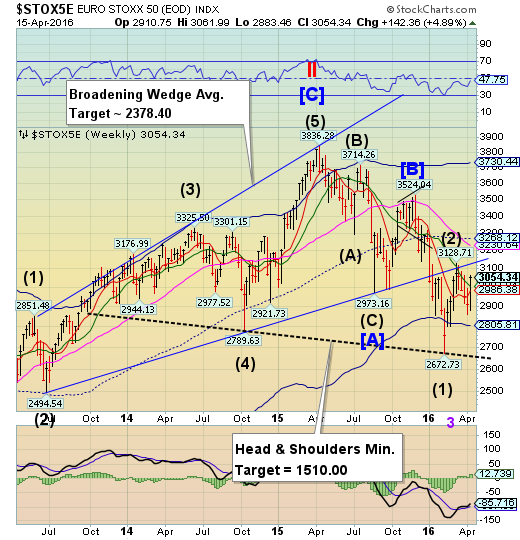
After a month of struggle against Intermediate-term support, EuroStoxx broke above 3000.00 last week. However, considering how late in the Cycle the rally began, it may only be a retracement attempt rather than a surge to new highs. A decline beneath weekly Short-term support at 2986.38 reinstates the sell signal.
(ZeroHedge) A year ago today, European equities hit their highest levels ever. But, as Bloomberg reports, the euphoria about Mario Draghi’s stimulus program didn’t last, and trader skepticism is now rampant. The Stoxx Europe 600 Index has lost 17% since its record, and investors who piled in last year are now unwinding bets at the fastest rate since 2013 as analysts predict an earnings contraction. The trading pattern looks familiar: a fast run to just over 400 on the gauge, then disaster...
The yen meets its Pennant objectives.
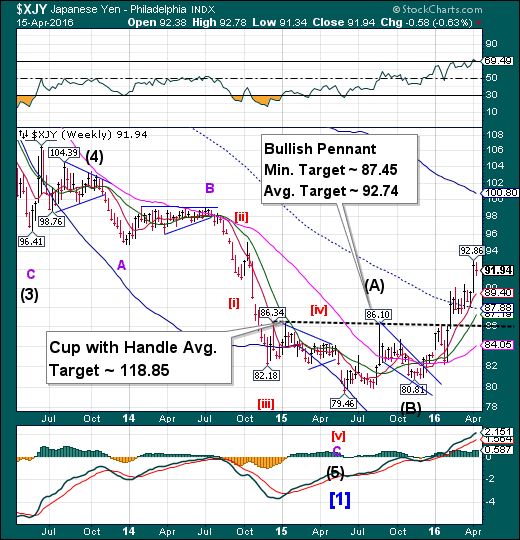
The yen has achieved its Bullish Pennant targets. It appears to be in a pullback that may test nearby supports in a potentially sharp retracement. The target area may be as low as the Lip of the Cup with Handle formation. While the Cup-with-Handle target may seem far-fetched, the Cycle Top at 100.95 may be attainable should the rally continue.
(Bloomberg) Hedge funds and other large speculators have never been more bullish on the yen.
Positions that benefit from gains by Japan’s currency exceeded those that benefit from from losses by a net 66,190 contracts in the week ended April 12, a report from the Commodity Futures Trading Commission showed Friday. That’s the most in data going back to 1992.
The Nikkei bounces to intermediate-term resistance.
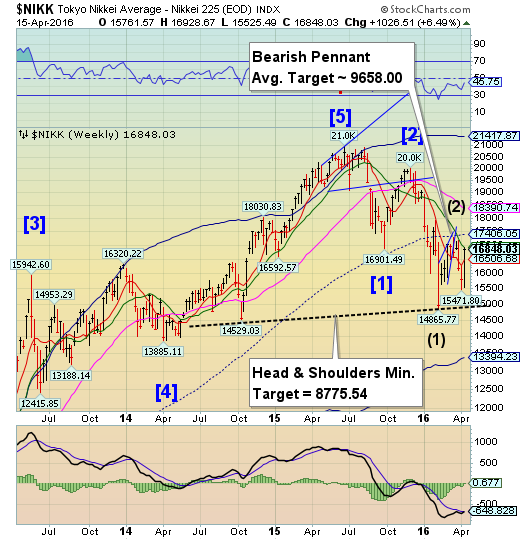
The Nikkei staged a bounce to Intermediate-term resistance at 16910.45. This may only be a detour as the decline may resume shortly. Should that occur, the next support may be the Head & Shoulders neckline followed by the Cycle Bottom at 13394.23.
(FoxBusiness) Japanese stocks fell on Friday as investors took profits after a three-day rally that added 1,159 points to the benchmark Nikkei index.
The Nikkei share average slid 0.4 percent to 16,848.03, ending a three-day rally that helped the benchmark index end the week about 6.5 percent higher.
The impact of a strong earthquake centered on Japan's southern island of Kyushu was limited primarily to regional shares that could experience some direct impact. Regional utility Saibu Gas Co Ltd (T:9536) ended the day 2.7 percent lower.
U.S. dollar decline takes a pause.
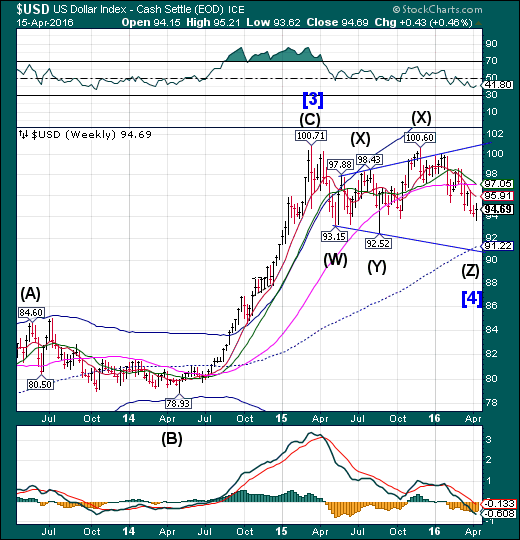
USD met its short-term targets last week and paused for a brief consolidation. The Cycles Model suggests a short-term bounce is due, but the longer-term decline may not be over, perhaps lasting through mid-May. The ultimate target for USD may be the weekly mid-Cycle support at 91.22.
(Reuters) Speculators chopped bullish bets on the U.S. dollar for a sixth straight week, pushing net longs to their lowest since late January 2009, according to Reuters calculations and data from the Commodity Futures Trading Commission released on Friday.
The value of the dollar's net long position fell to $0.4 billion in the week ended April 12, from $2.15 billion the previous week. The value of the dollar's net long position was the lowest since the week ended Jan. 27, 2009.
Net long yen contracts rose to 66,190, the highest since Reuters records began in March 1995 and up from 60,073 the previous week. Euro net short contracts fell to 52,051, their lowest in seven weeks.
So far in 2016, the U.S. dollar index has fallen about 4 percent, putting it on track for its worst yearly performance since 2009. The index, which measures the greenback against a basket of six other major currencies, gained more than 9 percent last year.
USB remains above Short-term support.
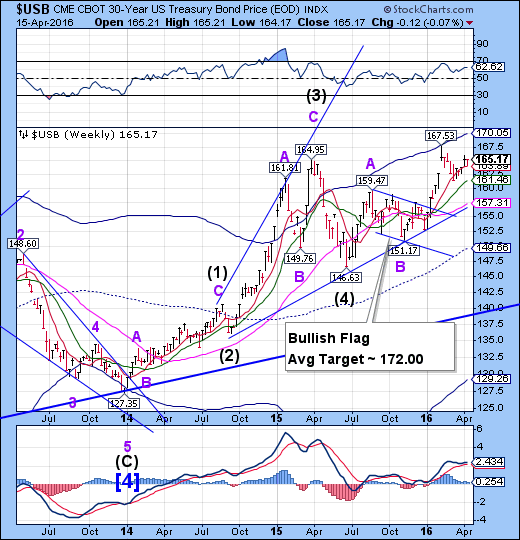
The Long Bond appears to be maintaining its rally above weekly Short-term support at 163.89 in a brief pullback. USB appears to be due for its all-time high in the next three weeks. Bonds have not been this overpriced (historically lowest yields) in over 300 years.
(Reuters) Investors on Thursday scooped up $12 billion of U.S. 30-year Treasury bonds as this week's price drop in government debt yields enticed bargain-minded fund managers, insurers and pension funds, according to Treasury data.
Brisk bidding revived appetite for Treasuries on the open market which pared earlier losses after the auction.
The latest 30-year supply was the final part of the government's coupon-bearing offerings this week. It sold $24 billion of three-year notes on Tuesday and $20 billion in 10-year debt on Wednesday.
The ratio of bids to the amount of 30-year bond offered was 2.40, the highest since December and above the 2.33 at the prior 30-year bond auction in March.
Gold may have completed a partial retracement.
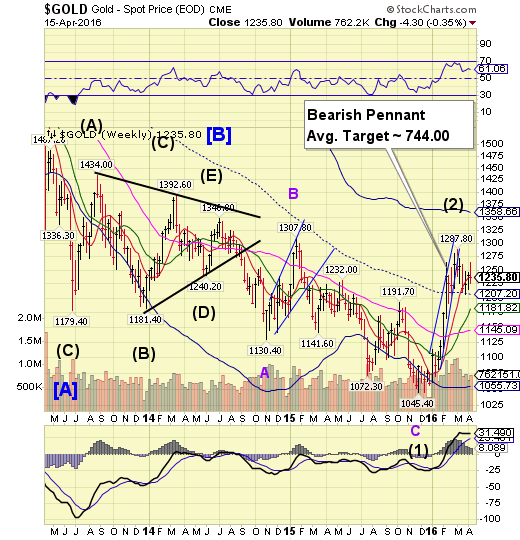
Gold retraced nearly 73% of its decline form 1287.80, but closed beneath short-term support/resistance at 1236.90. Despite the recent bounce higher, a decline from here may constitute a sell signal. Additional confirmation may come beneath mid-cycle support, at 1207.20. Investors are still treating gold as a buy-the-dip opportunity.
(MarketWatch) Gold futures notched a gain Friday, but posted their first weekly drop in the three weeks as a flight to haven assets dissipated somewhat and as a weekly gain in the dollar pressured the yellow metal.
The U.S. ICE Dollar Index DXY, -0.25% a gauge of the buck against a basket of six rival currencies, gained 0.5% this week—its first weekly gain in three weeks, coinciding with moves for gold.
“In general, I think that gold is starting to weaken because the fear factors that drove it higher at the start of the year are subsiding. China’s economy isn’t collapsing and earnings so far haven’t been as bad as feared,” Colin Cieszynski, chief market strategist at CMC Markets, told MarketWatch.
Crude probed higher.
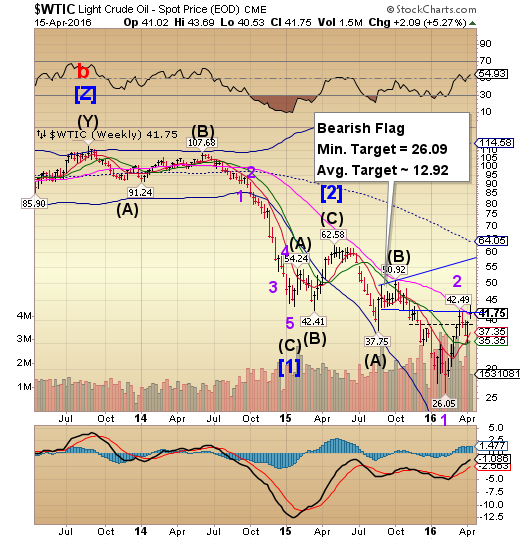
Crude extended its rally to a 72.% retracement of its decline from 50.92. It closed above Long-term support at 41.44. A further decline from that level suggests the sell-off may have begun. The brief period of strength lined up with the final push higher in the Liquidity Cycle. A decline beneath the next level of support at 38.50 may trigger a month-long decline in crude.
(Reuters) Money managers raised their bullish bets on U.S. crude in the week to April 12 after two straight weeks of cuts as market sentiment improved on hopes of an output freeze deal between the world's top producers, data showed on Friday.
All eyes in the oil market have been on an upcoming meeting among some of the world's biggest oil exporters, including Saudi Arabia and Russia this weekend in Doha, Qatar, aimed at propping up weak prices.
The managers of hedge funds and other investment firms that speculate on oil raised their combined futures and options position in New York and London by 27,635 contracts to 205,139 during the period, the U.S. Commodity Futures Trading Commission (CFTC) data showed.
Shanghai Index probes above mid-Cycle resistance.
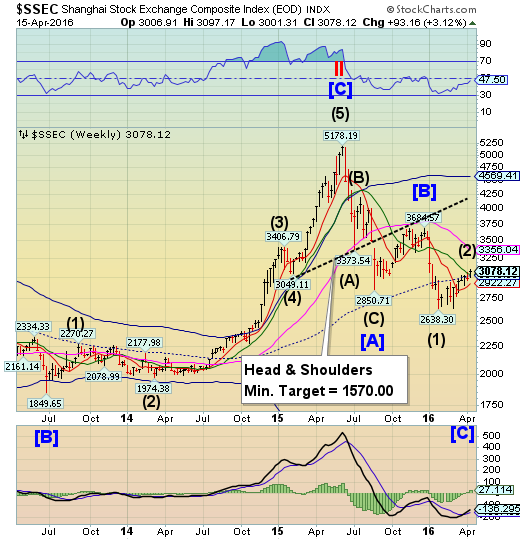
The Shanghai Index probed above its weekly mid-Cycle resistance at 3018.96 and Intermediate-term resistance at 3031.53. This appears to complete the retracement. A decline beneath Short-term support at 2922.27 may confirm a sell signal in the Shanghai.
(ActingMan) We have discussed China’s debt and malinvestment problems in these pages extensively in the past (most recently we have looked at various efforts to keep the yuan propped up). In a way, China is like the proverbial “watched pot” that never boils though. Its problems are all well known, and we have little doubt that they will increasingly find expression. China’s credit bubble is one of the many dangers hanging over the global economy’s head, so to speak.
However, as we are also fond of stressing, it seems to us that many outside observers are making the mistake of underestimating the strong entrepreneurial spirit of China’s people. In addition, there is a lot of focus on the many ways in which China’s government is faking data to make things appear better than they are (something it has in common with all other governments, only it is more brazen about it), but perhaps not enough focus on what is not known about China’s economy.
The Banking Index pays a surprise visit to the Head & Shoulders neckline.
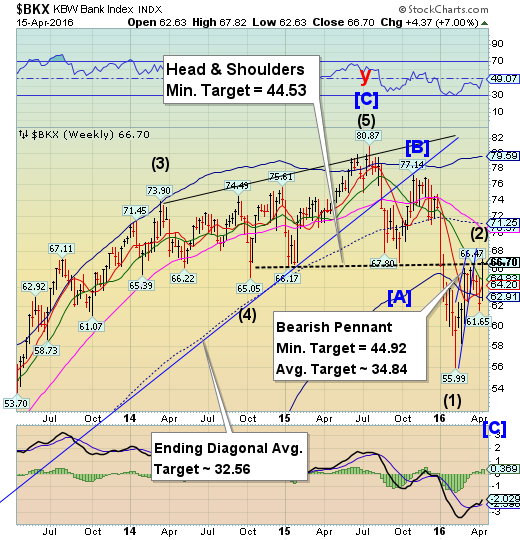
In a final burst in the Liquidity Cycle, BKX paid a brief visit to the Head & Shoulders neckline at 66.75. The inability to hold that support may lead to a rather bearish reversal. The anticipated low mentioned last week was made on April 7. The next significant low may be due in early May.
(ZeroHedge) Yesterday the Federal Reserve released a 19-page letter that it and the FDIC had issued to Jamie Dimon, the Chairman and CEO of JPMorgan Chase (NYSE:JPM), on April 12 as a result of its failure to present a credible plan for winding itself down if the bank failed. The letter carried frightening passages and large blocks of redacted material in critical areas, instilling in any careful reader a sense of panic about the U.S. financial system.
At the top of page 11, the Federal regulators reveal that they have “identified a deficiency” in JPMorgan’s wind-down plan which if not properly addressed could “pose serious adverse effects to the financial stability of the United States.” Why didn’t JPMorgan’s Board of Directors or its legions of lawyers catch this?
(NYTimes) For Chinese banks, the decision to lend to companies like Bohai Steel was for years a no-brainer. Lenders took heart from its state backing, which appeared as solid as the millions of tons of steel pipes that rolled off its production lines each year.
That ironclad image is now tarnished. Plunging demand and a worsening glut in production capacity have left Bohai Steel struggling to repay as much as $30 billion in debt. Worried creditors — more than 100 of them — are locked in negotiations with the company and local officials.
China’s bad loans are on the rise, as companies that borrowed heavily in headier times struggle against a slowing Chinese economy. Underscoring the slowdown, China said on Friday that growth in the first three months of this year fell to 6.7 percent, a seven-year low. Growth might have been even slower, had China not revved up lending during the quarter — a solution that could add to debt problems later on.
(MishTalk) Deutsche Bank (DE:DBKGn) Admits Rigging, Will Expose Other Riggers
Deutsche Bank has admitted it rigged both the gold market and the silver market. ZeroHedge has the details in his report Deutsche Bank Agrees To Expose Other Manipulators.
Many asked me to comment. I am shocked?
No. In the wake of admissions of rigged LIBOR and rigged Euribor (bank to bank interest rates in dollars and euros respectively), one would really have to wonder “What isn’t rigged?”
