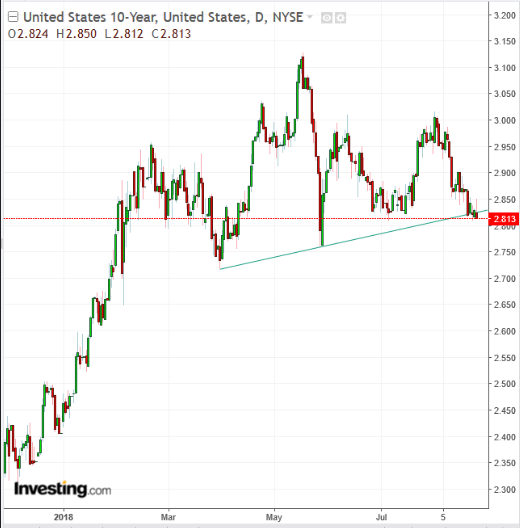
Right now, the market is sending out mixed signals. While three of the four major US indices—the S&P 500, NASDAQ Composite and Russell 2000—each posted new records on Friday, and the Dow remains just a bit more than 3 percent off its own previous record high, the US 10-year Treasury yield may have topped out. Could this be a warning to equity market investors?
At the same time that stocks were hitting new milestones, the yield on the 10-year Treasury note crossed below the neckline of a massive, complex head-and-shoulders top, increasing the probability of a trend reversal.
Stocks and bond yields are negatively correlated. When investors are looking for growth, they buy stocks and sell bonds, thereby lowering the price of the latter which increases the differential between price and yield, so that yields rise.
Conversely, when investors are fearful, they rotate out of equities into bonds, pushing bond prices higher. The higher bond price narrows the margin between price and yield, causing the latter to fall.

Evidence for the significance of the H&S neckline is demonstrated by the simultaneous violation of the 200 DMA for the first time since the price crossed above this primary MA 11 months ago. Last week, yields for the 10-year Treasury bond crossed below that neckline which means market participants have become more invested in long bond positions. This conflicts with the risk-on sentiment displayed via last week's equity market exuberance.
An additional warning sign has been brewing via the flattening yield curve, which could be the prelude to an inverted yield curve. That happens when short-term yields are higher than long-term yields, which doesn't objectively make sense. However, it demonstrates the dismal outlook investors have for economic growth in the longer term.
Market analysts have been debating whether current economic conditions are unique. Should that be the the case it would mean that the usual result of an inverted yield curve, which is almost always a leading indicator of upcoming recession, might not occur. This may jibe with an aging bull market. The San Francisco Fed however, concluded that the unique market dynamic does not diminish the validity of the negative signal of an inverted yield.
The current intermarket dynamic is on a knife's edge. If 10-year yields continue to fall, slipping below 2.75, we might expect that US equities will fail to hold on to records and follow yields lower.
