- Friday’s rebound was too little too late but that doesn’t mean trade will curtail the U.S. bull market
- Technicals show increasing red flags, with all major US indices falling below short-term uptrend lines with internal weakness
- Yields invert for the second time this year
- Oil fighting to stay above $60
Stocks staged a sharp comeback on Friday, after a four-day rout in which the S&P 500, Dow Jones, NASDAQ Composite and Russell 2000 all declined, and the SPX alone lost $1.4 trillion in market value, erasing five weeks worth of gains. The declines were triggered after U.S. President Donald Trump ratcheted up the stakes last weekend on trade negotiations between the U.S. and China, when he announced he'd be raising tariffs from 10% to 25% on $200bn in goods from China. Friday's rally was driven by hopes that even without a deal in place, China trade tensions will ease.
Even with trade as the probable catalyst, and despite bearish predictions from a variety of market analysts including ourselves, Friday's one day rally is as unreliable as the selloff that preceded it, not to mention the rally before that.
Sectors Turn Green But Investors Continue Seeking Safety
The S&P 500 gained 0.37% with all eleven sectors finishing in the green. Materials (+1.36%) jumped on speculation the world’s two largest economies would find a middle ground, but Utilities (+1.79%) outperformed as investors sought shelter in defensive stocks. The sub-index closed at the very highest point of the trade, within 2 percent of its Mar. 27 record high, right atop the 50 DMA. Healthcare (+0.03) barely moved higher, hanging on by a thread, after the House insurance bill passed on Thursday, a first step in the Democrats' escalating efforts to reverse Trump administration attempts to dismantle the Affordable Care Act.
While the S&P 500’s midday rebound might have been good for morale, it did little more than put a Band-Aid on the 2.18% weekly loss, the worst slide of the year. For the week, Technology (-3.37%) led the selloffs, but every single sector was in the red, with Consumer Staples (-0.17%) outperforming only due to its defensive nature. Utilities (-0.58%) also managed to keep remain relatively steady.

All charts powered by TradingView
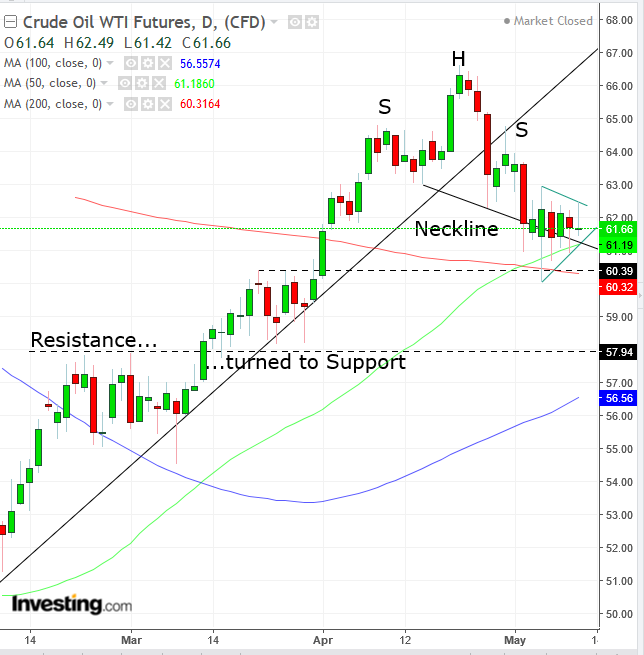
Energy (-0.31%) was the second-best performing sector for the week, after oil found support off the 100 WMA, even after fears that ending the Iran deal would induce chaos into the market, turned out to be unfounded, at least according to Secretary of State Mike Pompeo. We’re less optimistic: the daily price action depicts a bearish pennant in the making on the neckline of a weak, down-sloping H&S top.
In addition to the weekly MA mentioned above, temporary equilibrium was reached upon price hitting the March highs, compounded by the 50 DMA and 200 DMA, after a golden cross signaled higher prices—which have yet to materialize. A fall below the $60 level would serve to unspool the tightly wound trading range, sending it into a sharp decline to retest $58, a level with invested supply-demand interest, supported further by the up-and-coming 100 DMA.
As for the broader S&P 500, we've been bearish on the index since early December, before it was even popular to have such a stance. After the Christmas-eve rout occurred, we predicted another rally, before the advent of an all-out bear market. A number of factors provided evidence, not the least of which were: the lateness of the business cycle; the fact that we were seeing the longest and oldest bull market in history; rising demand for Treasurys. All of these points, which remain in effect, suggest some are simply not buying into the forever-young bull market mindset.
We've also focused on small caps, which have regularly been outperforming large caps. In our view this is out of character, considering the supposed faith markets are supposed to have in a trade resolution, which should encourage investors to dump small caps in favor of large caps, since they have more runway via their larger international markets relative to smaller, domestic firms. That anomaly leads us to wonder if either the trade headwind is a fairy tale, or investors had never expected a happy ending to the U.S.-Sino spat, which headlines have been forecasting. We also believe that small caps are gaining on the outlook for rising inflation—which hasn’t in fact yet happened—or a strengthening dollar.
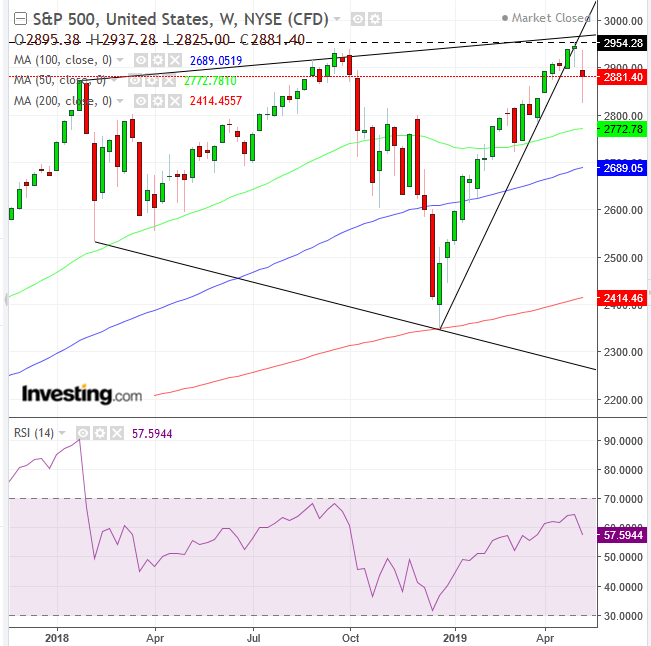
Technicals for the S&P—as well as the Dow, NASDAQ and Russell 2000—have all continued to weaken. The S&P benchmark fell below its short-term uptrend line since December and the RSI provided a second, consecutive, negative divergence, as momentum fell again even as prices notched fresh all-time highs.
Moreover, the trade since the beginning of 2018 has been forming a Broadening Pattern, showing higher highs on the one hand but lower lows on the other. This is bearish and appears at market tops. It demonstrates a market that's confused and scared and lacking a coherent strategy, in short, a total absence of leadership.
We recognize the lack of direction by the trend inconsistency. If business is weakening, as demonstrated by the S&P 500's low prices in early 2018 and at the beginning of 2019, then why is the benchmark also hitting new price highs, which occurred when they were rising between the beginning of 2018 to late October 2018, and then again from the start of 2019-April.
The Broadening Pattern is complete with a downside breakout. The trick is pinpointing a specific price as the lower limit, considering the falling angle of the lower boundary. Therefore, this pattern promises considerable volatility ahead, as fundamental investors change their minds regarding the geopolitics, economic data and earnings – and how they all intermingle, while technical traders chase trend lines.

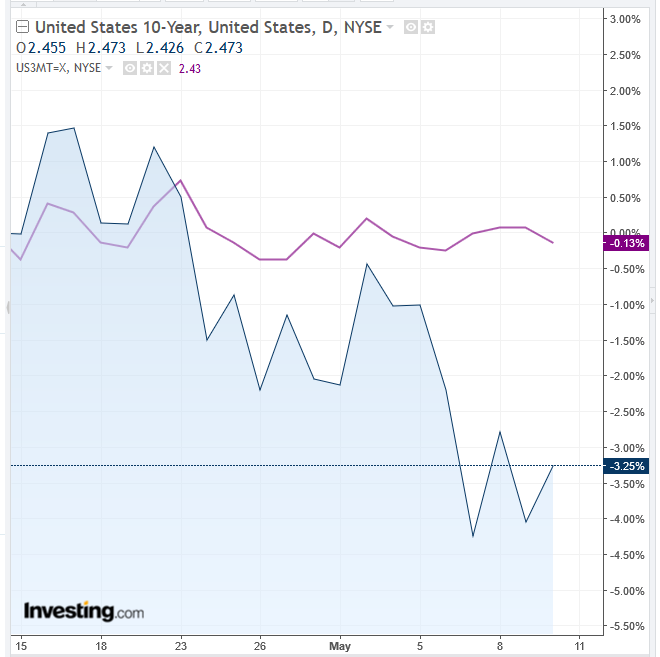
Another worry for investors is Thursday’s yield inversion. This is the second time this year the 3-month Treasury yield climbed above the 10-year yield.
While we expected a market decline—albeit much earlier and at a lower price level, we're not comfortable buying into any declines related to Friday's rally, due to the rash nature of the price action. Investors appear to be trading based on knee-jerk reactions.
Pricing in a trade resolution is premature, though it did create a much needed balancing-out of the market. However, relying on this one headwind, or its removal, for an ongoing, coherent market strategy isn't sustainable. The Fed’s ongoing inconsistencies aren't helping either.
The only thing that seems to be fundamentally reliable is hard economic data, which remains relatively strong, and company earnings, which have been phenomenal. Therefore, we consider all this short-term noise, at least in the very near-term. Should a bona fide technical reversal occur, we’ll let you know.
Week Ahead
All times listed are EDT
Monday
9:10: U.S. – FOMC Member Clarida Speaks: the Vice Chairman of the Fed, agrees that the trade war “has not had a big impact on the economy" and says that the Fed can’t ignore global risks.
9:10: U.S. – FOMC Member Rosengren Speaks: the President and CEO of the Boston Fed, expects a rate cut in the second half of the year.
Tuesday
4:30: U.K. – Average Earnings Index + Bonus: expected to edge lower, to 3.4% from 3.5% MoM.
4:30: U.K. – Claimant Count Change: expected to fall to 24.2K from 28.3K.
22:00: China – Industrial Production: likely to have fallen to 6.5% from 8.5%. This could potentially spur Trump to drive an even harder line on trade negotiations, considering the divergence between U.S. economic strength and the Chinese contraction, ahead of his 2020 reelection bid.
Wednesday
2:00: Germany – GDP: seen to have surged to 0.4% from 0.0% QoQ, while declining to 0.7% from 0.9% YoY.
8:30: U.S. – Core Retail Sales: forecast to have dropped to 0.7% from 1.2%; headline Retail Sales are expected to have plunged to 0.2% from 1.6%.
8:30: Canada – Core CPI: expected to have climbed to 1.8% from 1.6% YoY.
10:30: U.S. – Crude Oil Inventories: seen to surge to 2.984 million barrels from -3.963 million. The big margin allows for considerable room of error and for commensurate volatility to follow.
21:30: Australia – Employment Change: expected to have plunged to 15.2K from 25.7K in April, while the Participation Rate is expected to have remained flat 65.7%.
Thursday
8:30: U.S. – Building Permits: likely to have edged up to 1.290 million from 1.288 million.
8:30: U.S. – Philadelphia Fed Manufacturing Index: expected to have risen to 10.0 from 8.5
11:15: Canada – BOC Gov Poloz Speaks: he’s likely to talk about the fight for a mortgage market shakeup, even as the industry remains depressed since the 2008 financial crisis.
Friday
5:00: Eurozone – CPI: expected to remain steady at 1.7% YoY, while declining to 0.7% from 1.0 MoM.

