- US jobs report positive for equities, negative for dollar and yields
- US equities expected to rally in July and second half 2018
- S&P blew out bearish pattern; Dow Jones crossed back above 200 DMA
- WTI developing bullish pattern
Bullish investors will start the coming week with a resounding nod to keep on pushing higher from Friday's mixed jobs report—nonfarm payrolls increased but average hourly earnings disappointed. The release suggests the possibility of a slower pace to monetary tightening, in our view paving the way in July for heights yet unexplored.
The results boosted equities, while pulling yields and the dollar lower. All major US indices, including the S&P 500, Dow and NASDAQ finished the day and the week higher. Overall, the favorable employment report signals that the economy has been growing despite the negative sentiment surrounding an expanding trade war. Even more encouraging, we believe the positive equity market finish, both for the day and week, indicates a likely trajectory for the month and the second half of the year. We think investors are primed to boldly go where no one has gone before. Here's why:
It’s the Economy Stupid
The addition of 213,000 new jobs in June, which beat the 195,000 estimate, is the third strongest showing of the year, for a total of 1.3 million jobs added since the start of 2018. That's a 15-percent acceleration of the 1.1 million jobs in the preceding six-month period. And while unemployment rose to 4 percent, slightly higher than the previous reading, it's still the lowest since 1969. An increase this minimal, off a near-50-year-low remains an obvious sign of improving job prospects. Wages rose 2.7 percent YoY, increasing from last year’s 2.4 percent mark.
June’s report provides hard proof that the US economy is improving. It also offers a positive outlook for additional economic expansion since more jobs and higher wages would support consumer spending, which makes up the lion’s share of the US GDP, a necessary component for yet more growth.
As for investor bullishness, even after the fear of tariffs materialized, time and again demand continued to support prices within uptrends. The favorable employment report indicates that despite the negative sentiment of an escalating trade war, the economy still keeps growing. By pushing stocks higher, investors continue to demonstrate that they don't believe a full-fledged trade war will end economic growth but instead view it as a negotiating strategy, a way for the US president to strengthen his hand.
Market Internals Almost All Green
The S&P 500 advanced on Friday, up 0.85 percent, with all 11 sectors in the green, led by Healthcare (+1.44 percent) after biotech shares drove gains following a report that Biogen's (NASDAQ:BIIB) Alzheimer’s drug showed positive results in a large clinical trial. The strong finish boosted the leading benchmark to a 1.52 percent gain on the week, led once again by Healthcare (+3.06 percent), though Energy (-0.36 percent) finished the week in the red, following volatile oil prices down.
The Dow Jones Industrial Average climbed 0.4 percent on Friday, ending the week 0.85 percent higher, halting a three-week slump. The NASDAQ Composite jumped 1.35 percent Friday, gaining 2.4 percent for the week. It's now within 1.5 percent from its all-time-high two weeks ago.
The Russell 2000 outperformed, surging 0.85 percent, for the fourth straight day, to a 3.14 percent advance, to 0.8 percent from its highest price on record, the week before last.
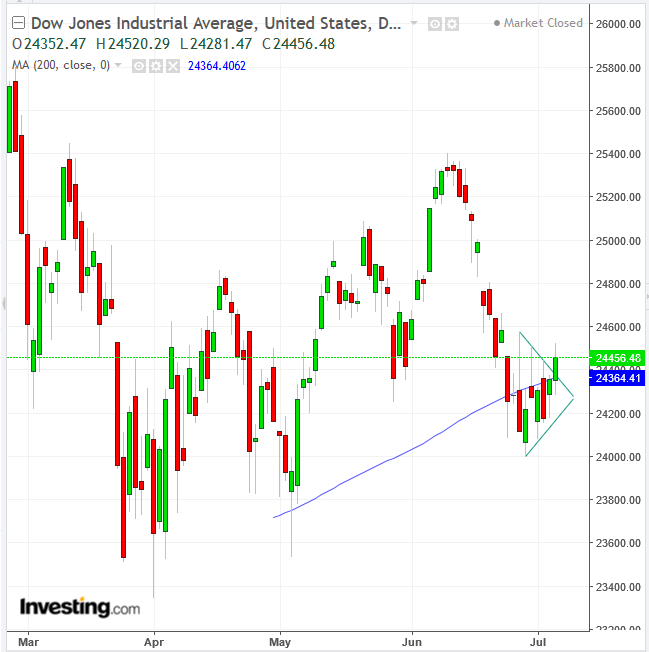
From a technical perspective, the S&P 500 Index blew out a bearish pennant, trading entirely above the negative pattern on Friday. Even the Dow Jones—the major index underperformer during a trade war, because its multinational mega cap companies rely on exports for growth—closed above a bearish pennant, as well as back above the 200 DMA for the first time after nine sessions.
Bulls have trampled all of the bears' red lines, suggesting the path is now clear for another charge higher.
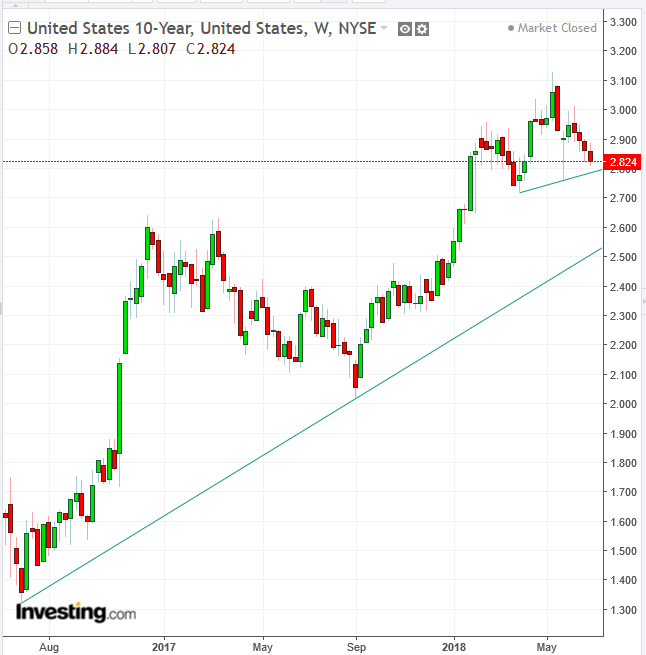
While the nonfarm payrolls report buoyed equities, the release weighed on yields, including the 10-year Treasury, as the wages component missed estimates, the second time in a row. Average hourly earnings were up just 2.7 percent year-over-year, one-tenth of a percentage point below expectations.
This offers another example of the different perspectives held by equity traders versus bond traders: equity traders focused on the positive side of the report, the higher YoY number; bond traders paid attention to the lower-than-expected result. The slower outlook for interest rate hikes increased demand for long-term bonds at the current rates, dragging yields down.
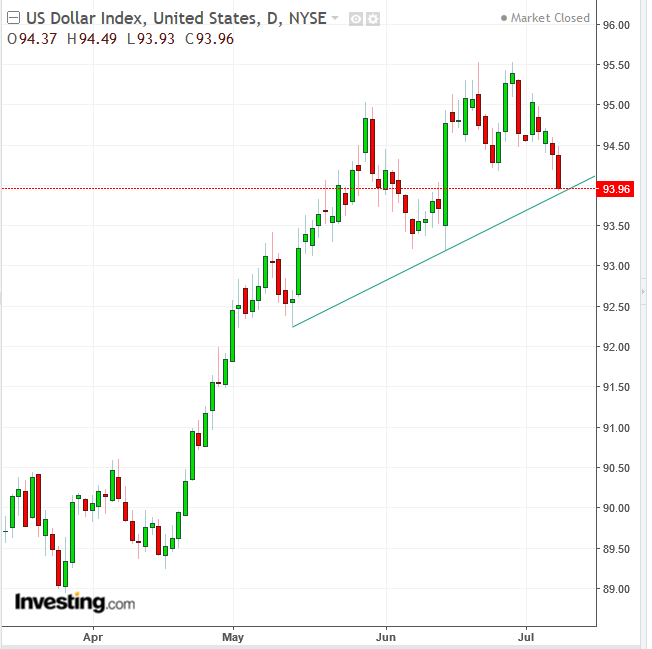
The lower outlook for rates weighed on the greenback, which found support—for now—by an uptrend line since mid-May.
Week Ahead
All times listed are EDT
Monday
2:00: Germany – Trade Balance (May): surplus expected to rise to €21.2 billion from €20.4 billion
21:30: Australia – NAB Business Confidence (June): index expected to rise to 9 from 6.
21:30: China – CPI (June): expected to be 1.9% YoY and -0.1% MoM, from 1.8% and -0.2% respectively.
Tuesday
4:30: UK – Trade Balance (May): deficit forecast to narrow to £1.2 billion from £5.3 billion.
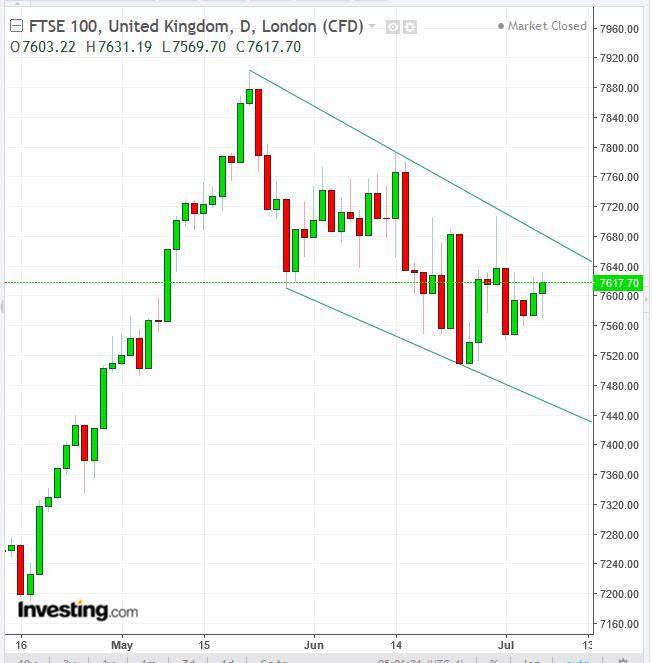
The FTSE 100 has been trading within a falling channel. An upside surprise may knock it off its downward trajectory. Otherwise, it is expected to continue with its trend lower.
5:00: Germany – ZEW Economic Sentiment (July): forecast to rise to -14 from -16.1
20:30: Australia – Westpac Consumer Confidence (July): index forecast to fall to 100 from 102.2.
Wednesday
8:30: US – PPI (June): forecast to be 0.1% from 0.5% MoM, while core PPI falls to 0.2% from 0.3%.
10:00: Canada – BoC Rate Decision: rates expected to remain at 1.25%.
10:30: US – EIA Crude Inventories (w/e 6 July): stockpiles expected to fall by 230,000 barrels from a 1.5 million barrel drop a week earlier.
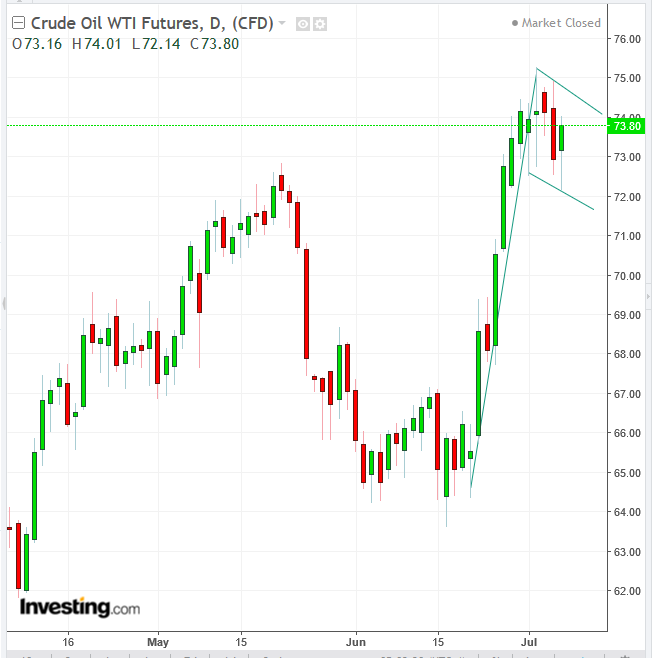
The price of oil is trading within a bullish, falling flag. An upside breakout would suggest the resumption of the underlying uptrend since June 21 when the price was at $64.
Thursday
5:00: Eurozone – Industrial Production (May): expected to be 2.8% YoY and 0.8% MoM, from 1.7% and -0.9% respectively.
8:30: US – CPI (June), Initial Jobless Claims (w/e 7 July): headline CPI to be 2.9% YoY and 0.2% MoM, from 2.8% and 0.2% respectively. Core CPI to be 0.2% MoM and 2.3% YoY, from 0.2% and 2.2% respectively. Initial jobless claims to fall to 227,000 for the week, from 231,000 a week earlier
11:00: China – Trade Balance (June): exports expected to rise 10.3% from 12.6% YoY.
Friday
10:00: US – Michigan Consumer Confidence Index (July, preliminary): forecast to fall to 98.1 from 98.2.
