- Russell 2000 posts third straight record, suggesting trade still key
- NASDAQ finishes week less than half-percent from March record
- SPX tech sector hits new record
- S&P advances for the week, Dow declines
- NFP beat boosts dollar
- Oil hits lowest point since early April
- Record US production: two additional rigs have been added, bringing the total now to 861, the most since March 2015, for a boost during 8 out of 9 weeks.
- A Russian Energy Ministry official said that Russia might increase production within months if they decide to end the agreement with OPEC, and
- The dollar spiked as much as 0.5 percent after the Nonfarm Payroll release showed a beat of expectations, adding pressure to commodities prices.
Glass Half Full Or Half Empty?
On Friday—after a week in which the major US equity indices whipsawed on a daily basis, jumping between gains one day and losses the next, driven by geopolitics and trade war fears—the Russell 2000 posted its third straight record, closing up 0.88% on the day; the NASDAQ Composite closed less than half a percent off its March record, up 1.51% on the day; the S&P 500 advanced 0.5% on the week, up 1.08% on the final day of trade, while the Dow, which closed +0.90% on Friday down 0.5% for the week.
As well on Friday, the key Nonfarm Payrolls release for May, which came in at 223,000 jobs added to the economy, handily beat the 188,000 estimate.
Do the numbers tell us something about what the coming week's trajectory for US stocks might be, on the heels of the past week’s turbulent and uneven results? Should traders focus on the glass half full via the S&P's upbeat weekly advance or should they instead recognize that the glass may be half empty, after the Dow's retreat for the week?
While political instability in Europe, renewed tariffs and even the unexpectedly positive jobs report contributed to market choppiness, we believe the glass is half full and getting fuller.
Trade War Fears Increasing
Fundamentally, the US economy continues to chug along, as May’s employment report signals. In addition to jobs added, the unemployment rate fell to 3.8 percent, beating the expectation of 3.9 percent, for an 18-year low. Equally optimistic, the modest, 2.7 percent YoY average hourly earnings growth denotes a “Goldilocks Economy,” one that grows at a tempered and therefore sustainable pace, allowing the Fed to keep gradually raising rates while still supporting household spending.
Concerns that Italian political instability would spread to the rest of Europe and beyond have dissipated for now, after the country's new populist government was sworn in on Friday, ending the deadlock that had earlier hampered the formation of a new coalition and threatened the stability of the eurozone and its single currency.
The biggest fundamental fear as the new trading week begins remains the growing threat of a trade war, after the Trump administration implemented some of the previously announced tariffs on steel and aluminum imports from the EU, Canada and Mexico. Unanswered but critical questions for traders, such as whether ongoing negotiation might end the dispute and what kind of impact it would have on growth will likely drive the market narrative going forward.
Indeed, the fact that the Russell 2000—on which smaller, domestic-focused companies are listed—gained 1.3 percent on the week, plus hit fresh records three weeks running, is clear proof that trade and any uncertainty surrounding it now provides the strongest headwind for stocks. The small cap index also extended its rally for a fifth straight week, as it completed a continuation pattern.
Technically, the S&P 500 confirmed its long-term uptrend, when it bounced off the triangular consolidation since late January. As well, the Dow Jones Industrial Average did not slip back into a downtrend. Moreso, its 0.5 percent decline for week should still be viewed as bullish, considering it trimmed a much deeper, 2.00 percent plunge. The NASDAQ Composite closed with a second weekly gain, completing a bullish pattern.
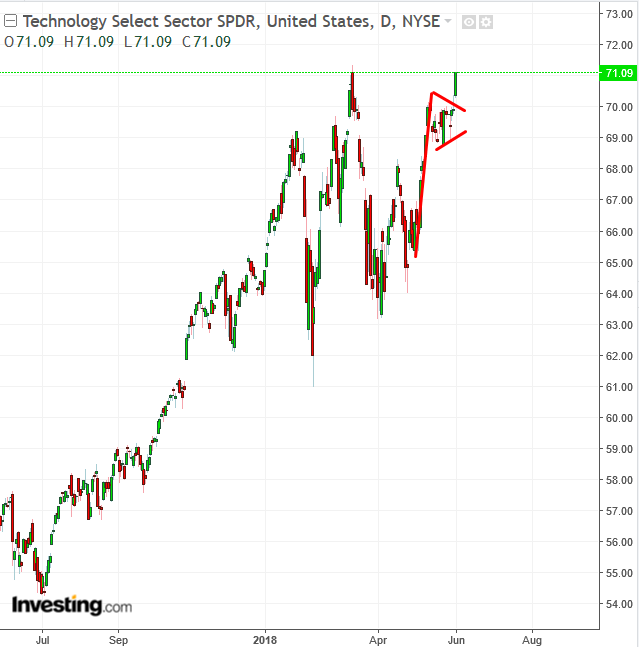
The Technology Select Sector SPDR (NYSE:XLK), which tracks the SPX's technology sector, posted its first record since March, after completing an upside breakout of a bullish falling flag. Might technology lead the broader market to new highs? Or will this turn into a double top reversal?
Based on recent consolidation breakouts, we continue to believe that post the first double-digit correction seen in early February, recent consolidative activity provides a buying dip. Still, volatility will remain a factor. Expect wild swings between gains and losses at the interim, both in reaction to twists and turns of the trade war, upside risk of rates and other geopolitical instability.
The Week Ahead
All times listed are EDT
Monday
4:30: UK – Construction PMI (May): expected to rise to 52.9 from 52.5
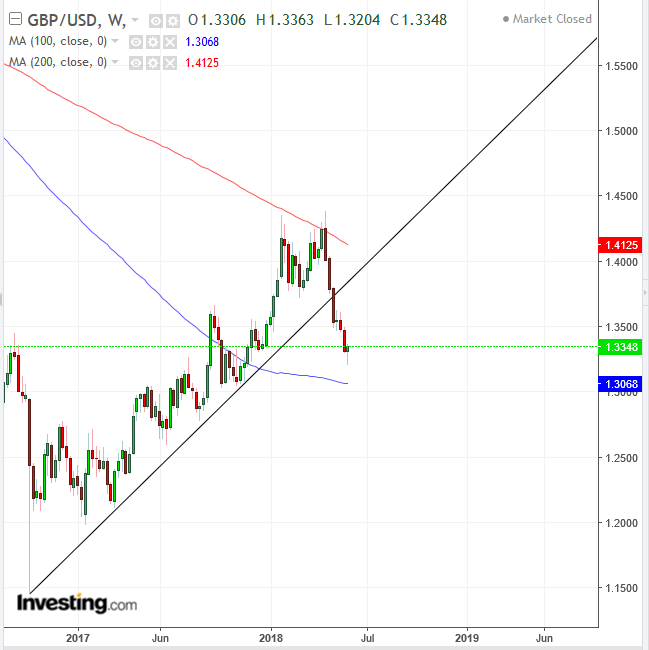
Last week, the pound provided its first bullish candle after 5 out of 6 weeks of declines, in which sterling lost 8 percent in value. After achieving most of the target from January-April's double top, and nearing the 100 DMA, it might be time for an upward correction. However, the trend remains down.
21:45: China – Caixin Services PMI (May): forecast to fall to 52.5 from 52.9.
Tuesday
12:30: Australia – RBA Rate Decision: no change in rates expected from current 1.5%.
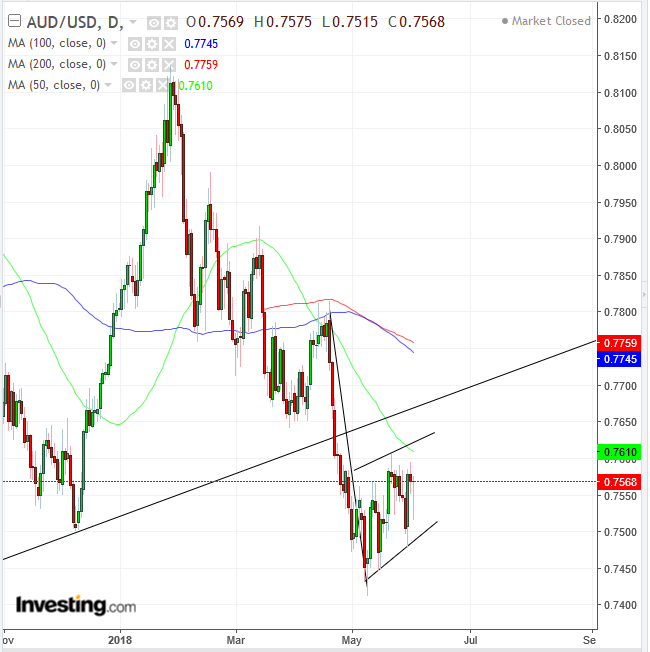
In late April, the Australian dollar crossed below its uptrend line since January 2016, following a Death Cross—when the 50 DMA (green) crossed below the 200 DMA (red)—signaling a trend reversal. Since early May the Aussie has been consolidating within a tight range with an upward bias, a bearish rising flag pattern, “guarded” by the 50 DMA, pressing prices downward.
All three major MAs are in a bearish pattern, in which the more recent data falls lower than longer sets of data. A downside breakout would signal that all demand has been absorbed and traders are ready to increase supply, pushing prices down toward the 0.7000 level.
4:30: UK – Services PMI (May): an increase to 53.5 from 52.8 is expected.
5:00: Eurozone – Retail Sales (April): forecast to rise 1.5% YoY from 0.8%.
10:00: US – ISM Non-Manufacturing PMI (May): expected to rise to 57.2 from 56.8
21:30: Australia – GDP (Q1): QoQ growth forecast to be 0.6% from 0.4%, while the YoY figure rises to 2.5% from 2.4%
Wednesday
8:30: US – Trade Balance (April): deficit forecast to widen to $51.3 billion from $49 billion.
10:30: US – EIA Crude Inventories (w/e 1 June): stockpiles expected to rise by 180,000 barrels after falling by 3.6 million a week earlier.
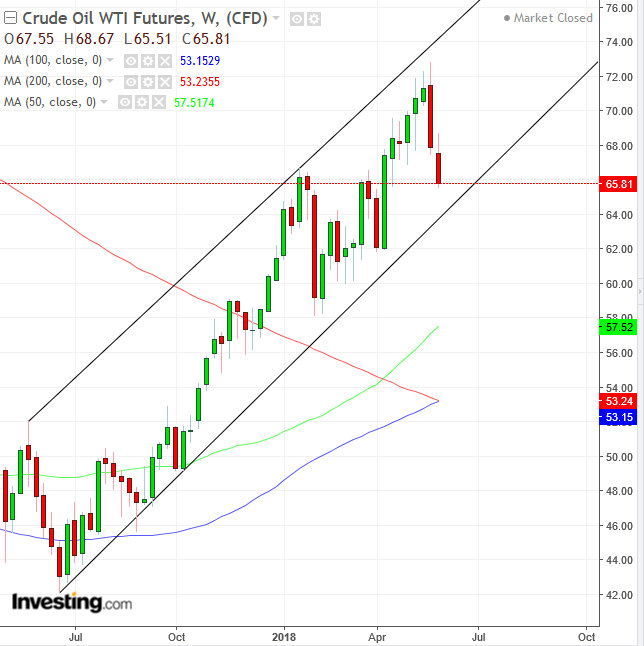
Oil dropped 3 percent last week, for a second weekly decline. Is this a dip-buying opportunity or a prelude to further declines?
The commodity is being pressured by three key fundamental factors:
Technically, the price of oil corrected within an uptrend line. After the 50 DMA (green) crossed above the 200 DMA (red) in April, executing a golden cross, the 100 DMA (blue) climbed up to the 200 DMA. Should it cross above it, putting all three major MAs in a bullish pattern, it would support continued rallies.
Thursday
5:00: Eurozone – GDP (Q1, 3rd estimate): QoQ growth expected to be 0.4% from 0.7%, and YoY 2.5% from 2.8%.
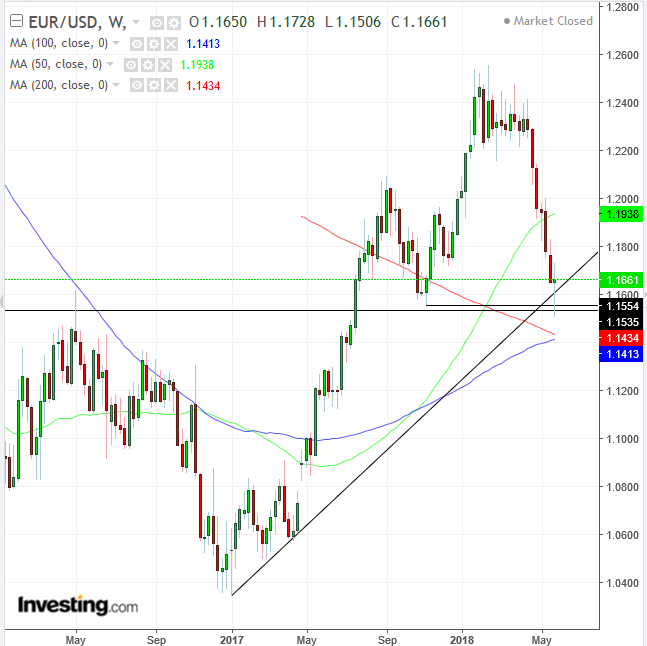
The dissipating concerns over Italian politics allowed the euro to trim further losses. It bounced back above the 1.1600 level, confirming the November 2017 support, after market psychology reversed a major resistance at that level, since February 2015.
8:30: US – Initial Jobless Claims (w/e 2nd June): expected to fall to 220K from 221K.
21:50: Japan – GDP (Q1, final estimate): -0.2% QoQ and 0.9% YoY expected
23:00: China – Trade Balance (May): surplus forecast to widen to $31 billion from $28.8 billion.
Friday
2:00: Germany – Trade Balance (April): surplus to narrow to €18.7 billion from €25.2 billion.
8:30: Canada – Employment Change (May): 6000 jobs forecast to have been lost, from a 1100 drop a month earlier. Unemployment rate expected to increase to 5.9% from 5.8%
