- On Friday, US stocks fell on threats of war; on Saturday, one threat materialized
- Since Brexit vote, equity investors have continuously shrugged off geopolitical risk
- On Sunday, Middle East equity markets were bullish
- Oil risk to the upside, as tension mounts among largest producers
- RBA warns investors are not pricing in inflationary risk
After a rocky week in which the S&P 500 nevertheless gained 1.99 percent, Friday was a total bust. The most widely referenced US benchmark retreated 0.29 percent for the day, dragged down by Financials, which lost 1.51 percent in value. If not for the fact that Energy shares outperformed, increasing 1.10 percent in value, the index would have suffered even greater losses. If William Shakespeare were an analyst today, his forecast for US markets—all major indices fell on Friday, including the Dow (- 0.50%), NASDAQ (- 0.47%) and Russell 2000 (- 0.50%)—would hardly be all’s well that ends well. Indeed, last week's final day of market action did not end well.
That may seem counter-intuitive. After all, the SPX gained a shade under 2.00 percent over the preceding five trading days, thus a bullish week. However, traders were not willing to stay exposed over a weekend, signaling a lack of confidence. With multiple domestic and geopolitical risks hovering on the horizon, who can blame them?

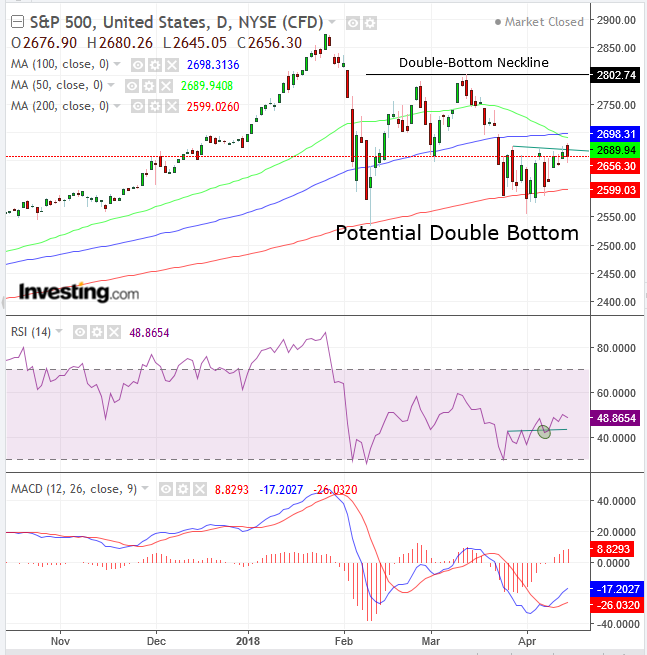
What clues can we glean from the supply-demand balance, expressed in the S&P 500 price action? The small H&S bottom on the four-hour chart (here, on the daily chart) has failed to break out.
It penetrated the neckline 0.42 percent but ultimately closed lower and below the neckline. The 50 dma (green) crossed below the 100 dma (blue), showing recent price data is weakening compared to older data, and both are right above the price, providing resistance, for good measure.
The much-talked about 200 dma (red) gave traders a scare almost two weeks ago, when the price closed below it for the first time since the initial shock brought on by the aftermath of the Brexit vote, in mid June 2016. That's at the lower boundary of the 3-week range.
On the other hand, both the MACD and the RSI suggest the price will continue to rise, completing the bottom. Should that in fact follow through, the 2,800 level comes into play; should that price penetrate, we’re looking at a march larger, double-bottom, that would render the price action since early February a base to take on the late January record and beyond.
Rising Domestic and Geopolitical Risks
The list of headline risks keeps growing. Right now they include the myriad legal issues, both political and personal, swirling around President Donald Trump’s administration, including unpresidential attacks on former FBI director James Comey in response to Comey’s references to Trump as a 'mob boss' in his new book; ongoing trade tensions between the US and China and military activity in Syria—current and potentially future action.
While Friday’s risk-off mood permeated investor sentiment on threats alone since the news of the attack didn't hit the wires till Saturday, the US and allies Britain and France carried out Trump’s threat and executed an air strike on what was characterized as the 'heart of Syria's chemical weapons program'. And it may not be over. The US president warned Syria that the US is 'locked and loaded' to strike again if Assad’s regime carries out any further chemical attacks.
As if that weren't enough, investor uncertainty extended yet further. Wells Fargo (NYSE:WFC), JPMorgan Chase (JPM) and Citigroup (NYSE:C), all reported earnings on Friday and each beat expectations, but their uncertain forward guidance was enough to lead to a broader market selloff.
How much worse might things get if US military involvement in the Middle East expands? That depends on your time frame. While stocks have historically sold off immediately after a military strike or terrorist attack, they generally bounce back relatively quickly.
Moreover, we have often pointed out that since the Brexit vote in mid-2016, equity investors have been shrugging off geopolitical risk. Markets sold off after the Brexit vote for all of three days, before the rebound began. The initial shock of Trump’s victory in November 2016 lasted all of 3 hours before investor optimism came back with a vengence. By the time of the December 2016 Italian Referendum, EU markets unraveled for all of 3 minutes.
Mid-East Markets Signaling No Fear?
Given these recent precedents, it's impossible to tell how far stocks will sell off on what's perceived as negative news, before they rebound. As such, for long-term investors, doing nothing is a no-brainer.
For short-term traders, it’s trickier. Most vexing, the strike occurred on the weekend, when investors are stuck and can’t do anything about it. Or was that the point?
Of course, it's difficult to predict how markets will handle all this come Monday. However, there's an interesting 'tell' available today that could possibly presage tomorrow's open.
Since Friday is a Muslim prayer day, markets in Middle Eastern countries are open Sunday to Thursday. According to a Bloomberg article published earlier today, the tension is already priced in. The airstrike in Syria hasn't been a cause for panic in Mid-East markets, analysts say, perhaps because geopolitical risk has always been a given. Instead, investors there are corporate-result oriented.
Indeed, Middle Eastern stocks are particularly bullish. Dubai’s main equity index, the DFM General, climbed the most since July; 98 percent of companies listed on Saudi Arabia’s Tadawul also rose. Stocks in Abu Dhabi climbed as much as 1.3 percent, sending the ADX General to the highest level on a closing basis since August 2015.
Considering these markets are in the same region where the conflict is located, and they continue to surge, global markets located on other continents should be at ease. Having said that, investors are famously fickle, so anything could happen tomorrow.

Bitcoin received a back-handed endorsement of sorts from Economics Nobel Laureate Robert Shiller, who told CNBC that the bubble for the most popular cryptocurrency could keep inflating. The Yale professor considers virtual coins “…another example of faddish human behavior,” akin to the 17th century tulip mania that gripped Dutch markets, when the value of individual bulbs inflated to proportions that had nothing to do with the value of the asset before collapsing in February 1637.
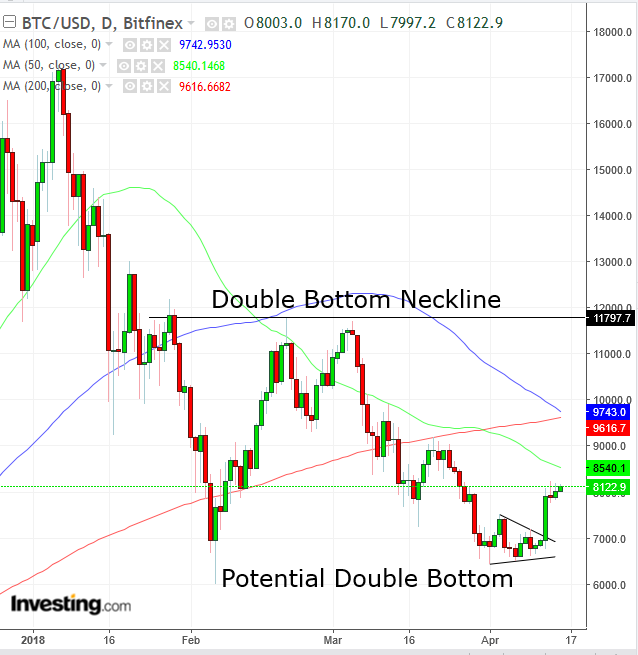
The interview came after Bitcoin had one of its best days in 2018, blowing out a bearish pennant, but still within a downtrend. However, like with the S&P 500, the pennant blowout might become a base and the second element of a double bottom. A decisive penetration of the $12,000 level would complete the pattern.
Key Economic Events
All times listed are EDT
Monday
8:30: US – Retail Sales (March): forecast to rise 0.4% MoM from a 0.1% drop.
21:30: Australia – RBA Minutes
The RBA warned in its Financial Stability Review, released Friday morning, that a sharp rise in interest rates provoked by rising inflation may catch risk-seeking investors who have not priced in any risk, leading to a disruptive and lasting correction.

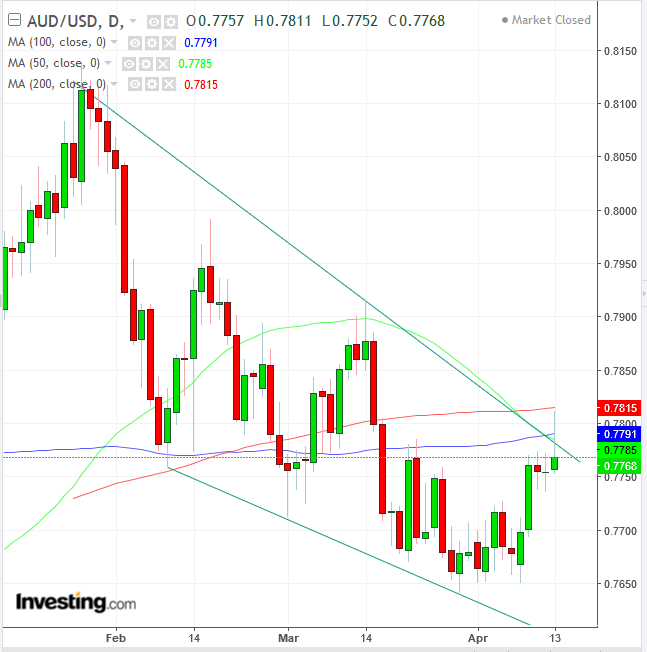
The AUDUSD pair has been trading within a descending channel, demonstrating that demand has been weakening. On Friday, bulls attempted to break out of this falling trend but were knocked back into the channel, forming a very bearish shooting star, with an extremely long upper shadow.
The fact that this happened at the upper range of the falling channel doubles the shooting star’s bearishness. The fact that it happened both upon attempting the breach the 100 dma (blue) and 200 dma (red) triples that ominous forecast. The fact that that 50 dma (green) just formed a Death Cross, falling below both the 100 dma and 200 dma quadruples the negative outlook.
22:00: China – GDP (Q1), Retail Sales (March): expected to be 1.5% QoQ and 6.8% YoY, from `1.6% and 6.8%. Retail sales forecast to remain flat at 9.7% MoM.
22:00: China – Industrial Production (YoY) (Mar): forecast to drop to 6.4 percent from 7.2 percent.
Tuesday
4:30: UK – Employment data: Claimant count for March forecast to surge to 13.3K from a rise of 9.2K. Unemployment rate forecast to remain at 4.3%, while February average earnings (including bonus) is expected to rise 2.8% from 2.6%.
5:00: Germany – ZEW Index (April): economic sentiment forecast to drop to -0.8 from 5.1.
8:30: US – Housing Starts and Building Permits (March): housing starts expected to rise 1.9% MoM from a 7% drop, and permits to rise 1.330M from 1.321M..
19:50: Japan – Trade Balance (March): expected to see to jump to 498B from 3B.
Wednesday
4:30: UK – CPI (March): forecast to remain at 2.7% YoY and to fall to 0.3% MoM, from 0.4%. Core CPI to rise 2.5% from 2.4%.
10:00: Canada – Bank of Canada Rate Decision: no change in policy expected.
10:30 – US EIA Crude Stockpiles (w/e 13 April): stockpiles expected to fall by 30,000 barrels.
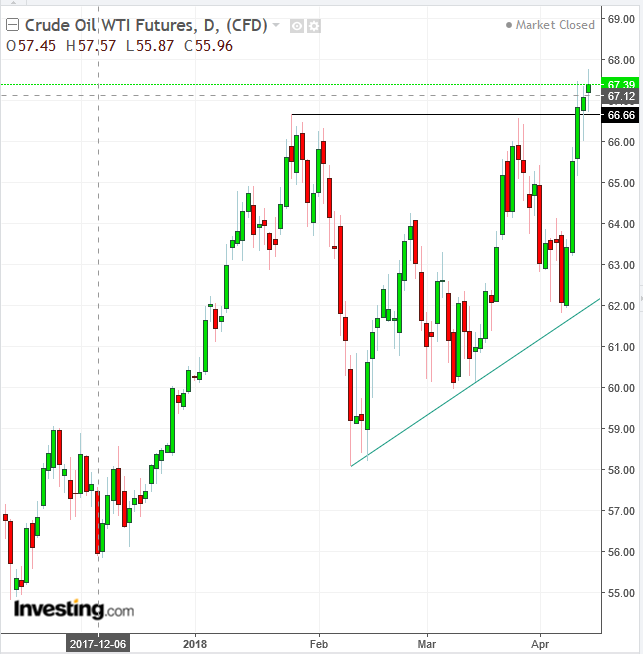
Tension in the Middle East is very bullish for the oil market. Unlike equity investors, oil contract traders are extremely sensitive to geopolitical risk, and this one is on the upside. If the threat of an attack alone boosted the price of the commodity to its biggest weekly gain in more than eight months, how would investors react to an actual attack?
It’s noteworthy, that Russia—protector of the Syria's Assad regime—is the world’s third biggest oil producer, increasing the potential for production disruption in a drawn-out conflict. On top of that, Saudi Arabia, the world’s second largest producer of oil is locking horns with Iran, the world’s fifth largest producer, contributing to a a real complex mess for upside risk.

The price of WTI crude has completed an ascending triangle, signaling that oil is headed higher.
21:30: Australia – Employment Data (March): 20K jobs forecast to have been created, from 17.5K in February, while the unemployment rate is expected to fall to 5.5% from 5.6%.
Thursday
4:30: UK – Retail Sales (March): forecast to rise 0.4% MoM and 1.2% YoY, from 0.6% and 1.1% respectively (excluding fuel).
8:30: US – Philadelphia Fed Manufacturing Index (April): expected to be 20.9 from 22.3
19:30: Japan – CPI (March): forecast to be 1.5% YoY from 1.5%. Core CPI to be 1%, in line with last month.
Friday
8:30: Canada – CPI (March): expected to be 0.5% MoM and 2% YoY from 0.6% and 2.2% respectively. Core CPI to be 1.4%, from 1.5% YoY.
10:00: Eurozone – Consumer Confidence (April, flash): expected to be -0.6 from 0.1.
