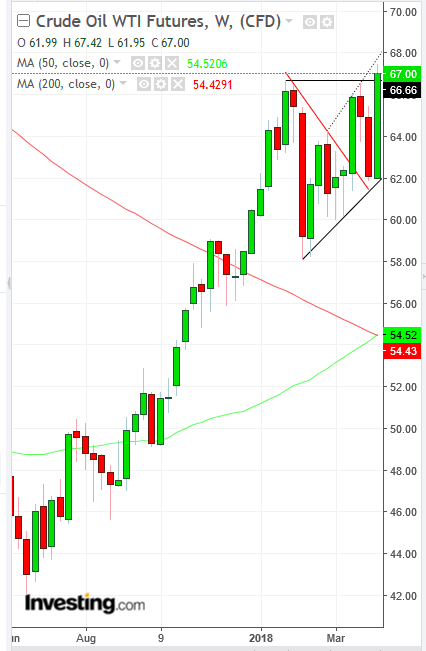
Three weeks ago we forecast that oil would advance from under $64 and may be heading toward $70 a barrel. The main fundamental drive was the rising tension between Saudi Arabia and Iran on the latter’s nuclear ambitions. The Kingdom threatened to build a nuclear arsenal if Iran insisted on its own nuclear trajectory.
The main technical trigger was the completion of a symmetrical triangle pattern, bullish in an uptrend.

However, yesterday, the price of crude completed an ascending triangle. A symmetrical triangle, per its name, demonstrates equivalent determination by bulls and bears; the only reason this one was bullish is that it followed an uptrend, presumed to be in effect, until a reversal.
An ascending triangle, on the other hand, is innately bullish, as its triangle reveals a dynamic in which bulls’ eagerness overcomes the bears' determination. This is clear when noting that bulls have been willing to pay increasingly higher prices since the pattern’s emergence, in mid-February, mid-March and finally early April. The bears during this period were willing to sell at the $66 level.
Additionally, the 50-week MA just crossed above the 200-week MA, providing a major golden-cross.
However, considering the upper-boundary penetration, yesterday’s high was only 1.12 percent above the triangle-top. While this satisfies an aggressive 1 percent filter to avoid bull-traps, it doesn’t satisfy more stringent requirements. Therefore, yesterday’s rise may prove to be a false breakout.
Today’s doji, after a three-day advance may suggest buyers are exhausted, which may be followed by bears hitting while bulls take profit. However, at the end of the day, the three substantial advances formed a Three White Soldiers pattern which demonstrates a sustained rally. Also, irrespective of triangles, this week’s 7.7 percent gain extended a rising channel since February.
Finally, even if prices will not fall back into the triangle, expect a return-move which occurs in roughly two out of three breakouts.
Trading Strategies
Conservative traders would wait on a long position, either for a more decisive upside breakout or a downward correction to the rising channel bottom.
- A reliable upside breakout would include at least a 3 percent upward move. Then, they’d probably wait for a return move to avoid being whipsawed. Finally, they’d want to see that the pattern provides a support. This is demonstrated when the price consolidates above the pattern, creating a base, with at least one green candle’s real body enveloping a previous session’s red candle’s real body.
- A downward correction to the rising channel bottom would mean a move to $62. Then, they might want to wait for evidence of support, as described above.
Moderate traders may wait for a 2 percent upside breakout or a return to the rising channel.
Aggressive traders may rely on the 1 percent penetration and go long now.
Very aggressive traders my enter a contrarian short trade, with a close stop-loss below the $66 upper boundary in the event of a fake-out, before entering a long-position.
