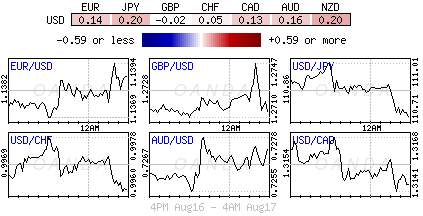
Friday August 17: Five things the markets are talking about
Global trade worries have not disappeared, they are just on hiatus, as market participants prefer to regroup and strategize in this unorthodox U.S trade and foreign policy environment.
Emerging market worries are not going away any time soon. They continue to straddle in bear market territory. U.S Treasury Secretary Mnuchin stated Thursday that Turkey would face more sanctions if the country did not release a detained American pastor and coupled with a weeklong Turkish public holiday, beginning Monday, should provide further EM market volatility.
For now, the possibility of a Sino-U.S trade deal has brought some calm to the market, but trade and currency wars remain to the fore.
Euro equities opened in the ‘black,’ but trade under pressure, after Asian bourses closed out a volatile week on a positive note. Both the US dollar and Treasuries trade steady.
For the Loonie (C$1.3136), following a relatively quiet week on the data front, this morning’s inflation numbers (08:30 am EDT) should provide some direction, though actual will need to be better than forecast for the CAD to get support.
After last Friday’s employment numbers where Canada added a net +54.1K jobs in July on a seasonally adjusted basis and an unemployment rate ticking down to +5.8% adds to the probability that the Bank of Canada (BoC) will hike the benchmark interest rate one more time in 2018.
Don’t expect the BoC to stray too far away from the Fed’s rate normalization plan. Include any positives on Nafta and like the Mexican peso, the loonie will roll.
1. Asian shares gain on Sino-U.S trade talks
In Japan, the Nikkei rallied overnight on hopes that talk between China and the U.S next week (Aug 21 & 22) would ease trade tensions. The Nikkei share average ended +0.4% higher, while the broader Topix added +0.6%.
Note: The two largest economies are due to implement tariffs on billions of dollars of each other’s goods on Aug. 23, in addition to taxes that took effect on July 6.
Down-under, Aussie shares rallied overnight, supported by financials and stronger earnings. The S&P/ASX 200 index closed +0.2% higher. The benchmark closed unchanged on Thursday and recorded a weekly gain of about +1%. In S. Korea, the Kospi stock index ended higher on China-U.S trade talk news. The Kospi was up +0.28%. For the week, the benchmark index tumbled -1.6%, marking its biggest weekly loss since five-weeks.
In China, shanghai stocks closed of their 31-month low overnight, dragged down by a slump in healthcare firms amid vaccine scandal fallout. The blue-chip CSI300 index ended -1.5% down at 3,229.62 points, while the Shanghai Composite Index closed down -1.3%. In Hong Kong, the Hang Seng Index, down for a fifth consecutive session Thursday, gained +0.42% as tech stocks recovered.
In Europe, regional bourses trade sideways, however, the potential of renewed Sino-U.S talks is helping risk sentiment going into the weekend, but the treat of further Turkey sanctions will sour investor risk appetite.
U.S stocks are set to open unchanged (+0.0%).
Indices: Stoxx50 -0.1% at 3,379, FTSE flat at 7,555, DAX -0.1% at 12,226, CAC 40 +0.2% at 5,357; IBEX 35 -0.1% at 9,419, FTSE MIB -0.5% at 20,421, SMI +0.2% at 9,017, S&P 500 Futures flat
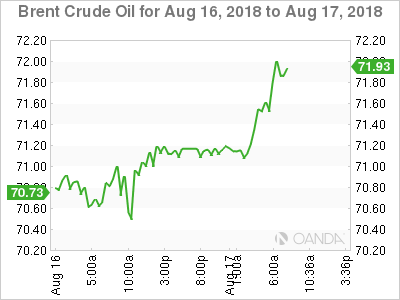
2. Oil prices slip on global economic worries
Oil prices have eased a tad in overnight trading, with U.S crude heading for a seventh-weekly decline amid market concerns about slowing global growth that could hit demand as U.S inventories build.
Brent crude oil is down -9c at +$71.34 a barrel, while U.S West Texas Intermediate (WTI) crude has fallen -5c to +$65.41 a barrel.
Note: Brent is heading for a -2% decline this week, a third consecutive weekly drop, while WTI is on track for a seventh week of losses, with a fall of more than -3%.
EIA data this week showed that output of U.S crude rose by +100K bpd in the week ending Aug. 10, to +10.9M bpd. At the same time, U.S crude inventories climbed by +6.8M barrels, to +414.19M barrels.
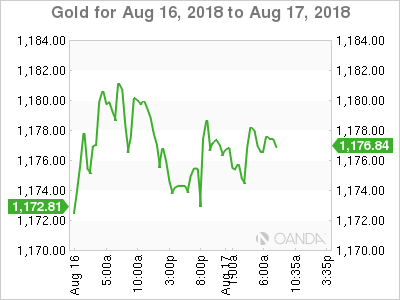
Ahead of the U.S open, gold prices are small better bid, nevertheless, the yellow metal is set for its biggest weekly fall in 15-months.
Spot gold is up +0.1% at +$1,175.22 an ounce, while U.S gold futures are down -0.2% at +$1,181.30 an ounce.
For the week, spot gold has shed -2.9%, its sixth consecutive weekly decline. It hit its lowest since January 2017 at +$1,159.96 yesterday on some aggressive stop-loss selling.
3. CBRT average cost of funding to rise to rise
The Central Bank of the Republic of Turkey (CBRT) cost of funding will rise to +19.25% today, from +18.14% on Thursday, after the bank did not open a repo auction for the second consecutive day.
The current weekly repo rate is at +17.75%, but the CBRT has decided not to fund the market at that rate due to “unhealthy price formations and excessive fluctuations in the market” during this currency crisis that has seen the TRY crash to a record low ($7.24).
In a speech overnight down-under, RBA Governor Lowe indicated that the domestic economy is moving in the right direction. He reiterated the view that he expected the next move in interest rates is to be up, but the board’s view is likely to hold rates steady for a while yet. The most likely trigger for a rate cut would be ‘China shock’ and he still believed that a lower AUD (A$0.7263) would be helpful.
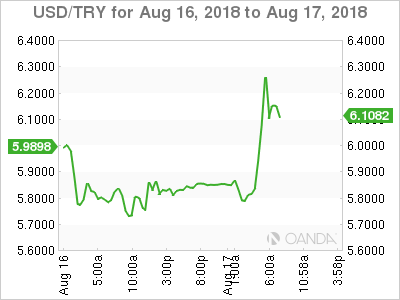
4. USD/TRY – TRY rally halted
The USD was a tad softer overnight vs. the Turkish lira, but that fall has since halted ahead of the U.S open (+$6.3056 up +8%) on fear of further U.S sanctions to be imposed on Turkey. Other EM currencies (ZAR, RUB, IDR and INR) are again under pressure.
The Turkish government announced a number of measures yesterday – will curb FX funding, will review Turkey’s investment portfolio and will not compromise fiscal discipline. Are these short-term fixes?
Turkey is preparing for a week-long public holiday beginning mid-day Monday.
Note: TRY plunged to a record low of $7.24 at the beginning of the week as a worsening of relations between Turkey and the U.S added to losses driven by concerns over President Erdogan’s influence over the CBRT.
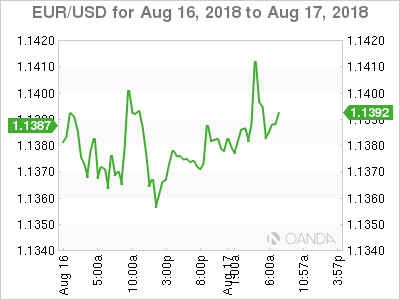
The EUR/USD (€1.1382) is slightly higher in the session and hovers within striking distance of the psychological €1.14 level, supported by this morning’s Eurozone July final CPI reading (see below).
China guided the yuan +0.1% stronger outright after a string of lower fixes. The PBoC put today’s reference rate at ¥6.8894, vs. ¥6.8946 on Thursday. The yuan rose as much as +0.4% yesterday before ending at ¥6.8960. Expect the U.S to pressure China to lift the yuan at next week’s talks.
5. Eurozone July final CPI stays above the ECB target
Data from Eurostat this morning showed that the eurozone annual inflation rate was +2.1% in July 2018, up from +2.0% in June 2018. A year earlier, the rate was +1.3%.
E.U annual inflation was +2.2% in July 2018, up from +2.1% in June. A year earlier, the rate was +1.5%.
The lowest annual rates were registered in Greece (0.8%), Denmark (0.9%) and Ireland (1.0%). The highest annual rates were recorded in Romania (4.3%), Bulgaria (3.6%), Hungary (3.4%) and Estonia (3.3%).
