AT40 = 55.2% of stocks are trading above their respective 40-day moving averages (DMAs)
AT200 = 46.4% of stocks are trading above their respective 200DMAs
VIX = 16.9
Short-term Trading Call: cautiously bearish
Commentary
The stock market faded from bullish overtones and back into the resting position. Now we can just look back at what could have been.
For the first time in a long time, I feel compelled to change my short-term trading call from neutral. While the S&P 500 (SPDR S&P 500 (NYSE:SPY)) still sits well within a trading range of churn, I see several signals which give me bearish vibes starting with my favorite technical indicator: AT40 (T2108), the percentage of stocks trading above their respective 40-day moving averages (DMAs).
Through Wednesday, April 18th, AT40 rallied relatively consistently with 9 up days out of 12 trading days. The last two up days featured weakening momentum and the top, an intraday high of 67.6%, came just short of the overbought threshold of 70%. I typically interpret a rejection at the overbought threshold as a bearish event. I am particularly keen to follow this interpretation given a similar rejection preceded the big February sell-off, and I was very slow to react to that rejection. AT40 swiftly fell all the way back to 55.2% to close the week. I am now eager to see AT40 hold a higher low.
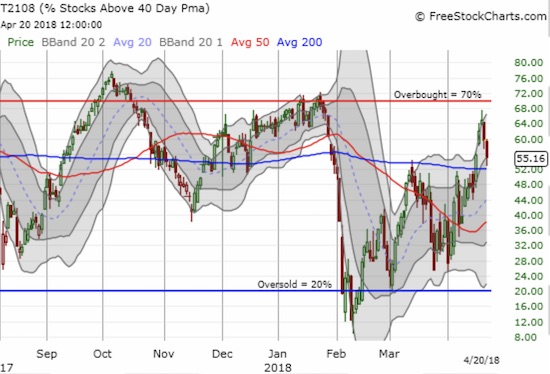
AT40 (T2108) experienced a sharp rejection just under the overbought threshold of 70%. Can it hold a higher low o this pullback?
The S&P 500 (SPY) provided one component of a bearish confirmation. At its last high, the index closed just about even with its close after the Fed’s last decision on monetary policy. Not only did the index fail to maintain momentum from there, but also the subsequent selling pushed the S&P 500 right back below its 50DMA. The NASDAQ and the PowerShares QQQ Trust Series 1 (NASDAQ:QQQ) both pulled up short of their post-Fed closes before dipping below their 50DMAs to the end the week.
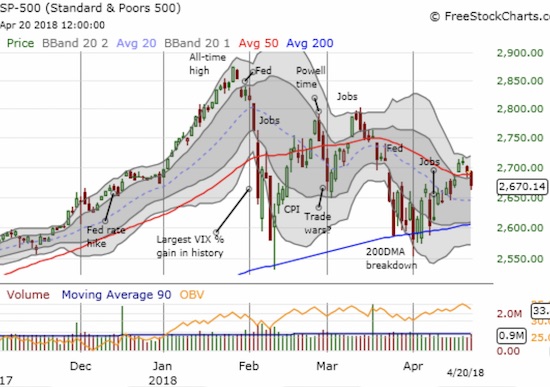
The last bounce of 200DMA support finally ran out of gas for the S&P 500 (SPY). Now the index is fighting yet another 50DMA breakdown.
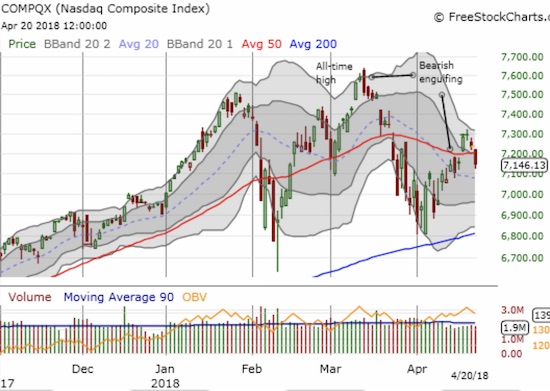
The NASDAQ followed the S&P 500’s lead in drooping below its 50DMA.
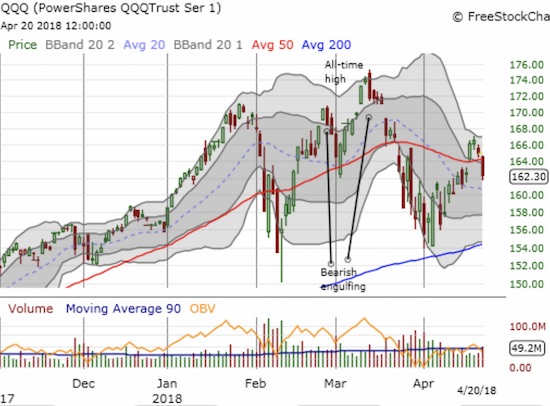
The PowerShares QQQ ETF (QQQ) broke back down below its 50DMA as it too ran out of gas.
The volatility index, the VIX, might as well have sealed the deal. Last week, the VIX traded right down to the 15.35 pivot and convincingly held that level as support over the next 3 trading days. While the VIX did not pop as much as I would have expected, I am still respecting this hold of support. I am staying patient before shorting the iPath S&P 500 VIX Short-Term Futures Exp 30 Jan 2019 (NYSE:VXX) again, and I am holding onto call options on the ProShares Ultra VIX Short-Term Futures (NYSE:UVXY).
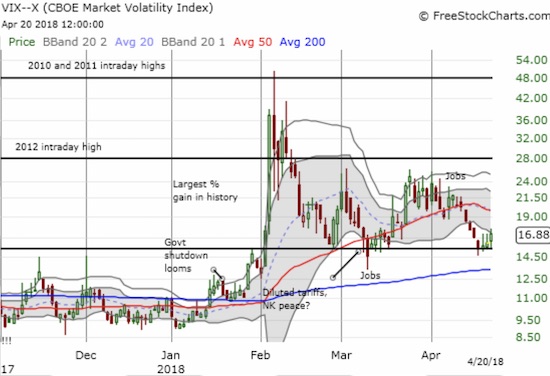
The 15.35 pivot works like magic again on the VIX – this time as support.
The Australian dollar (NYSE:FXA) versus the Japanese yen (NYSE:FXY) provided one more piece to the puzzle by breaking down below its 50DMA again. Just a week ago, AUD/JPY looked like it was leading financial markets higher. Now it looks set to grease the skids pointing downward.
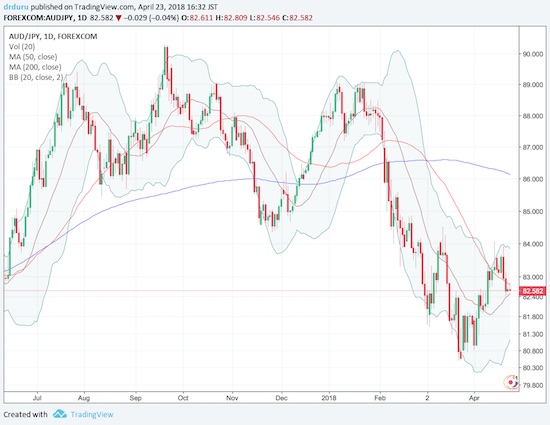
A sharp reversal for AUD/JPY seems to confirm the change in sentiment away from bullish undertones.
My cautiously bearish short-term trading call in the current context means I am not anticipating a breakdown below the current trading range. Instead, I am bracing for yet another test of the recent lows and/or the uptrending 200DMA on the S&P 500. I will flip right through neutral and go to bullish if the S&P 500 sprints into overbought territory with a new 50DMA breakout. Note well that I decided to hold onto my short-term SPY shares despite my bearish turn in sentiment.
CHART REVIEWS
Boeing (NYSE:BA)
When BA finally nudged above its 50DMA, I thought it indicated market sentiment was improving enough for me to get bullish soon. Instead, BA’s momentum stopped cold, and the stock closed the week marginally below its 50DMA. For the first time since I started trading BA in this market churn, I failed to profit from put options on the stock.
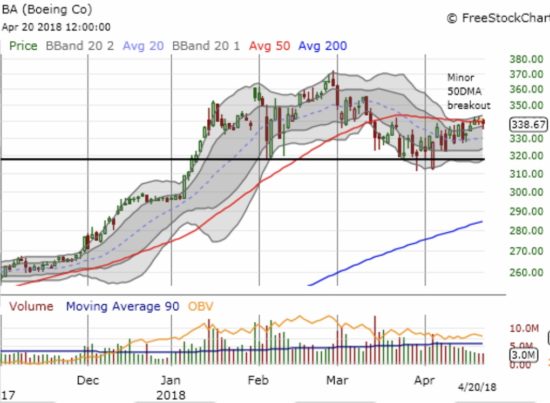
Boeing (BA) tried to break out of its pattern of churn but could not quite summon up enough momentum. The stock pivoted around its 50DMA the last three days.
Apple (NASDAQ:AAPL)
AAPL may have single-handedly been responsible for stopping the market’s upward momentum in its tracks. Fresh panics over iPhone sales took AAPL down first to its 50DMA support with a 2.8% loss. On Friday, AAPL sold off even more at a whopping 4.1% to its 200DMA support.
Given my near automatic weekly call buying strategy in AAPL I bought a single call at Thursday’s close as a “no regret” position to make sure I had something on in case AAPL bounced off support. I doubled down with two more call options near Friday’s close. However, I am not optimistic about this position as I pause to survey the landscape. This trade could be my first loss on this strategy in many weeks.
Indeed, in hindsight, if I was actively trying to anticipate AAPL’s next moves, I sure would have loaded up on put options as soon as AAPL gapped down below its 50DMA. Continued selling below the 200DMA would be consistent with my cautiously bearish short-term trading call on the stock market.
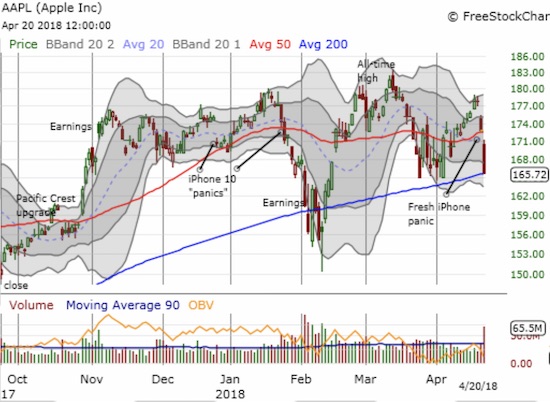
Apple (AAPL) swiftly lost 6.8% in just two days. Adding to the damage down since the February sell-off, I am afraid buyers could slowly but surely be getting exhausted.
Skechers (NYSE:SKX)
Every where I turn I seem to notice the blow-up of retail stocks; as if I have not received enough confirmations already that the retail recovery trade for 2018 is long over. Skechers is one of the most unfortunate victims of post-earnings malaise. SKX managed to hit a 2 1/2 year high going into earnings. Coming out of earnings, SKX crashed right through 50 and 200DMA supports on its way to a 27.0% loss for the day.
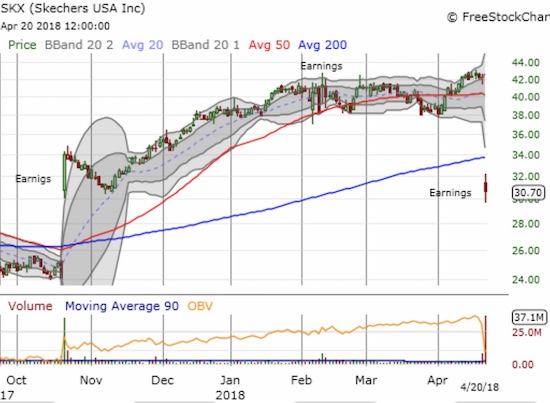
Skechers (SKX) lost 6 months of hard fought gains in just one day of trading. A fill of the October post-earnings gap up is now in play.
Consumer Staples Select Sector SPDR® Fund (NYSE:XLP)
Stocks in the consumer staples sector have been in bearish territory since XLP broke down below its 200DMA in February. Resistance from the 200DMA was confirmed in February as well. The 50DMA crossed below the 200DMA in late March and has now provided even stiffer resistance for XLP. The sell-off of the last two days took XLP down to a new 16-month low and a dismal -11.2% year-to-date performance.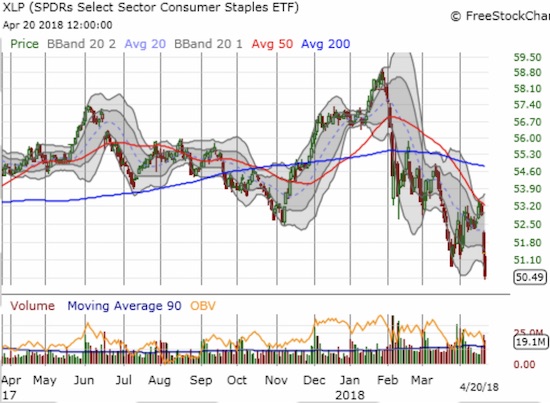
The Consumer Staples Select Sector SPDR® Fund (XLP) confirmed its bearish positioning by failing to break through rapidly declining resistance from its 50DMA.
SPDR® Gold Shares (NYSE:GLD) and iShares Silver Trust (NYSE:SLV)
At the end of March, I made the case for a pairs trade going long silver and short gold. The second time proved a charm as less than 4 weeks later, silver finally popped and greatly outpaced gold. Last week, SLV gapped above its 200DMA. That same day, GLD also gapped up but quickly faded to reverse most of its gain. GLD pulled back two more days while SLV held its ground. I used this sharp divergence as an opportunity to take profits on my pairs trade. My next short-term trade will focus on buying SLV call options on a dip and hedging it with very little to no GLD puts.
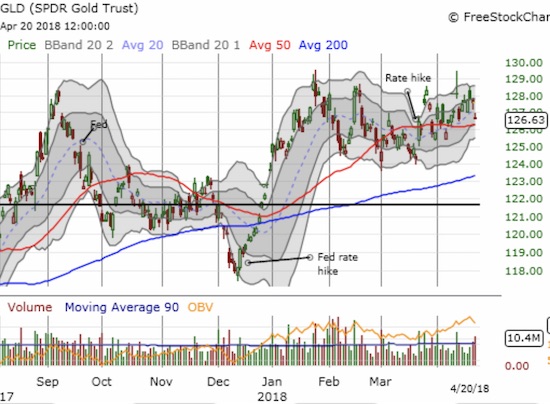
The SPDR® Gold Shares (GLD) tried to sneak away again from a Fed rate hike but gravity proved to be too much this time.
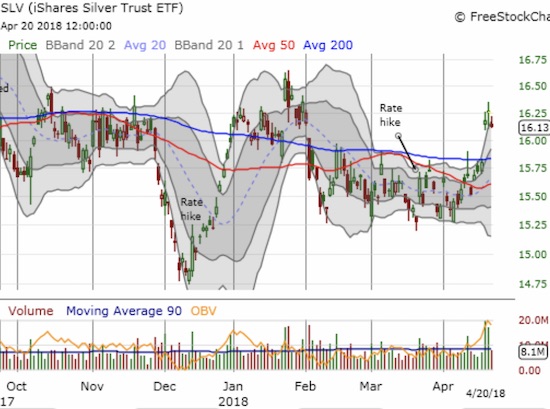
The iShares Silver Trust (SLV) HAS succeeded in sneaking away from another Fed rate hike. This 200DMA breakout looks encouraging but so many breakouts have failed since November 2016.
AMC Entertainment (NYSE:AMC)
When my trade in AMC hit a new all-time low in November, I called it a 2018 recovery story. I am glad I hung in there. AMC soon bounced sharply off that low. I did not take profits from that rally, but I did finally sell AMC after it hit a new high post August earnings. AMC experienced a minor breakout last week but momentum faded with the general market’s pullback. If AMC successfully tests its 200DMA as support, I will likely return in anticipation of a confirmed breakout from what is now a wide-swinging 8-month trading range above its all-time low.
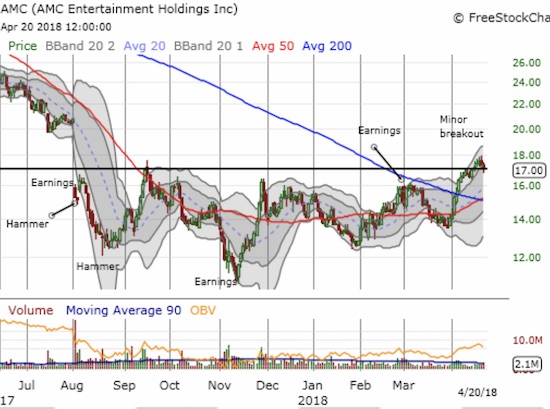
AMC Entertainment Holdings, Inc. (AMC) is trying hard to break out of an extended trading range.
“Above the 40” uses the percentage of stocks trading above their respective 40-day moving averages (DMAs) to assess the technical health of the stock market and to identify extremes in market sentiment that are likely to reverse. Abbreviated as AT40, Above the 40 is an alternative label for “T2108” which was created by Worden. Learn more about T2108 on my T2108 Resource Page. AT200, or T2107, measures the percentage of stocks trading above their respective 200DMAs.
Active AT40 (T2108) periods: Day #45 over 20%, Day #14 over 30%, Day #9 over 40%, Day #5 over 50% (overperiod), Day #2 under 60% (last 60% underperiod ended at 49 days on April 17th), Day #59 under 70% (intraday high of 67.6% on April 18th)
Daily AT40 (T2108)
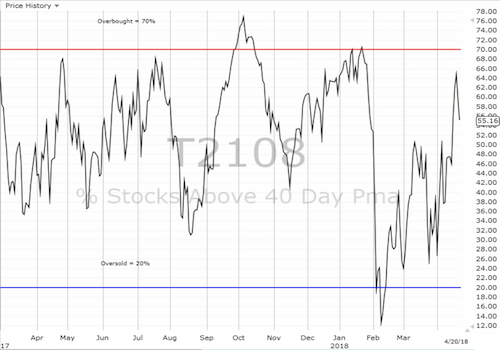
Black line: AT40 (T2108) (% measured on the right)
Red line: Overbought threshold (70%); Blue line: Oversold threshold (20%)
Weekly AT40 (T2108)
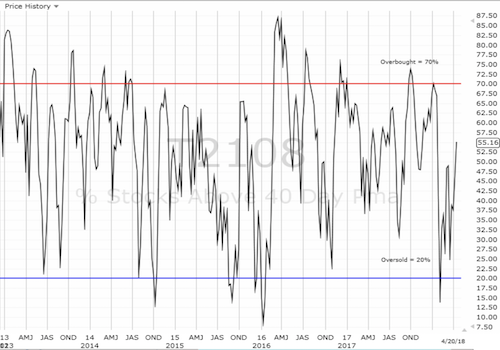
Be careful out there!
Additional disclosure: long SPY shares, long UVXY calls, long GLD, long SLV, long AAPL calls
*Charting notes: FreeStockCharts.com stock prices are not adjusted for dividends. TradingView.com charts for currencies use Tokyo time as the start of the forex trading day. FreeStockCharts.com currency charts are based on Eastern U.S. time to define the trading day.
