AT40 = 48.1% of stocks are trading above their respective 40-day moving averages (DMAs)
AT200 = 54.9% of stocks are trading above their respective 200DMAs
VIX = 11.3 (a new all-time low!)
Short-term Trading Call: cautiously bullish
Commentary
It was by the slimmest of margins, but the S&P 500 (via SPDR S&P 500 (NYSE:SPY)) finally ended a week with a loss. After 8 straight weeks of gains, the index closed the last week with a 0.2% loss as Friday slipped by 0.1%.
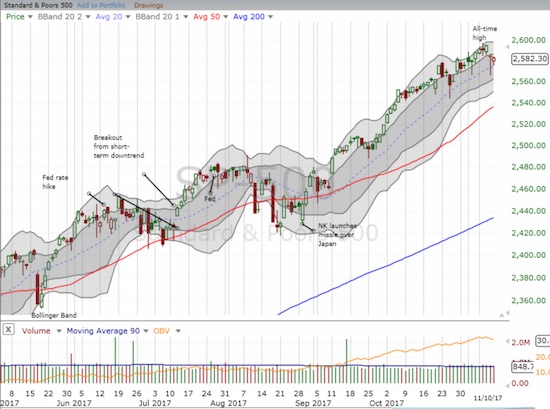
The S&P 500 (SPY) survived a dip on Thursday, but slipped again on Friday. The uptrending 20-day moving average (DMA) is just barely holding as support.
For a hot minute, the dip on Thursday looked like the resolution of the bearish divergence which revealed the narrowing of the latest rally. The day looked very similar to a resolution from two weeks prior, but this time around the buyers were even more successful at erasing the losses with a same day reversal. Unlike the dip from two weeks ago, the next day did not deliver buying follow-through. Interestingly, the trading placed the volatility index, the VIX, right back to where it was two weeks ago with a gain of 7.5% on the day and 24% for the week.
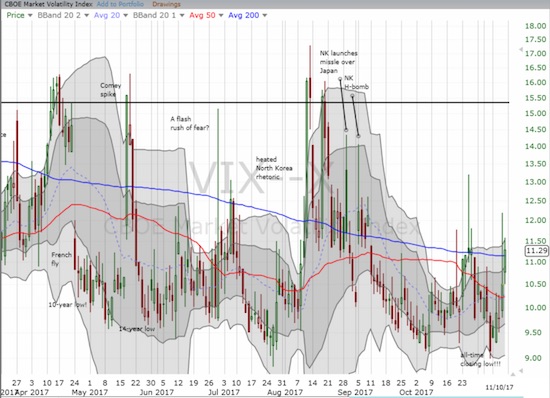
The volatility index, the VIX, came alive this week and actually fought off the automatic volatility faders.
The iShares Russell 2000 ETF (NYSE:IWM) became the highlight of the narrowing rally. IWM has declined almost steadily since its last closing all-time high 5 weeks ago. Critically, IWM spent the last three days struggling to hold onto its 50DMA support.
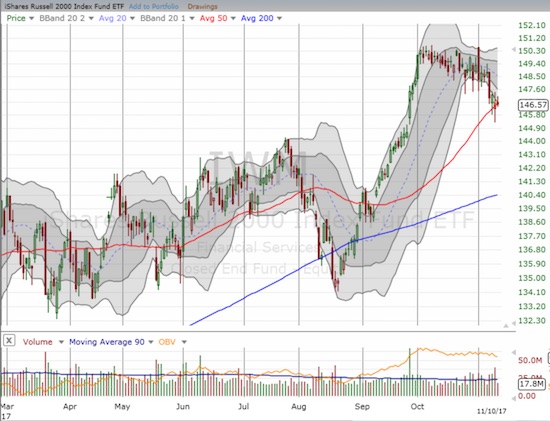
The iShares Russell 2000 ETF (IWM) is cooling off from a sharp rally off the August low. The 50DMA line of support has so far halted the slide.
Financials also contributed to the resolution of bearish divergence by buckling this past week off a 10-year high. Like IWM, the Financial Select Sector SPDR ETF (NYSE:XLF) has its 50DMA creating a critical support line. I am watching closely for a buy-the-dip opportunity to load up on a new tranche of call options.
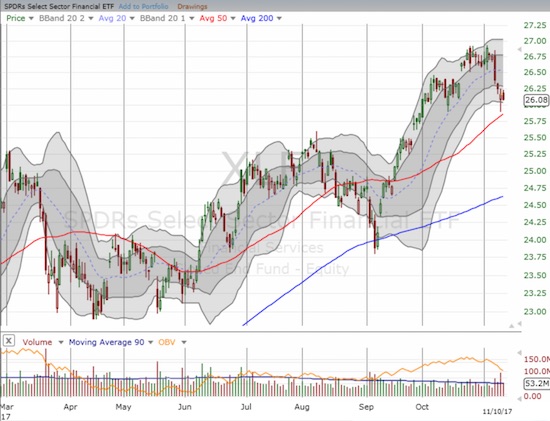
The Financial Select Sector SPDR ETF (XLF) sold off sharply from its 10-year high. Will its 50DMA hold as support?
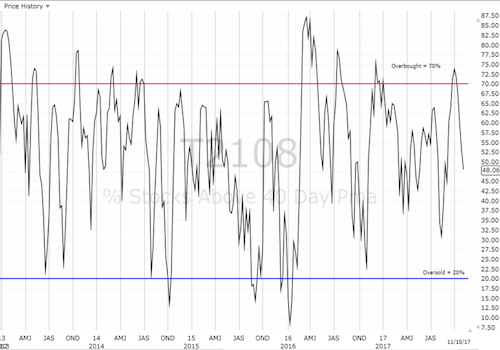
AT40 (T2108), the percentage of stocks trading above their respective 40DMAs, closed the week at 48.1% and a 2-month low. Its steady 5-week decline from overbought conditions closely matches the decline in IWM. AT200 (T2107), the percentage of stocks trading above their respective 200DMAs, also peaked in early October but has declined much less sharply. AT200 declined from 60.8% to 54.9%. This gentle slope helps explain why the major indices have yet to produce a major dip during the narrowing of the rally. While I was looking for the rally to start broadening last week, I am now thinking the current trends will continue absent a catalyst to produce significant buying interest.
STOCK CHART REVIEWS
Caterpillar (NYSE:CAT)
CAT inspired industrials two weeks ago with a major post-earnings gap up to a new all-time high. Buyers have yet to follow-through on the excitement. On Thursday, CAT gapped down to a post-earnings low. I added to an existing call option as one of my few dip buys in anticipation of a downside resolution of the previous bearish divergence. CAT rallied off uptrending 20DMA support on Friday.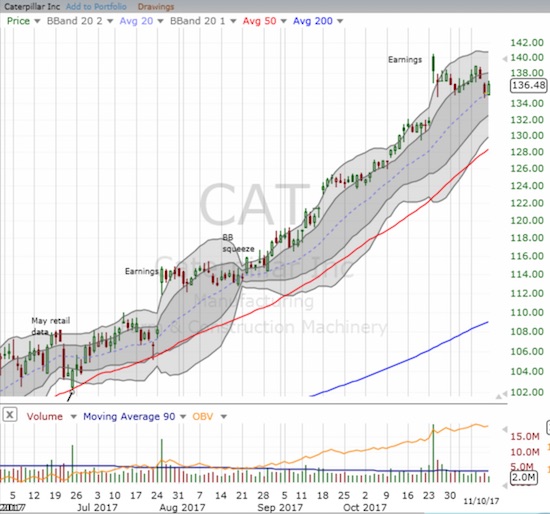
Caterpillar (CAT) fell from its primary uptrend through its upper Bollinger Band (BB) channel. The post-earnings gap up is starting to look like a blow-off top, but the stock has a chance for repair at its uptrending 20DMA support.
Blue Apron Holdings Inc (NYSE:APRN)
I took a small chance on APRN. It completely failed. This company really should never have gone public. Bankruptcy anyone? The chart says it all.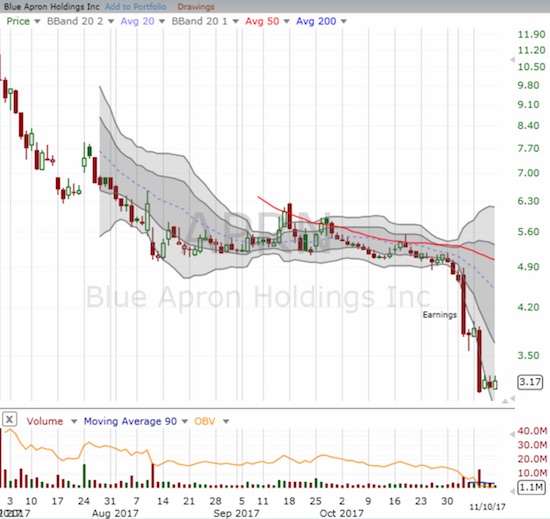
Blue Apron (APRN) looks like it cooked itself. The post-IPO slide resumed after a disastrous earnings report.
AMC Entertainment Holdings Inc (NYSE:AMC)
I was hopeful for AMC. This now looks like a 2018 recovery story. The stock ended the week at a new all-time low.
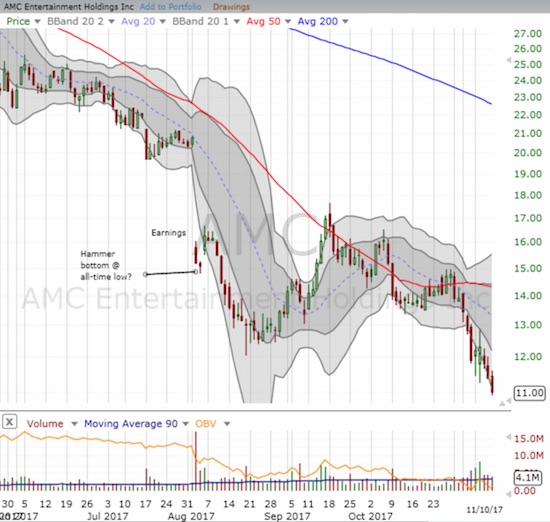
AMC Entertainment Holding (AMC) hit a new all-time low. A positive catalyst now looks some time away.
Impinj Inc (NASDAQ:PI)
This is a bottom-fishing play that is working out very well so far. Earnings were extremely disappointing for the second report in a row. I think the steepness of the sell-offs are the release of overly inflated expectations. Using my bottom-fishing rules, I bought PI after it closed at a post-earnings high. My optimistic upside target is around $30 where the downtrending 20DMA is headed.
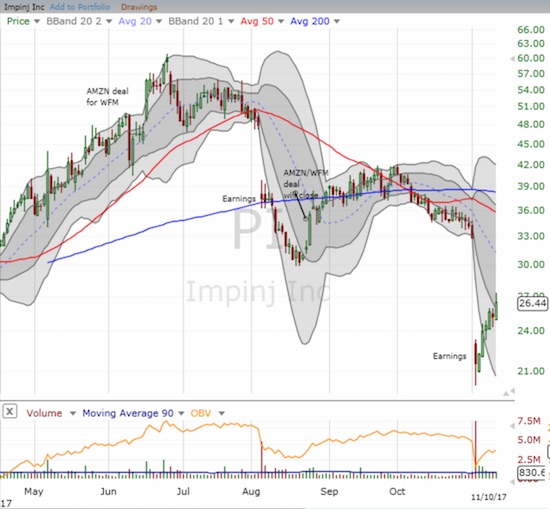
Impinj (PI) is a stock breaking down. Can the current post-earnings recovery mark the beginnings of a sustainable bottom?
DexCom Inc (NASDAQ:DXCM)
DXCM also triggered a bottom-fishing buy, but it quickly started sliding again after that. The lows held and a post-earnings gap up seem to confirm a bottom in the making. I wrote about the DXCM play in “The Danger in DexCom…and the Opportunity.”
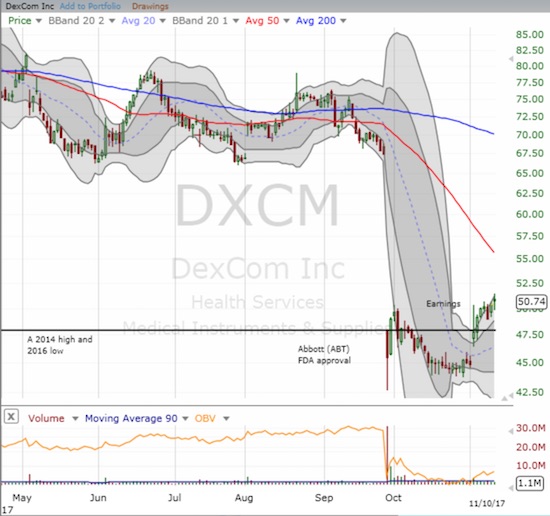
A bottoming seems underway for DexCom (DXCM) as earnings help to propel the stock to a fresh post-Abbott news high.
Teva Pharma Industries Ltd ADR (NYSE:TEVA)
The pain is unending for TEVA. I dove back into this one WITHOUT the confirmation that comes with the bottom-fishing rules because I thought I had fundamental reasons for taking the risk. The chart below speaks volumes! TEVA is likely also helping to drag stakeholder Allergan (NYSE:AGN) lower and lower.
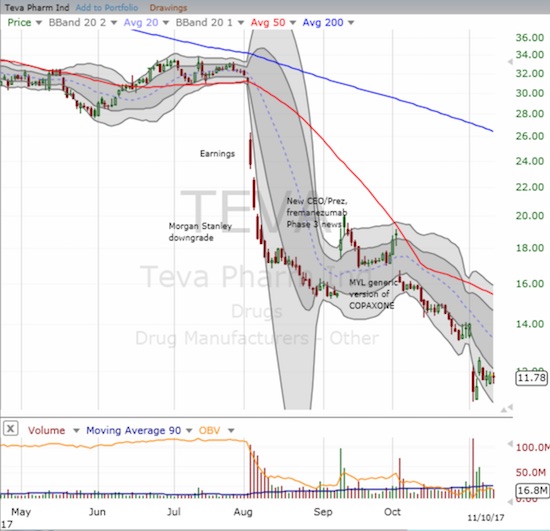
Teva Pharmaceuticals (TEVA) continues a mighty struggle. The stock nows sits at a 17+ year low!
Tableau Software (NYSE:DATA)
DATA is one strange stock. Ever since a massive post-earnings collapse in February, 2016, subsequent earnings have produced big moves. Sometimes the stock sold off post-earnings only to turn right around and rally to new heights. Ahead of its latest earnings, DATA sat at a near double for the year. This optimism was apparently misplaced for the latest report as the stock gapped down below 50DMA support post-earnings for a 10% loss. It now trades right around where it did right after the previous earnings report. I tried a pre-earnings play that failed and reached for a play on a bottom after buyers started showing up. A new post-earnings low would be very bearish for the stock.
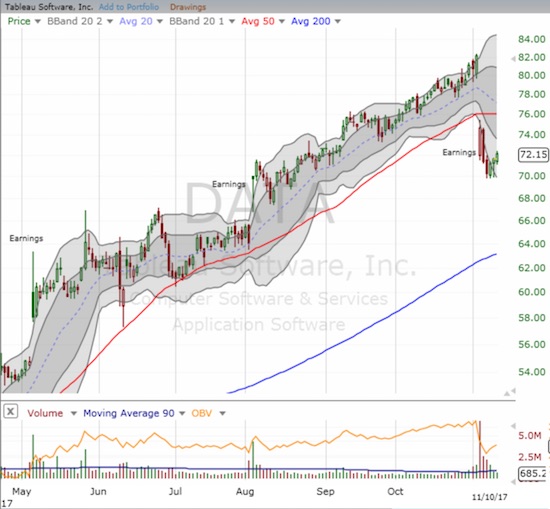
Tableau Software (DATA) closed below 50DMa support for the first time since April.
El Pollo Loco Holdings Inc (NASDAQ:LOCO)
LOCO joined the carnage infecting so many casual dining plays. If not for the widespread malaise, I would have held onto my shares as part of my second swing through the chicken trade. Buyers are already creeping back into the stock, so I am watching closely for a post-earnings closing high to buy.
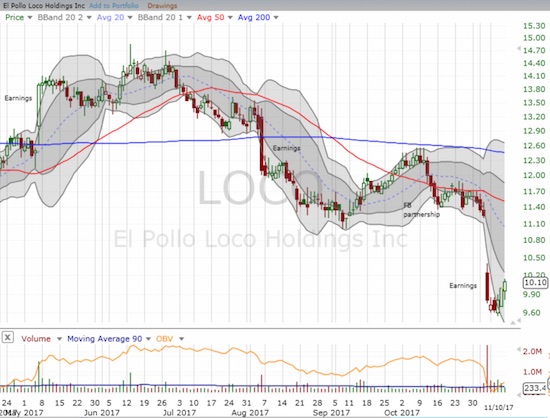
El Pollo Loco Holdings (LOCO) suffered a second poor earnings report in a row. The stock now trades back at the all-time lows hit two years ago.
Red Robin Gourmet Burgers Inc (NASDAQ:RRGB)
RRGB is a poster child for the carnage in casual dining. The stock collapsed 29% toward its low for the year on what was an awful earnings report. The company completely reset expectations by guiding down Q4 EPS to $0.45-$0.60 vs. $1.00 analyst “consensus.” The only thing going for RRGB now is the 45.2% short position. The longer the stock fails to make fresh post-earnings lows, the more likely nervous bears will start covering (and presumably take profits). I LOVE the turkey burgers and (now bottomless) sweet potato fries. I wish I could love the stock similarly.
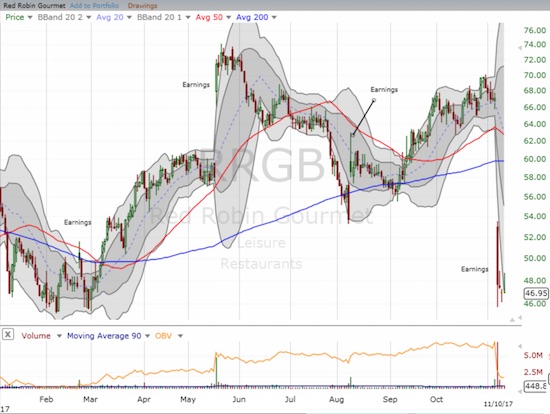
Red Robin Gourmet Burgers (RRGB) suffered a devastating and very bearish double breakdown through 50 and 200DMA supports.
Zynga Inc (NASDAQ:ZNGA)
Two months ago, I pointed out the breakout for Zynga (ZNGA). I held onto my shares and braced myself for earnings. I felt like a genius as the stock soared to a new 3 1/2 year high. Unfortunately, the sellers stepped in soon thereafter and took profits back down to the current consolidation range. I now sit and wait for the next positive catalyst…
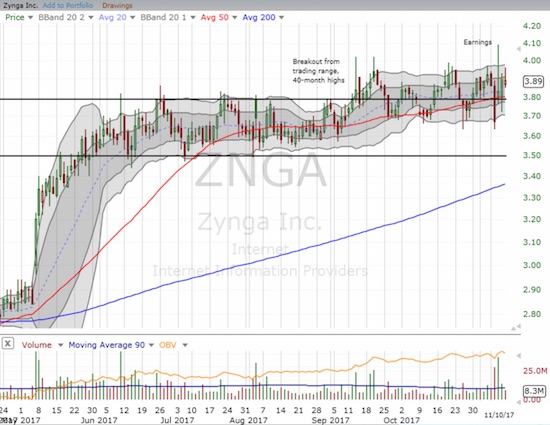
Zynga (ZNGA) is on a very extended “two-stage” consolidation. The three major moving averages support future upside.
United States Steel Corporation (NYSE:X)
The recovery in U.S. Steel continued with a big gap up from earnings after market October 31. The move kept intact the steady uptrend in the 50DMA. The move also “stranded” a bunch of sellers who panicked ahead of earnings and created a 50DMA breakdown. This island, also known as an abandoned baby bottom, serves as a very clear line in the sand for a higher bottom in U.S. Steel. With the 50 and 200DMAs converging as well, X maintains a bullish look.
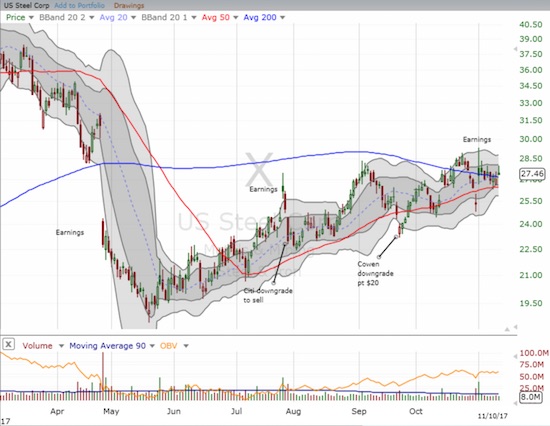
U.S. Steel (X) survived another earnings report by returning to a bullish position above its 50 and 200DMAs
“Above the 40” uses the percentage of stocks trading above their respective 40-day moving averages (DMAs) to assess the technical health of the stock market and to identify extremes in market sentiment that are likely to reverse. Abbreviated as AT40, Above the 40 is an alternative label for “T2108” which was created by Worden. Learn more about T2108 on my T2108 Resource Page. AT200, or T2107, measures the percentage of stocks trading above their respective 200DMAs.
Active AT40 (T2108) periods: Day #432 over 20%, Day #246 over 30%, Day #46 over 40% (overperiod), Day #2 under 50% (underperiod), Day #13 under 60%, Day #20 under 70%
Daily AT40 (T2108)
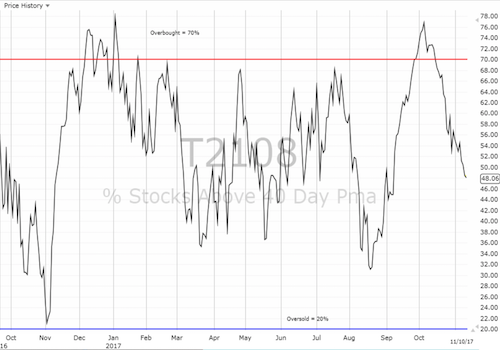
Black line: AT40 (T2108) (% measured on the right)
Red line: Overbought threshold (70%); Blue line: Oversold threshold (20%)
Weekly AT40 (T2108)
Be careful out there!
Full disclosure: long AMC, long APRN, long CAT calls, long DATA calls, long DXCM, long PI, long TEVA calls, long ZNGA
